Umzumbe Local Municipality
Umzumbe | |
|---|---|
 Seal | |
 Location in KwaZulu-Natal | |
| Country | South Africa |
| Province | KwaZulu-Natal |
| District | Ugu |
| Seat | Mtwalume |
| Wards | 19 |
| Government | |
| • Type | Municipal council |
| • Mayor | Londolo Zungu |
| Area | |
| • Total | 1,259 km2 (486 sq mi) |
| Population (2011)[2] | |
| • Total | 160,975 |
| • Density | 130/km2 (330/sq mi) |
| Racial makeup (2011) | |
| • Black African | 99.6% |
| • Coloured | 0.1% |
| • Indian/Asian | 0.1% |
| • White | 0.1% |
| First languages (2011) | |
| • Zulu | 95.9% |
| • Southern Ndebele | 1.0% |
| • Other | 3.1% |
| Time zone | UTC+2 (SAST) |
| Municipal code | KZN213 |
Umzumbe Local Municipality is an administrative area in the Ugu District of KwaZulu-Natal in South Africa.
The municipality is named after the .[3]
Towns within the municipal boundaries: , , St Faith’s, Umzumbe.[4]
Income levels in Umzumbe are very low, and reflect a situation of acute impoverishment. Almost 60% of all households have an income of less than R500 per month. Households rely for survival on pension and other welfare grants, migrant remittances, informal earnings and casual employment wages.[5]
Main places[]
The 2001 census divided the municipality into the following main places:[6]
| Place | Code | Area (km2) | Population |
|---|---|---|---|
| 50301 | 9.38 | 477 | |
| 50302 | 275.53 | 24,598 | |
| 50303 | 39.27 | 5,363 | |
| 50304 | 41.85 | 6,065 | |
| 50305 | 19.89 | 3,853 | |
| 50306 | 62.10 | 8,776 | |
| 50307 | 107.60 | 18,178 | |
| 50308 | 83.03 | 16,764 | |
| 50309 | 171.52 | 19,130 | |
| 50310 | 54.51 | 14,177 | |
| 50311 | 57.40 | 10,504 | |
| 50312 | 15.89 | 1,541 | |
| St Faith’s | 50313 | 113.56 | 10,652 |
| 50314 | 89.76 | 45,733 |
Politics[]
The municipal council consists of thirty-nine members elected by mixed-member proportional representation. Twenty councillors are elected by first-past-the-post voting in twenty wards, while the remaining nineteen are chosen from party lists so that the total number of party representatives is proportional to the number of votes received. In the election of 3 August 2016 the African National Congress (ANC) won a majority of thirty seats on the council. The following table shows the results of the election.[7][8]
| Party | Votes | Seats | ||||||
|---|---|---|---|---|---|---|---|---|
| Ward | List | Total | % | Ward | List | Total | ||
| ANC | 32,816 | 33,309 | 66,125 | 75.6 | 20 | 10 | 30 | |
| IFP | 7,500 | 7,097 | 14,597 | 16.7 | 0 | 6 | 6 | |
| EFF | 1,415 | 1,584 | 2,999 | 3.4 | 0 | 1 | 1 | |
| Democratic Alliance | 685 | 661 | 1,346 | 1.5 | 0 | 1 | 1 | |
| African People's Convention | 587 | 628 | 1,215 | 1.4 | 0 | 1 | 1 | |
| Strength of Humanity | 320 | 392 | 712 | 0.8 | 0 | 0 | 0 | |
| Independent | 509 | – | 509 | 0.6 | 0 | – | 0 | |
| Total | 43,832 | 43,671 | 87,503 | 100.0 | 20 | 19 | 39 | |
| Spoilt votes | 1,244 | 1,284 | 2,528 | |||||
References[]
- ^ "Contact list: Executive Mayors". Government Communication & Information System. Archived from the original on 14 July 2010. Retrieved 22 February 2012.
- ^ a b c "Statistics by place". Statistics South Africa. Retrieved 27 September 2015.
- ^ South African Languages - Place names
- ^ "Umzumbe Local Municipality Contact Details". Department of Co-operative Governance and Traditional Affairs: Home. Retrieved 12 September 2013.
- ^ KwaZulu-Natal Top Business - Umzumbe Municipality
- ^ Lookup Tables - Statistics South Africa
- ^ "Results Summary – All Ballots: Umzumbe" (PDF). Independent Electoral Commission. Retrieved 29 December 2016.
- ^ "Seat Calculation Detail: Umzumbe" (PDF). Independent Electoral Commission. Retrieved 29 December 2016.
External links[]
| Metropolitan | 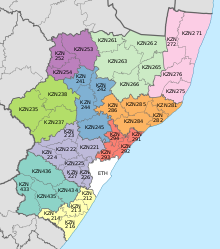 | ||||||||||||||||||||
|---|---|---|---|---|---|---|---|---|---|---|---|---|---|---|---|---|---|---|---|---|---|
| District and local |
| ||||||||||||||||||||
List of municipalities in KwaZulu-Natal | |||||||||||||||||||||

- Local municipalities of the Ugu District Municipality
- KwaZulu-Natal South Coast