Mtubatuba Local Municipality
Mtubatuba | |
|---|---|
 Seal | |
 Location in KwaZulu-Natal | |
| Country | South Africa |
| Province | KwaZulu-Natal |
| District | uMkhanyakude |
| Seat | Mtubatuba |
| Wards | 20 |
| Government | |
| • Type | Municipal council |
| • Mayor | Velangenkisi Gumede |
| Area | |
| • Total | 1,738 km2 (671 sq mi) |
| Population (2011)[2] | |
| • Total | 175,425 |
| • Density | 100/km2 (260/sq mi) |
| Racial makeup (2011) | |
| • Black African | 98.1% |
| • Coloured | 0.4% |
| • Indian/Asian | 0.3% |
| • White | 1.1% |
| First languages (2011) | |
| • Zulu | 93.1% |
| • English | 2.9% |
| • Southern Ndebele | 1.3% |
| • Other | 2.7% |
| Time zone | UTC+2 (SAST) |
| Municipal code | KZN275 |
Mtubatuba is an administrative area in the Umkhanyakude District of KwaZulu-Natal in South Africa.
Main places[]
The 2001 census divided the municipality into the following main places:[4]
| Place | Code | Area (km2) | Population |
|---|---|---|---|
| 53602 | 155.88 | 132 | |
| Dukuduku | 53601 | 3.51 | 6,364 |
| 53603 | 0.62 | 788 | |
| 53604 | 9.66 | 10,647 | |
| 53605 | 1.40 | 5,233 | |
| Mtubatuba | 53612 | 4.67 | 2,020 |
| 53607 | 221.22 | 424 | |
| Sokhulu | 53608 | 36.91 | 6,450 |
| St Lucia Estuary | 53610 | 18.85 | 134 |
| St Lucia | 53609 | 2.82 | 864 |
| 53611 | 36.47 | 0 | |
| Remainder of the municipality | 53606 | 211.47 | 2,136 |
Politics[]
The municipal council consists of forty-five members elected by mixed-member proportional representation. Twenty-three councillors are elected by first-past-the-post voting in twenty-three wards, while the remaining twenty-two are chosen from party lists so that the total number of party representatives is proportional to the number of votes received.
In the election of 1 November 2021 no party obtained a majority. The Inkatha Freedom Party (IFP) received the most seats with nineteen.
The following table shows the results of the election.[5]
| Party | Ward | List | Total seats | |||||
|---|---|---|---|---|---|---|---|---|
| Votes | % | Seats | Votes | % | Seats | |||
| Inkatha Freedom Party | 23,138 | 40.72 | 15 | 25,053 | 44.16 | 4 | 19 | |
| African National Congress | 19,903 | 35.03 | 7 | 20,949 | 36.92 | 9 | 16 | |
| Economic Freedom Fighters | 5,148 | 9.06 | 0 | 5,146 | 9.07 | 4 | 4 | |
| Independent candidates | 3,202 | 5.63 | 1 | 1 | ||||
| African Christian Democratic Party | 1,192 | 2.10 | 0 | 1,263 | 2.23 | 1 | 1 | |
| Democratic Alliance | 1,065 | 1.87 | 0 | 1,119 | 1.97 | 1 | 1 | |
| African Independent Congress | 656 | 1.15 | 0 | 588 | 1.04 | 1 | 1 | |
| United Democratic Movement | 533 | 0.94 | 0 | 531 | 0.94 | 1 | 1 | |
| National Freedom Party | 493 | 0.87 | 0 | 494 | 0.87 | 1 | 1 | |
| United Christian Democratic Party | 502 | 0.88 | 0 | 457 | 0.81 | 0 | 0 | |
| 281 | 0.49 | 0 | 325 | 0.57 | 0 | 0 | ||
| African People's Convention | 164 | 0.29 | 0 | 227 | 0.40 | 0 | 0 | |
| Abantu Batho Congress | 186 | 0.33 | 0 | 159 | 0.28 | 0 | 0 | |
| Al Jama-ah | 99 | 0.17 | 0 | 95 | 0.17 | 0 | 0 | |
| 111 | 0.20 | 0 | 81 | 0.14 | 0 | 0 | ||
| African Transformation Movement | 89 | 0.16 | 0 | 102 | 0.18 | 0 | 0 | |
| Black First Land First | 34 | 0.06 | 0 | 50 | 0.09 | 0 | 0 | |
| National People's Front | 19 | 0.03 | 0 | 60 | 0.11 | 0 | 0 | |
| Patriotic Alliance | 10 | 0.02 | 0 | 37 | 0.07 | 0 | 0 | |
| Total | 56,825 | 100.00 | 23 | 56,736 | 100.00 | 22 | 45 | |
| Valid votes | 56,825 | 98.07 | 56,736 | 98.04 | ||||
| Invalid/blank votes | 1,118 | 1.93 | 1,133 | 1.96 | ||||
| Total votes | 57,943 | 100.00 | 57,869 | 100.00 | ||||
| Registered voters/turnout | 101,008 | 57.36 | 101,008 | 57.29 | ||||
References[]
- ^ "Contact list: Executive Mayors". Government Communication & Information System. Archived from the original on 14 July 2010. Retrieved 22 February 2012.
- ^ a b "Statistics by place". Statistics South Africa. Retrieved 27 September 2015.
- ^ "Statistics by place". Statistics South Africa. Retrieved 27 September 2015.
- ^ Lookup Tables - Statistics South Africa
- ^ "Election Result Table for LGE2021 — Mtubatuba". wikitable.frith.dev. Retrieved 2021-11-28.
External links[]
| Metropolitan | 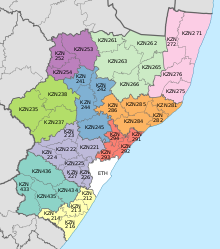 | ||||||||||||||||||||
|---|---|---|---|---|---|---|---|---|---|---|---|---|---|---|---|---|---|---|---|---|---|
| District and local |
| ||||||||||||||||||||
List of municipalities in KwaZulu-Natal | |||||||||||||||||||||

Categories:
- Local municipalities of the Umkhanyakude District Municipality