Yuba County, California
County of Yuba | |
|---|---|
County | |
   | |
 Seal | |
 Interactive map of Yuba County | |
 Location in the state of California | |
| Country | United States |
| State | California |
| Region | Sacramento Valley |
| CSA | Sacramento–Arden-Arcade–Yuba City |
| Incorporated | February 18, 1850[1] |
| Named for | Yuba River |
| County seat | Marysville |
| Largest community | Linda Marysville (incorporated) |
| Area | |
| • Total | 644 sq mi (1,670 km2) |
| • Land | 632 sq mi (1,640 km2) |
| • Water | 12 sq mi (30 km2) |
| Highest elevation | 4,828 ft (1,472 m) |
| Population | |
| • Total | 72,155 |
| • Estimate (2019)[4] | 78,668 |
| • Density | 110/sq mi (43/km2) |
| Time zone | UTC-8 (Pacific Time Zone) |
| • Summer (DST) | UTC-7 (Pacific Daylight Time) |
| Website | www |
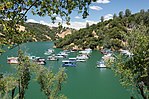
Yuba County is a county in the U.S. state of California. As of the 2010 U.S. Census, the population was 72,155.[3] The county seat is Marysville.[5] Yuba County is included in the Yuba City, California Metropolitan Statistical Area, which is also included in the Sacramento–Roseville, California Combined Statistical Area. The county is in the Central Valley region along the Feather River.
History[]
Yuba County was one of California's original counties, formed in 1850 at the time of statehood. Parts of the county's territory were given to Placer County in 1851, to Nevada County in 1851 and to Sierra County in 1852.
The county was named after the Yuba River by Captain John Sutter for the Maidu village Yubu, Yupu or Juba near the confluence of the Yuba and Feather rivers. General Mariano Vallejo said the river was named Uba by an exploring expedition in 1824 because of the quantities of wild grapes (uvas silvestres in Spanish) which they found growing on its banks.
Geography[]
According to the U.S. Census Bureau, the county has an area of 644 square miles (1,670 km2), of which 632 square miles (1,640 km2) is land and 12 square miles (31 km2) (1.9%) is water.[6] It is California's fifth-smallest county by area. The county lies along the western slope of the Sierra Nevada, the steep slopes making it prime territory for the siting of hydroelectric power plants.
Part of the county, where Marysville (the county seat) and most of the population lives, is west of the mountains on the valley floor. There is a great deal of agriculture business in this part of the county, especially fruit orchards, rice fields, and cattle grazing.[7]
Ecology[]
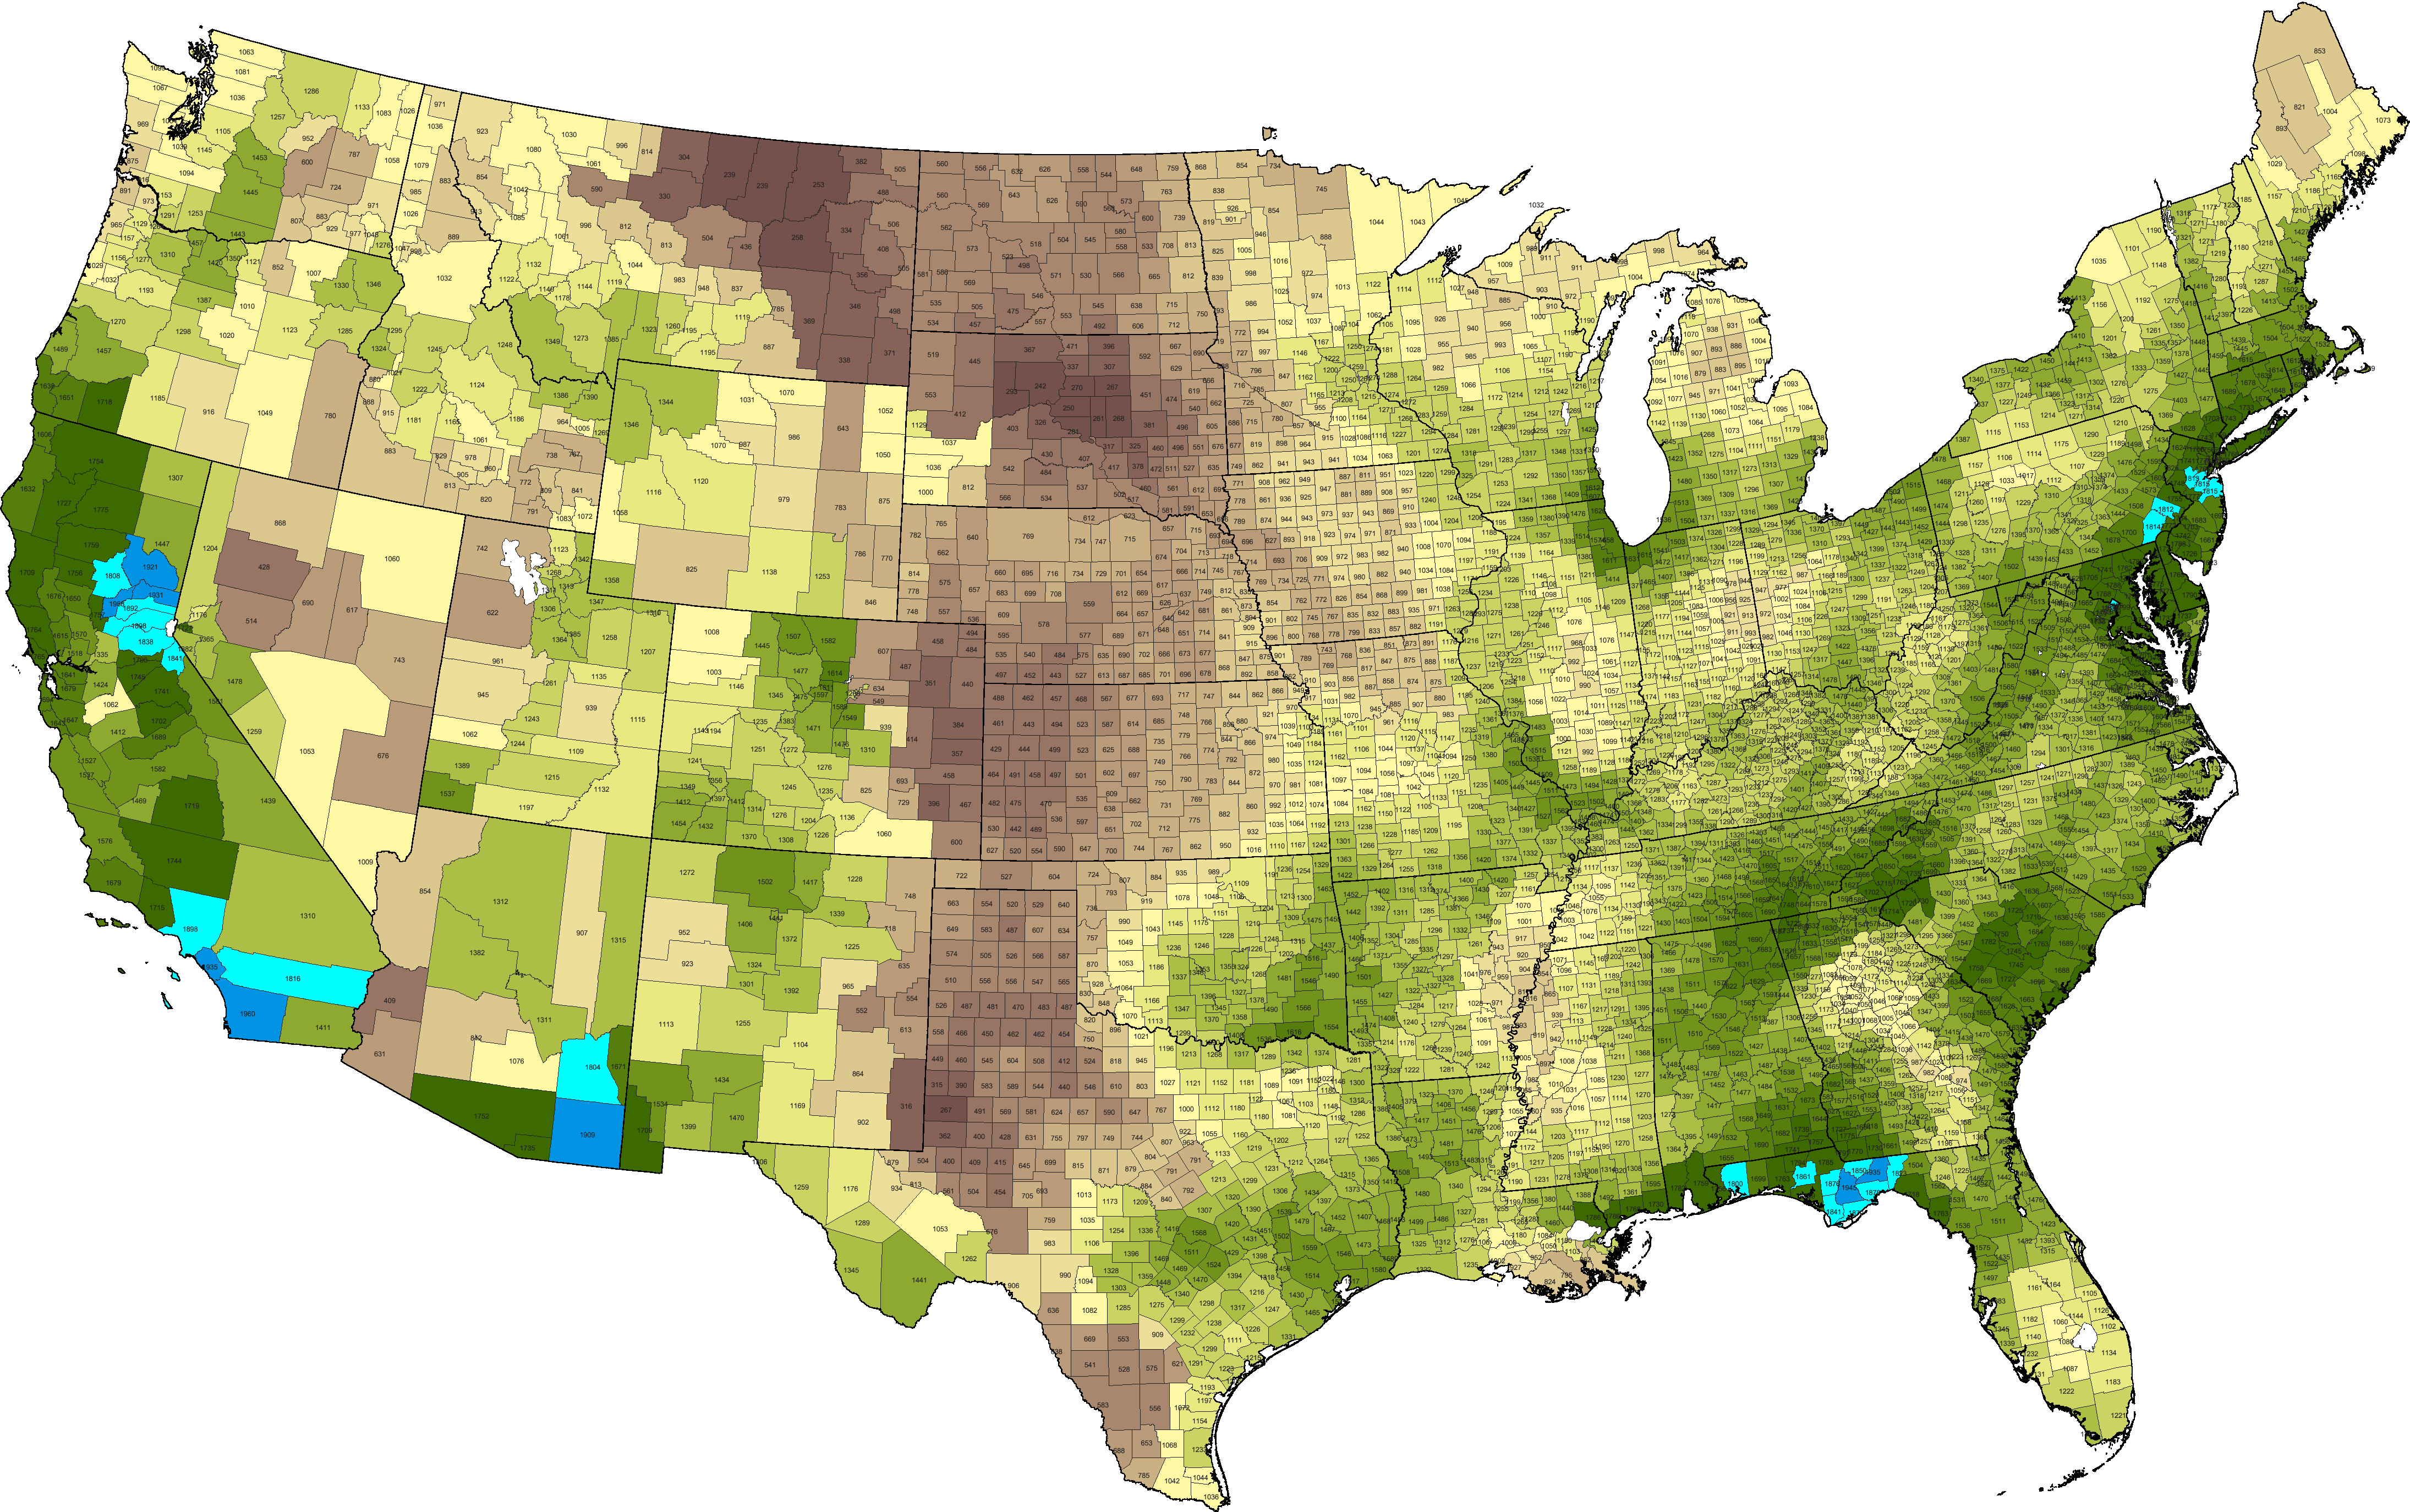
Studies by the Biota of North America Program suggest Yuba is the most biodiverse county in the contiguous United States, with 1,968 native vascular plant species per 10,000 square kilometres (3,860 sq mi),[8] a figure that shades the most species-rich parts of Florida. The county exhibits a considerable diversity of flowering plant species, among them the yellow mariposa lily, Calochortus luteus.[9]
National protected areas in Yuba County include parts of the Plumas National Forest and the Tahoe National Forest. The county also has extensive natural areas consisting of forestation, grassland, riparian area, grassland and other habitats.
Adjacent counties[]
- Butte County to the north
- Sierra County to the northeast
- Nevada County to the east
- Placer County to the southeast
- Sutter County to the southwest
Crime[]
The following table includes the number of incidents reported and the rate per 1,000 persons for each type of offense.
| showPopulation and crime rates |
|---|
Cities by population and crime rates[]
| showCities by population and crime rates |
|---|
Politics[]
Voter registration statistics[]
| showPopulation and registered voters |
|---|
Cities by population and voter registration[]
| showCities by population and voter registration |
|---|
Overview[]
Yuba is a strongly Republican county in presidential and congressional elections. The last Democratic presidential nominee to win a majority in the county was Jimmy Carter in 1976.
In the United States House of Representatives, Yuba County is in California's 3rd congressional district, represented by Democrat John Garamendi.[15]
In the California State Legislature, the county is in the 4th Senate District, represented by Republican Jim Nielsen,[16] and the 3rd Assembly District, represented by Republican James Gallagher.
Transportation[]
Major highways[]
 State Route 20
 State Route 49
 State Route 65
 State Route 70
Public transportation[]
Yuba Sutter Transit operates local bus service, as well as commuter runs to Downtown Sacramento. Greyhound buses stop in Marysville.
Airports[]
Yuba County Airport is three miles (5 km) south of Marysville. It is a general aviation airport.
Brownsville Aero Pines Airport is off La Porte Rd in Brownsville.
Demographics[]
2011[]
| showPopulation, race, and income |
|---|
Places by population, race, and income[]
| showPlaces by population and race |
|---|
| showPlaces by population and income |
|---|
2010[]
The 2010 United States Census reported that Yuba County had a population of 72,155. The racial makeup of Yuba County was 49,332 (68.4%) White, 2,361 (3.3%) African American, 1,675 (2.3%) Native American, 4,862 (6.7%) Asian, 293 (0.4%) Pacific Islander, 8,545 (11.8%) from other races, and 5,087 (7.1%) from two or more races. Hispanic or Latino of any race were 18,051 persons (25.0%).[23]
| showPopulation reported at 2010 United States Census |
|---|
2000[]
| Historical population | |||
|---|---|---|---|
| Census | Pop. | %± | |
| 1850 | 9,673 | — | |
| 1860 | 13,668 | 41.3% | |
| 1870 | 10,851 | −20.6% | |
| 1880 | 11,284 | 4.0% | |
| 1890 | 9,636 | −14.6% | |
| 1900 | 8,620 | −10.5% | |
| 1910 | 10,042 | 16.5% | |
| 1920 | 10,375 | 3.3% | |
| 1930 | 11,331 | 9.2% | |
| 1940 | 17,034 | 50.3% | |
| 1950 | 24,420 | 43.4% | |
| 1960 | 33,859 | 38.7% | |
| 1970 | 44,736 | 32.1% | |
| 1980 | 49,733 | 11.2% | |
| 1990 | 58,228 | 17.1% | |
| 2000 | 60,219 | 3.4% | |
| 2010 | 72,155 | 19.8% | |
| 2019 (est.) | 78,668 | [4] | 9.0% |
| U.S. Decennial Census[24] 1790-1960[25] 1900-1990[26] 1990-2000[27] 2010–2015[3] | |||
As of the census[28] of 2000, there were 60,219 people, 20,535 households, and 14,805 families residing in the county. The population density was 96 people per square mile (37/km2). There were 22,636 housing units at an average density of 36 per square mile (14/km2). The racial makeup of the county was 70.6% White, 3.2% Black or African American, 2.6% Native American, 7.5% Asian, 0.2% Pacific Islander, 10.0% from other races, and 5.9% from two or more races. 17.4% of the population were Hispanic or Latino of any race. 11.2% were of German, 10.4% American, 7.6% Irish and 7.5% English ancestry according to Census 2000. 78.8% spoke English, 13.2% Spanish and 4.7% Hmong as their first language.
There were 20,535 households, out of which 38.1% had children under the age of 18 living with them, 53.2% were married couples living together, 13.3% had a female householder with no husband present, and 27.9% were non-families. 21.7% of all households were made up of individuals, and 8.2% had someone living alone who was 65 years of age or older. The average household size was 2.87 and the average family size was 3.34.
In the county, the population was spread out, with 31.0% under the age of 18, 10.7% from 18 to 24, 28.0% from 25 to 44, 19.6% from 45 to 64, and 10.6% who were 65 years of age or older. The median age was 31 years. For every 100 females, there were 101.6 males. For every 100 females age 18 and over, there were 99.4 males.
The median income for a household in the county was $30,460, and the median income for a family was $34,103. Males had a median income of $27,845 versus $21,301 for females. The per capita income for the county was $14,124. About 16.3% of families and 20.8% of the population were below the poverty line, including 27.6% of those under age 18 and 7.8% of those age 65 or over.
Education[]
Higher education is available at Yuba Community College. The county also has a Yuba County Library system with one branch in Marysville.
Yuba County schools have a 16% suspension rate, with 2,257 students receiving suspensions out of 14,027 students enrolled in Yuba County schools.[29]
Communities[]
Cities[]
- Marysville (county seat)
- Wheatland
Census-designated places[]
- Beale Air Force Base
- Camptonville
- Challenge-Brownsville
- Dobbins
- Linda
- Loma Rica
- Olivehurst
- Plumas Lake
- Smartsville
Other unincorporated communities[]
Ghost towns[]
Population ranking[]
The population ranking of the following table is based on the 2010 census of Yuba County.[30]
† county seat
| Rank | City/Town/etc. | Municipal type | Population (2010 Census) |
|---|---|---|---|
| 1 | Linda | CDP | 17,773 |
| 2 | Olivehurst | CDP | 13,656 |
| 3 | † Marysville | City | 12,072 |
| 4 | Plumas Lake | CDP | 5,853 |
| 5 | Wheatland | City | 3,456 |
| 6 | Loma Rica | CDP | 2,368 |
| 7 | Beale Air Force Base | CDP | 1,319 |
| 8 | Challenge-Brownsville | CDP | 1,148 |
| 9 | Dobbins | CDP | 624 |
| 10 | Smartsville | CDP | 177 |
| 11 | Camptonville | CDP | 158 |
See also[]
- Hiking trails in Yuba County
- National Register of Historic Places listings in Yuba County, California
Notes[]
- ^ Only larceny-theft cases involving property over $400 in value are reported as property crimes.
- ^ Jump up to: a b Percentage of registered voters with respect to total population. Percentages of party members with respect to registered voters follow.
- ^ Other = Some other race + Two or more races
- ^ Native American = Native Hawaiian or other Pacific Islander + American Indian or Alaska Native
References[]
- Specific
- ^ "Chronology". California State Association of Counties. Retrieved February 6, 2015.
- ^ "Yuba County High Point". Peakbagger.com. Retrieved March 30, 2015.
- ^ Jump up to: a b c "State & County QuickFacts". United States Census Bureau. Archived from the original on July 23, 2011. Retrieved April 6, 2016.
- ^ Jump up to: a b "American FactFinder". Archived from the original on June 2, 2013. Retrieved April 19, 2019.
- ^ "Find a County". National Association of Counties. Retrieved June 7, 2011.
- ^ "US Gazetteer files: 2010, 2000, and 1990". United States Census Bureau. February 12, 2011. Retrieved April 23, 2011.
- ^ Caroline M. Olney. 1902
- ^ Biota of North America Program; County-centered estimates of the number of native species per 10000 km2 (data 2011)
- ^ C. Michael Hogan. 2009. Yellow Mariposa Lily: Calochortus luteus, GlobalTwitcher.com, ed. N. Stromberg Archived October 4, 2011, at the Wayback Machine
- ^ Jump up to: a b c d e f g h i j k l m n o p q U.S. Census Bureau. American Community Survey, 2011 American Community Survey 5-Year Estimates, Table B02001. U.S. Census website. Retrieved 2013-10-26.
- ^ Jump up to: a b c d e f g h i j Office of the Attorney General, Department of Justice, State of California. Table 11: Crimes – 2009 Archived December 2, 2013, at the Wayback Machine. Retrieved 2013-11-14.
- ^ Jump up to: a b c United States Department of Justice, Federal Bureau of Investigation. Crime in the United States, 2012, Table 8 (California). Retrieved 2013-11-14.
- ^ Jump up to: a b c d e f g h i j k l m n o p q California Secretary of State. February 10, 2013 - Report of Registration Archived July 27, 2013, at the Wayback Machine. Retrieved 2013-10-31.
- ^ Leip, David. "Dave Leip's Atlas of U.S. Presidential Elections". uselectionatlas.org. Retrieved May 26, 2017.
- ^ "California's 3rd Congressional District - Representatives & District Map". Civic Impulse, LLC. Retrieved March 1, 2013.
- ^ "Communities of Interest — County". California Citizens Redistricting Commission. Archived from the original on October 23, 2015. Retrieved September 28, 2014.
- ^ Jump up to: a b U.S. Census Bureau. American Community Survey, 2011 American Community Survey 5-Year Estimates, Table B03003. U.S. Census website. Retrieved 2013-10-26.
- ^ Jump up to: a b U.S. Census Bureau. American Community Survey, 2011 American Community Survey 5-Year Estimates, Table B19301. U.S. Census website. Retrieved 2013-10-21.
- ^ Jump up to: a b U.S. Census Bureau. American Community Survey, 2011 American Community Survey 5-Year Estimates, Table B19013. U.S. Census website. Retrieved 2013-10-21.
- ^ Jump up to: a b U.S. Census Bureau. American Community Survey, 2011 American Community Survey 5-Year Estimates, Table B19113. U.S. Census website. Retrieved 2013-10-21.
- ^ Jump up to: a b U.S. Census Bureau. American Community Survey, 2011 American Community Survey 5-Year Estimates. U.S. Census website. Retrieved 2013-10-21.
- ^ U.S. Census Bureau. American Community Survey, 2011 American Community Survey 5-Year Estimates, Table B01003. U.S. Census website. Retrieved 2013-10-21.
- ^ "2010 Census P.L. 94-171 Summary File Data". United States Census Bureau.
- ^ "U.S. Decennial Census". United States Census Bureau. Retrieved May 31, 2014.
- ^ "Historical Census Browser". University of Virginia Library. Retrieved May 31, 2014.
- ^ "Population of Counties by Decennial Census: 1900 to 1990". United States Census Bureau. Retrieved May 31, 2014.
- ^ "Census 2000 PHC-T-4. Ranking Tables for Counties: 1990 and 2000" (PDF). United States Census Bureau. Retrieved May 31, 2014.
- ^ "U.S. Census website". United States Census Bureau. Retrieved May 14, 2011.
- ^ "California State - Expulsion, Suspension, and Truancy Information for 2009-10". Retrieved June 25, 2011.
- ^ CNMP, US Census Bureau. "This site has been redesigned and relocated. - U.S. Census Bureau". www.census.gov.
- General
- Caroline M. Olney (December 1902). "Mountains and Valleys of Yuba County". XL (6): 567–588. Cite journal requires
|journal=(help)
External links[]
| Wikimedia Commons has media related to Yuba County, California. |
| show Places adjacent to Yuba County, California |
|---|
| show Municipalities and communities of Yuba County, California, United States |
|---|

| show Authority control |
|---|

- Yuba County, California
- California counties
- Counties in the Sacramento metropolitan area
- Sacramento Valley
- 1850 establishments in California
- Populated places established in 1850