Election in New York
Main article: 1852 United States presidential election
1852 United States presidential election in New York Turnout 84.7%[1] pp
Nominee
Franklin Pierce Winfield Scott
Party
Democratic
Whig
Home state
New Hampshire
New Jersey
Running mate
William R. King William A. Graham
Electoral vote
35
0
Popular vote
262,083
234,882
Percentage
50.18%
44.97%
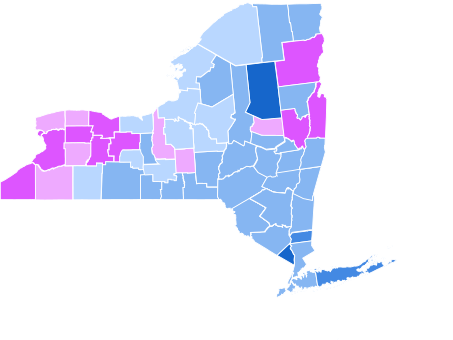
County Results
Pierce
40-50%
50-60%
60-70%
70-80%
Scott
40-50%
50-60%
President before election Millard Fillmore Whig
Elected President Franklin Pierce Democratic
The 1852 United States presidential election in New York took place on November 2, 1852, as part of the 1852 United States presidential election . Voters chose 35 representatives, or electors to the Electoral College , who voted for President and Vice President .
New York voted for the Democratic candidate, Franklin Pierce , over the Whig Party candidate, Winfield Scott . Pierce won the state by a margin of 5.21%. Abolitionist Free Soil party candidate John Hale took 4.85% of the vote. William Goodell of the Liberty party , another smaller abolitionist party, also took a tiny portion of the vote. So did Daniel Webster , running as a Whig nominated against his will by a group of southern Whigs unsatisfied with Scott. Despite dying a few weeks before the election, he received 0.08% of the vote, mostly in New York City. This was one of the few northern states where he received votes.[2]
This was the last strong performance by a Democrat in upstate New York until 1964 , when Lyndon Johnson swept every New York county. It was thus the last time that many New York Counties voted for a Democrat. It was the final election in which the Whig party and not the Republican party provided the main opposition to the Democrats. After the birth of the Republican Party, upstate New York remained a Republican bastion for over a century, even through the Democratic landslides of the 1930s.[3]
Results [ ]
1852 United States presidential election in New York[4]
Party
Candidate
Running mate
Popular vote
Electoral vote
Count
%
Count
%
Democratic
Franklin Pierce of New Hampshire
William Rufus DeVane King of Alabama
262,083
50.13%
35
100.00%
Whig
Winfield Scott of New Jersey
William Alexander Graham of North Carolina
234,882
44.93%
0
0.00%
Free Soil
John Parker Hale of New Hampshire
George Washington Julian of Indiana
25,329
4.85%
0
0.00%
Whig
Daniel Webster of Massachusetts
None of None
413
0.08%
0
0.00%
Liberty
William Goodell of New York
of Virginia
72
0.01%
0
0.00%
Total
522,294
100.00%
35
100.00%
County Results [ ]
County[5]
Pierce
Scott
Hale
Webster
Goodell
Margin
#
%
#
%
#
%
#
%
#
%
Albany
8,364
53.10%
7,246
46.00%
133
0.84%
8
0.05%
0.00%
7.10%
Allegany
4,009
47.97%
3,670
43.92%
678
8.11%
0.00%
0.00%
4.06%
Broome
3,064
50.35%
2,674
43.94%
347
5.70%
0.00%
0.00%
6.41%
Cattaraugus
3,493
44.85%
3,688
47.35%
607
7.79%
0.00%
0.00%
-2.50%
Cayuga
4,552
44.14%
4,838
46.91%
916
8.88%
1
0.01%
6
0.06%
-2.77%
Chautauqua
3,703
35.19%
5,612
53.33%
1,209
11.49%
0.00%
0.00%
-18.14%
Chemung
3,189
54.46%
2,328
39.75%
339
5.79%
0.00%
0.00%
14.70%
Chenango
4,482
51.71%
3,880
44.77%
303
3.50%
0.00%
2
0.02%
6.95%
Clinton
2,812
52.62%
2,287
42.80%
245
4.58%
0.00%
0.00%
9.82%
Columbia
4,456
51.78%
4,142
48.13%
7
0.08%
0.00%
0.00%
3.65%
Cortland
2,064
40.90%
2,328
46.13%
655
12.98%
0.00%
0.00%
-5.23%
Delaware
4,052
52.76%
3,289
42.83%
339
4.41%
0.00%
0.00%
9.93%
Dutchess
5,600
50.32%
5,495
49.38%
33
0.30%
0.00%
0.00%
0.94%
Erie
7,033
45.18%
8,025
51.55%
510
3.28%
0.00%
0.00%
-6.37%
Essex
1,973
40.24%
2,756
56.21%
174
3.55%
0.00%
0.00%
-15.97%
Franklin
2,074
52.49%
1,747
44.22%
130
3.29%
0.00%
0.00%
8.28%
Fulton
2,070
47.52%
2,171
49.84%
115
2.64%
0.00%
0.00%
-2.32%
Genesee
2,166
37.11%
3,358
57.53%
313
5.36%
0.00%
0.00%
-20.42%
Greene
3,242
53.49%
2,803
46.25%
16
0.26%
0.00%
0.00%
7.24%
Hamilton
342
73.08%
126
26.92%
0
0.00%
0.00%
0.00%
46.15%
Herkimer
4,220
56.60%
2,679
35.93%
555
7.44%
0.00%
2
0.03%
20.67%
Jefferson
6,279
49.42%
5,656
44.52%
757
5.96%
0.00%
13
0.10%
4.90%
Kings
10,628
55.00%
8,496
43.97%
66
0.34%
133
0.69%
0.00%
11.03%
Lewis
2,535
55.53%
1,727
37.83%
303
6.64%
0.00%
0.00%
17.70%
Livingston
3,055
40.95%
4,096
54.91%
308
4.13%
0.00%
1
0.01%
-13.95%
Madison
3,435
40.81%
3,379
40.14%
1,584
18.82%
0.00%
20
0.24%
0.67%
Monroe
6,314
43.37%
7,467
51.29%
775
5.32%
1
0.01%
0.00%
-7.92%
Montgomery
3,373
52.63%
2,995
46.73%
40
0.62%
1
0.02%
0.00%
5.90%
New York
34,280
59.27%
23,124
39.98%
200
0.35%
236
0.41%
0.00%
19.29%
Niagara
2,863
39.05%
3,413
46.55%
1,056
14.40%
0.00%
0.00%
-7.50%
Oneida
8,636
49.31%
7,832
44.72%
1,044
5.96%
0.00%
0.00%
4.59%
Onondaga
6,415
45.11%
6,097
42.87%
1,701
11.96%
7
0.05%
1
0.01%
2.24%
Ontario
3,347
40.33%
4,402
53.04%
547
6.59%
1
0.01%
3
0.04%
-12.71%
Orange
5,171
54.96%
4,221
44.86%
16
0.17%
1
0.01%
0.00%
10.10%
Orleans
2,267
41.53%
2,586
47.37%
606
11.10%
0.00%
0.00%
-5.84%
Oswego
4,973
43.22%
4,375
38.03%
2,148
18.67%
0.00%
9
0.08%
5.20%
Otsego
5,488
51.89%
4,454
42.11%
634
5.99%
0.00%
0.00%
9.78%
Putnam
1,521
64.81%
826
35.19%
0
0.00%
0.00%
0.00%
29.61%
Queens
2,904
56.61%
2,209
43.06%
12
0.23%
5
0.10%
0.00%
13.55%
Rensselaer
6,564
50.59%
6,185
47.67%
218
1.68%
7
0.05%
0.00%
2.92%
Richmond
1,324
52.90%
1,147
45.83%
30
1.20%
2
0.08%
0.00%
7.07%
Rockland
1,788
70.92%
733
29.08%
0
0.00%
0.00%
0.00%
41.85%
St. Lawrence
5,584
48.39%
4,570
39.60%
1,386
12.01%
0.00%
0.00%
8.79%
Saratoga
4,292
48.43%
4,498
50.76%
71
0.80%
1
0.01%
0.00%
-2.32%
Schenectady
1,900
53.45%
1,654
46.53%
0
0.00%
1
0.03%
0.00%
6.92%
Schoharie
3,846
56.38%
2,958
43.36%
18
0.26%
0.00%
0.00%
13.02%
Seneca
2,515
50.97%
2,213
44.85%
200
4.05%
1
0.02%
5
0.10%
6.12%
Steuben
6,880
55.21%
5,236
42.02%
345
2.77%
0.00%
0.00%
13.19%
Suffolk
3,307
63.28%
1,917
36.68%
0
0.00%
2
0.04%
0.00%
26.60%
Sullivan
2,681
56.04%
2,059
43.04%
44
0.92%
0.00%
0.00%
13.00%
Tioga
2,815
53.66%
2,234
42.58%
197
3.76%
0.00%
0.00%
11.08%
Tompkins
3,472
44.83%
3,410
44.03%
863
11.14%
0.00%
0.00%
0.80%
Ulster
5,916
53.31%
5,156
46.46%
26
0.23%
0.00%
0.00%
6.85%
Warren
1,713
56.99%
1,174
39.06%
119
3.96%
0.00%
0.00%
17.93%
Washington
3,174
40.35%
4,231
53.79%
461
5.86%
0.00%
0.00%
-13.44%
Wayne
4,050
44.83%
4,033
44.64%
941
10.42%
0.00%
10
0.11%
0.19%
Westchester
5,283
56.34%
4,033
43.01%
55
0.59%
6
0.06%
0.00%
13.33%
Wyoming
2,471
39.84%
3,005
48.44%
727
11.72%
0.00%
0.00%
-8.61%
Yates
2,153
48.37%
1,974
44.35%
324
7.28%
0.00%
0.00%
4.02%
See also [ ] United States presidential elections in New York References [ ]
State results of the 1852 U.S. presidential election
Alabama Arkansas California Connecticut Delaware Florida Georgia Illinois Indiana Iowa Kentucky Louisiana Maine Maryland Massachusetts Michigan Mississippi Missouri New Hampshire New Jersey New York North Carolina Ohio Pennsylvania Rhode Island South Carolina Tennessee Texas Vermont Virginia Wisconsin