From Wikipedia, the free encyclopedia
1874 German federal election Registered 8,523,446 Turnout 5,219,830 (61.24%) pp
First party
Second party
Third party
DZP
DFP
Leader
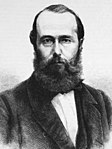
Rudolf von Bennigsen Hermann von Mallinckrodt
Party
NLP
Centre
DFP
Leader since
1867
1870
Last election
28.97%, 117 seats
18.21%, 58 seats
9.04%, 45 seats
Seats won
147
91
48
Seat change
Popular vote
1,394,250
1,438,792
458,133
Percentage
26.86%
27.72%
8.83%
Swing
Fourth party
Fifth party
Sixth party
DRP
DKP
Polen
Party
DRP
Polish Party
Last election
8.83%, 37 seats
13.51%, 56 seats
4.54%, 13 seats
Seats won
32
21
14
Seat change
Popular vote
388,840
352,050
208,797
Percentage
7.49%
6.78%
4.02%
Swing
Map of results (by constituencies)
Federal elections were held in Germany on 10 January 1874.[1] National Liberal Party remained the largest party in the Reichstag , with 147 of the 397 seats.[2] [3]
Results [ ] Party Votes % +/– Seats +/– Centre Party 1,438,792 27.72 +9.51 91 +33 National Liberal Party 1,394,250 26.86 −2.11 147 +30 German Progress Party 458,133 8.83 −0.21 48 +3 German Reich Party 388,840 7.49 −1.34 32 −5 352,050 6.78 −6.73 21 −35 Alsace-Lorraine parties 234,545 4.52 New 15 New Polish Party 208,797 4.02 −0.52 14 +1 General German Workers' Association 179,250 3.45 +2.01 3 +3 Social Democratic Workers' Party 171,873 3.31 +2.25 7 +6 Imperial Liberal Party 98,072 1.89 −5.16 8 −25 German-Hanoverian Party 73,436 1.41 −1.48 4 −3 Independent liberals 69,905 1.35 −0.58 4 −1 German People's Party 39,110 0.75 −0.01 1 0 Independent conservatives 21,546 0.42 +0.04 1 0 Danish Party 19,856 0.38 −0.16 1 0 Schleswig-Holstein Particularist Liberals 13,945 0.27 +0.09 0 −2 8,937 0.17 −0.47 0 −2 Others 18,806 0.36 +0.21 0 0 Unknown 111 0.00 −0.02 0 0 Total 5,190,254 100.00 – 397 +15 Valid votes 5,190,254 99.43 Invalid/blank votes 29,576 0.57 Total votes 5,219,830 100.00 Registered voters/turnout 8,523,446 61.24 Source: Wahlen in Deutschland
Alsace-Lorraine [ ] Party Votes % Seats +/– 106,106 43.86 9 New 83,082 34.35 6 New 45,357 18.75 0 New National Liberal Party 5,072 2.10 0 0 Social Democratic Workers' Party 680 0.28 0 0 Others 1,605 0.66 0 0 Total 241,902 100.00 15 New Valid votes 241,902 99.08 Invalid/blank votes 2,252 0.92 Total votes 244,154 100.00 Registered voters/turnout 319,477 76.42 Source: Wahlen in Deutschland
References [ ]
^ Dieter Nohlen & Philip Stöver (2010) Elections in Europe: A data handbook , p762 ISBN 978-3-8329-5609-7 ^ Nohlen & Stöver, p788
^ Nohlen & Stöver, p772
Parliamentary elections Presidential elections European elections Referendums
See also: Elections and referendums in Baden-Württemberg Bavaria Berlin Brandenburg Bremen Hamburg Hesse Lower Saxony Mecklenburg-Vorpommern North Rhine-Westphalia Rhineland-Palatinate Saarland Saxony Saxony-Anhalt Schleswig-Holstein Thuringia former: East Germany East Prussia
Categories :
Federal elections in Germany 1874 elections in Europe 1874 elections in Germany Elections in the German Empire January 1874 events Hidden categories:
Use dmy dates from November 2013


