1987 West German federal election
| |||||||||||||||||||||||||||||||||||||||||||||||||||||||||||
All 497 seats in the Bundestag[a] 249 seats needed for a majority | |||||||||||||||||||||||||||||||||||||||||||||||||||||||||||
|---|---|---|---|---|---|---|---|---|---|---|---|---|---|---|---|---|---|---|---|---|---|---|---|---|---|---|---|---|---|---|---|---|---|---|---|---|---|---|---|---|---|---|---|---|---|---|---|---|---|---|---|---|---|---|---|---|---|---|---|
| Registered | 45,327,982 | ||||||||||||||||||||||||||||||||||||||||||||||||||||||||||
| Turnout | 38,225,294 (84.3%) | ||||||||||||||||||||||||||||||||||||||||||||||||||||||||||
| |||||||||||||||||||||||||||||||||||||||||||||||||||||||||||
 The left side shows the winning party vote in the constituencies, the right side shows the seats won by parties in each of the states. The pie chart over West Berlin shows the partisan composition of its legislature. | |||||||||||||||||||||||||||||||||||||||||||||||||||||||||||
| |||||||||||||||||||||||||||||||||||||||||||||||||||||||||||

 |
|---|
|
Federal elections were held in West Germany on 25 January 1987 to elect the members of the 11th Bundestag. This was the last federal election held in West Germany before German reunification.
Issues and campaign[]
This section needs additional citations for verification. (September 2021) |
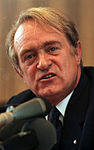
The SPD nominated Johannes Rau, their vice chairman and the Minister-President of North Rhine-Westphalia, as their candidate for Chancellor. However, the SPD suffered from internal divisions and competition with the Greens.[citation needed] It was also unclear as to how they would form a government, as the Greens were divided over whether to take part in governments.[citation needed]
One of the major issues in this election was the environment, after the Chernobyl disaster and other accidents.[citation needed]
Results[]
 | ||||||||||||||
|---|---|---|---|---|---|---|---|---|---|---|---|---|---|---|
| Party | Constituency | Party list | Total seatsa |
+/– | ||||||||||
| Votes | % | Seats | Votes | % | Seats | |||||||||
| Social Democratic Party (SPD) | 14,787,953 | 39.2 | 79 | 14,025,763 | 37.0 | 107 | 186 | −7 | ||||||
| Christian Democratic Union (CDU)b | 14,168,527 | 37.5 | 124 | 13,045,745 | 34.4 | 50 | 174 | −17 | ||||||
| Christian Social Union (CSU)b | 3,859,244 | 10.2 | 45 | 3,715,827 | 9.8 | 4 | 49 | −4 | ||||||
| Free Democratic Party (FDP) | 1,760,496 | 4.7 | 0 | 3,440,911 | 9.1 | 46 | 46 | +12 | ||||||
| The Greens (GRÜNE)c | 2,649,459 | 7.0 | 0 | 3,126,256 | 8.3 | 42 | 42 | +15 | ||||||
| National Democratic Party (NPD) | 182,880 | 0.5 | 0 | 227,054 | 0.6 | 0 | 0 | 0 | ||||||
| Ecological Democratic Party (ÖDP) | 40,765 | 0.1 | 0 | 109,152 | 0.3 | 0 | 0 | 0 | ||||||
| The Women (FRAUEN) | – | – | – | 62,904 | 0.2 | 0 | 0 | New | ||||||
| Bavaria Party (BP) | 8,024 | 0.0 | 0 | 26,367 | 0.1 | 0 | 0 | 0 | ||||||
| Responsible Citizens | 611 | 0.0 | 0 | 24,630 | 0.1 | 0 | 0 | New | ||||||
| Patriots for Germany (Patrioten)d | 27,352 | 0.1 | 0 | 22,732 | 0.1 | 0 | 0 | 0 | ||||||
| Centre Party (ZENTRUM) | 4,020 | 0.0 | 0 | 19,035 | 0.1 | 0 | 0 | 0 | ||||||
| Marxist–Leninist Party of Germany (MLPD) | 596 | 0.0 | 0 | 13,422 | 0.0 | 0 | 0 | New | ||||||
| Christian Bavarian People's Party (CBV) | 741 | 0.0 | 0 | 5,282 | 0.0 | 0 | 0 | 0 | ||||||
| All Social Insurants and Pensioners (ASD) | 3,151 | 0.0 | 0 | 1,834 | 0.0 | 0 | 0 | New | ||||||
| Free German Workers' Party (FAP) | 349 | 0.0 | 0 | 405 | 0.0 | 0 | 0 | New | ||||||
| Humanist Party (HP) | 788 | 0.0 | 0 | – | – | – | 0 | New | ||||||
| Solidarity (SOLIDARITÄT) | 754 | 0.0 | 0 | – | – | – | 0 | New | ||||||
| Independent Workers' Party (UAP) | 352 | 0.0 | 0 | – | – | – | 0 | 0 | ||||||
| Family Party (FAMILIE) | 130 | 0.0 | 0 | – | – | – | 0 | New | ||||||
| Free Social Union (FSU) | 110 | 0.0 | 0 | – | – | – | 0 | 0 | ||||||
| Independents and voter groups | 246,511 | 0.7 | 0 | – | – | – | 0 | 0 | ||||||
| Valid votes | 37,742,813 | 98.7 | – | 37,867,319 | 99.1 | – | – | – | ||||||
| Invalid/blank votes | 482,481 | 1.3 | – | 357,975 | 0.9 | – | – | – | ||||||
| Total votes | 38,225,294 | 100.0 | 248 | 38,225,294 | 100.0 | 249 | 497 | −1 | ||||||
| Registered voters/turnout | 45,327,982 | 84.3 | – | 45,327,982 | 84.3 | – | – | – | ||||||
| Source: Bundeswahlleiter | ||||||||||||||
- ^a – excludes the non-voting delegates for West Berlin (11 CDU, 7 SPD, 2 FDP, 2 AL).
- ^b – The Christian Democratic Union and the Christian Social Union of Bavaria call themselves sister parties. They do not compete against each other in the same geographical regions and they form one group within the Bundestag.
- ^c – known as Alternative Liste für Demokratie und Umweltschutz (AL) in West Berlin.
- ^d – previously the European Workers' Party (Europäische Arbeiter-Partei, EAP).
| 223 | 46 | 186 | 42 |
| CDU/CSU | FDP | SPD | Grüne |

Post-election[]
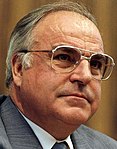
The coalition between the CDU/CSU and the FDP returned to government, with Helmut Kohl as Chancellor. The Greens came into parliament for the second time and seemed to be established on federal level.
Notes[]
| Wikimedia Commons has media related to 1987 Germany Bundestagswahl. |
- ^ As well as 22 non-voting delegates for West Berlin, elected by the West Berlin Legislature.
- ^ As well as 11 non-voting delegates for West Berlin.
- ^ As well as 7 non-voting delegates for West Berlin.
- ^ As well as 2 non-voting delegates for West Berlin.
- ^ As well as 2 non-voting delegates for West Berlin.
References[]
Sources[]
| Parliamentary elections | |
|---|---|
| Presidential elections | |
| European elections | |
| Referendums | |
| |
- Federal elections in Germany
- 1987 elections in Germany
- Helmut Kohl
- January 1987 events in Europe
- 1987 in West Germany