1907 Cisleithanian Imperial Council election Turnout 4,676,350 (84.60%)
First party
Second party
Third party
Leader
Karl Lueger
Victor Adler
Otto Steinwender
Party
CS
SDAP
DVP
Alliance
German National Association
Leader since
1893
1 January 1889
1896
Last election
25 seats, 27.45%
12 seats, 23.39%
51 seats, 6.56%
Seats won
65
50
32
Seat change
Popular vote
542,505
513,219
131,474
Percentage
11.73%
11.12%
2.85%
Swing
Fourth party
Fifth party
Sixth party
Leader
Josef Žďárský
Antonín Němec
Party
RSZML
ČSSD
Alliance
Leader since
1905
1904
Last election
28 seats, 0.80%
2 seats, 0.09%
Stood With SDAP
Seats won
31
27
22
Seat change
New
Popular vote
193,753
206,784
389,960
Percentage
4.20%
4.48%
8.45%
Swing
A legislative election to elect the members of the 11th Imperial Council were held in Cisleithania , the northern and western ("Austrian") crown lands of Austria-Hungary , on 14 and 23 May 1907.[1] [2] universal male suffrage , after an electoral reform abolishing tax paying requirements for voters had been adopted by the Council and was endorsed by Emperor Franz Joseph earlier in the year.[3] [4] [3]
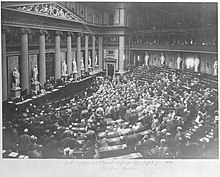
Opening session of the House of Deputies, 17 June 1907
Electoral system [ ] Under the shadow of the Russian Revolution of 1905 and large-scale demonstrations organized by the Social Democrats , the emperor to placate the public had a reform of the former five-class suffrage system, drafted by Minister-President Paul Gautsch von Frankenthurn . His successor, Baron Max Wladimir von Beck , pushed it through against fierce resistance from the Austrian House of Lords and the heir to the throne, Archduke Franz Ferdinand .
Elections in the constituencies of "the Kingdoms and Lands represented in the Imperial Council" were held according to a two-round system . If no candidate received the required absolute majority on May 14, only the two candidates receiving the most votes survived to the second round. on May 23. The 516 representatives of the constituent crown lands were thus elected, 130 from Bohemia , 106 from Galicia , 64 from Lower Austria and 49 from Moravia . The numerous political associations were again split according to ethnicity ("nations"), with a result that no government could ever rely on a stable majority.
Results [ ] The right-wing Christian Social Party emerged as the largest bloc in Parliament, holding 95 of the 516 seats, followed by the Social Democratic Workers' Party of Austria with 50 seats. The former won most rural constituencies in Upper and Lower Austria , Styria , Salzburg , Tyrol , and Vorarlberg ). It also achieved the majority in the capital, Vienna , benefitting from the popularity of the Christian Social mayor, Karl Lueger . In the German constituencies of Bohemia and Moravia and in Carinthia , the German national parties (German People's Party etc.) did well. The Social Democrats had their strongholds in the cities other than Vienna: Graz , Salzburg , Innsbruck , Brno and Linz .
Voter turnout was 84.6%.[5]
Party
Votes
%
Seats
+/-
Croatian Nation
Croatian National Party
23,482
0.51
2
Party of Rights 16,013
0.35
2
People's Party (Anti-Resolutionist) 15,683
0.34
2
New
People's Party (Resolutionist) 15,283
0.33
4
New
Croatian Independents
6,373
0.14
1
New
People's Party (Democratic) 4,441
0.10
0
New
Croatian Nation
Slavic Social Democratic Party
10,518
0.23
0
New
Czech Nation
Social Democratic Party 389,960
8.45
22
New
Czech Agrarian Party 206,784
4.48
27
Catholic-National Conservative Parties in Bohemia & Moravia 182,500
3.95
10
New
Christian Social Party in Bohemia & Moravia 7
Young Czech Party 116,524
2.52
21
Czech National Social Party 75,101
1.63
6
Old Czech Party 32,224
0.70
5
Czech Independents
15,952
0.35
2
Czech Realist Party 14,704
0.32
1
New
Czech Paper Candidates
14,339
0.31
0
New
Czech Radical Progressive Party
9,899
0.21
3
Czech National Party
9,828
0.21
1
Czech Progressive Constitutionalist Party
7,879
0.17
1
German Nation
Christian Social Party 542,505
11.73
65
Social Democratic Party 513,219
11.12
50
German Conservative Party
193,753
4.20
31
Agrarian Party
132,978
2.88
19
German People's Party 131,474
2.85
32
German Progressive Party
103,315
2.24
19
German Radical Party
70,564
1.53
14
New
Pan-German Association
20,693
0.45
3
New
Upper Austrian Farmers' Club
15,283
0.33
0
New
German-National Party 10,457
0.23
0
Officials’ Party
5,701
0.12
0
New
Free Socialists
5,289
0.11
1
New
German Conservative Farmers' Party
4,947
0.011
0
Independent German Radicals
4,569
0.10
0
New
Independent Pan-Germans
3,659
0.08
0
New
German Workers' Party 3,486
0.08
0
New
German-Christian Party
3,286
0.07
0
New
German Independents
2,806
0.06
0
Social Politicians
2,386
0.05
1
Tirol People’s Association 1,113
0.02
0
New
Radical Party
785
0.02
0
New
Central Industrial Committee
150
0.00
0
New
Italian Nation
Trentino People's Party 40,943
0.89
7
New
Italian National-Liberal Party
27,723
0.28
3
Italian Social Democratic Party 19,918
0.43
5
New
Italian-National Party
9,673
0.21
1
Italian Clerical Party
9,599
0.21
2
Italian Christian Social Party
8,977
0.19
1
New
Italian Independents
4,008
0.09
0
New
Italian Liberal Farmers' Association
1,065
0.02
0
New
Jewish Candidates
Jewish National Party 31,941
0.68
4
New
Polish Nation
Polish People's Party 165,980
3.60
16
Polish Conservative Party
131,540
2.85
15
Polish Centre Party
108,247
2.34
14
New
Polish National Democratic Party 104,544
2.26
14
Polish Social Democratic Party 65,057
1.41
6
New
Polish Democratic Party
45,942
1.00
11
Polish Christian Social Party
11,210
0.24
1
Independent Socialists
8,022
0.17
1
New
Polish Agrarian Party
4,971
0.11
0
Polish National Party
3,675
0.08
0
Polish Progressive Democratic Party
1,684
0.04
1
Romanian Nation
Romanian National (Defense) Party 31,674
0.68
3
Romanian National (Democratic) Party 15,195
0.33
1
New
Romanian Independents
4,655
0.10
1
New
Romanian Social Democratic Party
823
0.02
0
New
Ruthenian Nation
Ukrainian National Democratic Party –Young Ruthenian Party 304,410
6.59
20
Russian National Party 162,663
3.52
5
Ukrainian Radical Party 105,118
2.28
5
Ukrainian Social Democratic Party 27,978
0.61
2
New
Serbian Nation
Serb People's Party 7,808
0.17
2
Serbian Independents
3,975
0.09
0
New
Slovenian Nation
Slovene Clerical Party
48,431
1.05
8
Slovene People's Party 48,175
1.04
10
New
Slovene Liberal Party
23,292
0.74
4
Slovenian National Party
16,830
0.36
2
Slovene Social Democratic Party 13,189
0.29
0
New
Slovenian National-Progressive Party 10,921
0.24
0
New
Slovenian Pro-German Party
6,001
0.13
0
Slovenian Agrarian Party
1,309
0.03
0
Slovenian Independents
873
0.02
0
New
Unknown or split
Unknown or split votes
39,416
0.85
–
–
Invalid/blank votes
58,990
–
Total 4,676,350 100 516 91
Registered voters/turnout
5,526,203
84.62
-
Source: ANNO
By parliamentary grouping [ ]
Grouping
Seats
+/-
Christian Social Union[disambiguation needed
96
Poland Club
55
German National Association 51
New
Club of German Social Democrats
50
Group of the German Agrarian Parties
33
Club of Bohemian Agrarians
30
Bohemian Club
25
Ruthenian Club
25
Club of Bohemian Social Democrats
24
New
Association of Yugoslavians 20
Catholic-National Party
17
New
Slovenian Club
17
New
Polish People’s Party
16
German Progressive Union
15
German Radical Group
13
New
Bohemian National Social Club
11
New
Italian People’s Party
10
New
Club of Polish Social Democrats
6
New
Group of Italian Social Democrats
5
New
Romanian Club
5
Club of Liberal Italians
4
New
Jewish Club
4
New
Pan-German Group
3
Representation of Ruthenian-Ukrainian Social Democrats
2
New
Independents
12
Total 516 91
Source: ANNO
See also [ ] List of political parties in Austria
References [ ]