1945 Northern Ireland general election
| ||||||||||||||||||||||||||||||||||||||||||||||||||||||||||||||||||||||||||||||||||
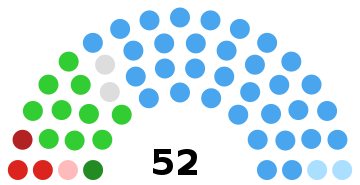
All 52 seats to the House of Commons of Northern Ireland 27 seats were needed for a majority | ||||||||||||||||||||||||||||||||||||||||||||||||||||||||||||||||||||||||||||||||||
|---|---|---|---|---|---|---|---|---|---|---|---|---|---|---|---|---|---|---|---|---|---|---|---|---|---|---|---|---|---|---|---|---|---|---|---|---|---|---|---|---|---|---|---|---|---|---|---|---|---|---|---|---|---|---|---|---|---|---|---|---|---|---|---|---|---|---|---|---|---|---|---|---|---|---|---|---|---|---|---|---|---|---|
| ||||||||||||||||||||||||||||||||||||||||||||||||||||||||||||||||||||||||||||||||||
 Percentage of seats gained by each of the party | ||||||||||||||||||||||||||||||||||||||||||||||||||||||||||||||||||||||||||||||||||
| ||||||||||||||||||||||||||||||||||||||||||||||||||||||||||||||||||||||||||||||||||

| (1921–72) |
 |
|---|
|
The 1945 Northern Ireland general election was held on 14 June 1945. The election saw significant losses for the Ulster Unionist Party, though they retained their majority.
Mirroring the result across the rest of the UK in the 1945 UK general election, candidates standing on behalf of the various Labour parties won a significantly higher vote share of 30%,[nb 1] but this translated into just two new MPs due to the first-past-the-post electoral system.
Results[]
| 33 | 10 | 2 | 2 | 5 |
| UUP | Nationalist | L | IU | Oth |
| 1945 Northern Ireland general election | |||||||||||||||
|---|---|---|---|---|---|---|---|---|---|---|---|---|---|---|---|
 | |||||||||||||||
| Party | Candidates | Votes | |||||||||||||
| Stood | Elected | Gained | Unseated | Net | % of total | % | No. | Net % | |||||||
| UUP | 41 | 33 | 0 | 6 | -6 | 63.5 | 50.4 | 180,342 | -6.4 | ||||||
| NI Labour | 15 | 2 | 2 | 1 | +1 | 3.8 | 18.5 | 66,053 | +12.8 | ||||||
| Nationalist | 11 | 10 | 2 | 0 | +2 | 19.2 | 9.1 | 32,546 | +4.2 | ||||||
| Commonwealth Labour | 6 | 1 | 1 | 0 | +1 | 1.9 | 7.8 | 28,079 | N/A | ||||||
| Independent Unionist | 5 | 2 | 1 | 1 | 0 | 3.8 | 5.0 | 17,906 | -1.8 | ||||||
| Communist (NI) | 3 | 0 | 0 | 0 | 0 | 3.5 | 12,456 | N/A | |||||||
| Independent Labour | 2 | 1 | 0 | 0 | 0 | 1.9 | 2.8 | 9,872 | +1.1 | ||||||
| Socialist Republican | 2 | 1 | 1 | 0 | +1 | 1.9 | 1.5 | 5,497 | N/A | ||||||
| Federation of Labour | 1 | 0 | 0 | 0 | 0 | 1.1 | 3,912 | N/A | |||||||
| Independent | 2 | 2 | 2 | 0 | +2 | 3.8 | 0.3 | 1,219 | -1.9 | ||||||
Electorate: 845,964 (509,098 in contested seats); Turnout: 70.3% (357,882).
Votes summary[]
Seats summary[]
Footnotes[]
- ^ 19% for the Northern Irish Labour Party, 8% for the Commonwealth Labour Party, 3% for Independent Labour candidates and 1% for the Federation of Labour
See also[]
References[]
- Northern Ireland Parliamentary Election Results Archived 16 November 2017 at the Wayback Machine
Categories:
- General elections to the Parliament of Northern Ireland
- 1945 elections in the United Kingdom
- June 1945 events
- 1945 elections in Northern Ireland