1950 Tasmanian state election
First party
Second party
Leader
Robert Cosgrove
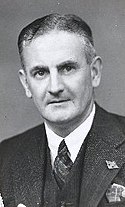
Rex Townley
Party
Labor
Liberal
Leader since
25 February 1948
6 February 1950
Leader's seat
Denison
Denison
Last election
15 seats
12 seats
Seats won
15 seats
14 seats
Seat change
Percentage
48.63%
47.57%
Swing
The 1950 Tasmanian state election was held on 6 May 1950 in the Australian state of Tasmania to elect 30 members of the Tasmanian House of Assembly . The election used the Hare-Clark proportional representation system[1]
Following the 1948 election , Premier Robert Cosgrove and the Labor Party remained in government with the support of independent MHA Bill Wedd . At the 1950 election, Cosgrove was seeking another term in office against the opposition Liberal Party , which had replaced Neil Campbell with Rex Townley as leader in February 1950.
At the election, Labor retained 15 seats in the House of Assembly, and the Liberals regained one seat previously held by an independent, whilst Rex Townley , formerly an Independent Liberal, retained his seat as a Liberal.
Results [ ]
Tasmanian state election, 6 May 1950House of Assembly << 1948 –1955 >>
Enrolled voters
161,650
Votes cast
152,785
Turnout
94.52
+2.28
Informal votes
6,841
Informal
4.48
+0.53
Summary of votes by party
Party
Primary votes
%
Swing
Seats
Change
Labor 70,976
48.63
–0.75
15
± 0
Liberal [1] 69,429
47.57
+9.73
14
+ 2
Independent
5,453
3.74
–2.10
1
– 1
Communist
86
0.06
+0.06
0
± 0
Ind. Lib.[1]
–6.82
0
– 1
Total
145,944
30
Popular vote
Labor
48.63%
Liberal
47.57%
Independents
3.74%
Communist
0.06%
Seats
Labor
50.00%
Liberal
46.67%
Independents
3.33%
1 Rex Townley joined the Liberal Party before the election, and had a personal vote of 3.88% in 1948 (19.97% of the Denison vote), so the actual net difference in votes between 1948 and 1950 was 5.85%.Distribution of votes [ ] Primary vote by division [ ]
Bass
Darwin
Denison
Franklin
Wilmot
Labor Party 54.2%
52.4%
46.2%
44.5%
51.2%
Liberal Party 45.8%
46.8%
44.1%
46.8%
48.8%
Other
—
0.9%
9.6%
8.7%
—
Distribution of seats [ ]
Labor
Liberal
Independent
See also [ ] References [ ] External links [ ]