1963 Dutch general election Turnout 95.1% (pp )
This lists parties that won seats. See the complete results
below .
Seats
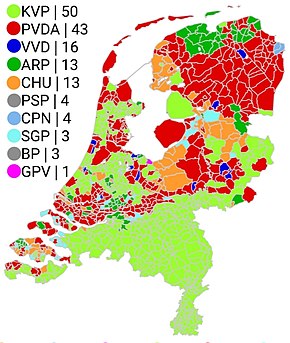
General elections were held in the Netherlands on 15 May 1963.[1] Catholic People's Party (KVP) remained the largest party, winning 50 of the 150 seats in the House of Representatives .[2]
The elections led to a four-party coalition government initially consisting of the KVP, People's Party for Freedom and Democracy , Anti-Revolutionary Party (ARP) and Christian Historical Union . In 1965 this coalition was replaced by one consisting of the KVP, Labour Party and ARP.
Results [ ] Party Votes % Seats +/– Catholic People's Party 1,995,348 31.88 50 +1 Labour Party 1,753,025 28.01 43 –5 People's Party for Freedom and Democracy 643,820 10.29 16 –3 Anti-Revolutionary Party 545,718 8.72 13 –1 Christian Historical Union 536,782 8.58 13 +1 Pacifist Socialist Party 189,370 3.03 4 +2 Communist Party of the Netherlands 173,322 2.77 4 +1 Reformed Political Party 143,549 2.29 3 0 Farmers' Party 133,210 2.13 3 +3 Reformed Political League 46,324 0.74 1 +1 Economic Appeal Party 37,554 0.60 0 New Liberal State Party 22,353 0.36 0 New Liberal Union –Safe Traffic and 100,100 Houses Each Year21,048 0.34 0 New New Democratic Party 13,064 0.21 0 New Christian National People's Party 1,823 0.03 0 New Grol List 876 0.01 0 New People's Referendum 819 0.01 0 New Total 6,258,005 100.00 150 0 Valid votes 6,258,005 97.49 Invalid/blank votes 161,441 2.51 Total votes 6,419,446 100.00 Registered voters/turnout 6,746,362 95.15 Source: Kiesraad
Popular Vote
KVP
31.88%
PvdA
28.01%
VVD
10.29%
ARP
8.72%
CHU
8.58%
PSP
3.03%
CPN
2.77%
SGP
2.30%
BP
2.13%
GPV
0.74%
Other
1.56%
References [ ]
^ Dieter Nohlen & Philip Stöver (2010) Elections in Europe: A data handbook , p1396 ISBN 978-3-8329-5609-7 ^ Nohlen & Stöver, p1413