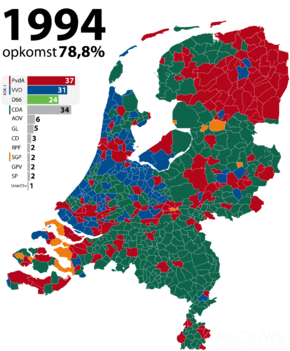
1994 Dutch general election House of Representatives Turnout 78.8% (pp )
This lists parties that won seats. See the complete results
below .
General elections were held in the Netherlands on 3 May 1994.[1] Labour Party emerged as the largest party, winning 37 of the 150 seats in the House of Representatives .[2] Christian Democratic Appeal . The two liberal parties, People's Party for Freedom and Democracy and Democrats 66 made large gains, whilst two pro-elderly parties and the Socialist Party all passed the electoral threshold to win seats.
The formation of a government coalition was arduous but after four months the First Kok cabinet was formed.
It was an unprecedented coalition of the two liberal parties and Labour. The CDA was consigned to opposition for the first time in its history. It was also the first government since 1918 not to include a Christian Democratic party.
Results [ ] Party Votes % Seats +/– Labour Party 2,153,135 23.97 37 –12 Christian Democratic Appeal 1,996,418 22.23 34 –20 People's Party for Freedom and Democracy 1,792,401 19.96 31 +9 Democrats 66 1,391,202 15.49 24 +12 General Elderly Alliance 326,401 3.63 6 New GroenLinks 311,399 3.47 5 –1 Centre Democrats 220,734 2.46 3 +2 Reformatory Political Federation 158,705 1.77 3 +2 Reformed Political Party 155,251 1.73 2 –1 Reformed Political League 119,158 1.33 2 0 Socialist Party 118,768 1.32 2 +2 Union 55+ 78,147 0.87 1 New Centre Party '86 32,327 0.36 0 New Natural Law Party 27,665 0.31 0 New Free Indian Party 17,230 0.19 0 New The Greens 13,902 0.15 0 0 New Communist Party of the Netherlands 11,630 0.13 0 New Solidarity Farmers' Party 9,096 0.10 0 New Party for Environment and Justice 8,716 0.10 0 New Solidarity '93 7,919 0.09 0 New Pacifist Socialist Party '92 7,385 0.08 0 New The New Party 6,825 0.08 0 New General Democratic Party 5,196 0.06 0 New Patriotic Democratic Appeal 4,845 0.05 0 New Socialist Alternative Politics 4,347 0.05 0 0 Libertarian Party 2,754 0.03 0 New Total 8,981,556 100.00 150 0 Valid votes 8,981,556 99.49 Invalid/blank votes 46,331 0.51 Total votes 9,027,887 100.00 Registered voters/turnout 11,455,924 78.81 Source: Nohlen & Stöver, European Elections Database
By province [ ]
Results by province[3]
Province
PvdA
CDA
VVD
D66
AOV
GL
CD
RPF
SGP
GPV
SP
U55+
Others
Drenthe
34.5
19.8
18.2
13.9
2.5
1.2
1.7
0.4
2.4
1.0
1.0
0.6
2.2
Flevoland
20.1
17.6
23.6
17.0
4.2
3.1
2.4
2.8
2.4
2.1
1.3
1.0
2.4
Friesland
31.6
27.5
14.2
12.5
2.2
3.0
1.1
2.6
0.6
2.2
0.6
0.4
1.9
Gelderland
23.8
24.7
18.3
15.3
2.8
3.3
1.8
2.7
3.2
1.1
1.0
0.6
1.7
Groningen
34.8
17.3
14.2
14.1
2.8
4.5
1.3
1.8
0.2
4.5
1.7
0.6
1.3
Limburg
24.5
28.9
14.8
14.5
5.4
3.2
3.0
0.2
0.1
0.4
2.2
1.0
1.4
North Brabant
21.0
27.1
18.1
16.3
5.7
2.8
2.8
0.5
0.5
0.4
2.2
1.0
2.8
North Holland
24.9
16.2
24.5
17.2
4.1
4.9
2.3
0.9
0.3
0.6
0.9
1.0
1.6
Overijssel
24.2
29.6
15.4
12.9
2.1
2.5
1.5
3.2
2.1
2.9
0.8
1.2
1.6
South Holland
22.2
18.3
23.4
15.8
3.2
3.1
3.5
2.1
3.0
1.2
1.5
0.8
1.8
Utrecht
19.1
20.6
23.2
16.9
2.9
4.7
2.4
2.5
2.3
2.0
0.9
0.8
1.5
Zeeland
22.4
20.9
18.8
13.5
3.7
2.4
2.8
3.0
7.9
1.8
0.6
0.9
2.2
References [ ]
^ Dieter Nohlen & Philip Stöver (2010) Elections in Europe: A data handbook , p1396 ISBN 978-3-8329-5609-7 ^ Nohlen & Stöver, p1414
^ "Tweede Kamer 3 mei 1994" . Kiesraad (in Dutch). Retrieved 4 November 2021 .
Further reading [ ] Irwin, Galen A. "The Dutch Parliamentary Election of 1994," Electoral Studies (1995) 14#1 pp. 72–77