1980 United States presidential election in New York
| |||||||||||||||||||||||||||||||||||||
| |||||||||||||||||||||||||||||||||||||
 County Results
| |||||||||||||||||||||||||||||||||||||
| |||||||||||||||||||||||||||||||||||||


| Elections in New York State |
|---|
 |
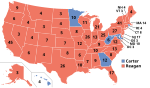
The 1980 United States presidential election in New York took place on November 4, 1980. All 50 states and The District of Columbia, were part of the 1980 United States presidential election. Voters chose 41 electors to the Electoral College, which voted for President and Vice President.
New York was won by former California Governor Ronald Reagan, in a narrow victory against President of the United States Jimmy Carter, who failed to gain reelection against Reagan.[1] Also in the running was Independent candidate Congressman John B. Anderson of Illinois, who ran in New York as the Liberal Party candidate.
Reagan won the state with a plurality of 46.66% of the vote to Carter's 43.99%, a margin of 2.67%. Anderson finished in third, with 7.54%.
New York's election results reflect the Republican Party's re-consolidation of base under what is popularly called the "Reagan Revolution,"[2] which sounded various overwhelming conservative electoral victories across the United States throughout the 1980s – and most evidently against the relatively unpopular President Carter during the 1980 presidential election.
New York weighed in for this election as more Democratic than the national average by about 7%.
This election is notable in that, while the highly populated regions of New York City, Buffalo, and Albany turned out for Carter, the election in the state was tipped by the majority of less-populated upstate counties, combined with heavily populated suburban counties around NYC, most of which were won by Reagan. Carter actually picked up plurality wins in two counties which he had lost in 1976: Monroe County, home to the city of Rochester, and Niagara County.
A major contributing factor to Reagan's victory over Carter was the relatively strong third party showing by independent candidate John B. Anderson, a former liberal Republican congressman who garnered 7.54% of the vote in the State – nearly twice the 4% margin by which Carter had won New York in 1976. Running on the ballot line of New York's Liberal Party, Anderson attracted the votes of many liberals and moderates who normally leaned Democratic but were dissatisfied with the policies of the Carter Administration and with Rockefeller Republicans who viewed Reagan as too far to the right, thus splitting the left-leaning vote in New York State.
In the heavily populated, and very liberal, five boroughs of New York City, Carter still won overall, and Reagan made only modest gains in vote share over Gerald Ford's 1976 showing of 33 percent, taking 37% in the city in 1980. However, although still winning 4 out of 5 boroughs, Carter bled a considerable support in the city to Anderson, dropping from 66% in 1976 to only 55%. Since Democratic victories in New York State in that era depended on running up massive margins in New York City to overcome the rest of the state's Republican lean, the reduced margin in the city from vote-splitting would prove fatal to Carter's chances in 1980. While Reagan only bled about one percent off Republican base support in the state (winning a plurality in a 3-way-race with 46.66% while Gerald Ford had lost the state in a two-man race with 47.52% in 1976), Carter bled nearly 8% off his 1976 support, falling from a 51.95% majority win in 1976 to a losing 43.99% in 1980, most of those lost Democratic base votes going to Anderson instead.
This remains the last election in which a Republican presidential nominee has won traditionally rock-ribbed GOP Tompkins County in upstate New York, home to the college town of Ithaca, where Cornell University and Ithaca College are located.[3] At this point, Tompkins County had gone Democratic since the Civil War only in the landslides of 1912 and 1964,[4] with FDR never topping 40%. Reagan narrowly won the county with a plurality of 42% to Carter's 40%, while Anderson took nearly 14%, making it Anderson's strongest county in the state. 4 years later in 1984, Tompkins County would vote against Reagan and in the following years it would become the most Democratic county in upstate New York, giving Barack Obama over 70% of the vote in 2008.
Results[]
Primary Results[]
| Candidate | Votes | Delegates |
|---|---|---|
| Ted Kennedy | 582,757 | 176 |
| Jimmy Carter (Incumbent) | 406,305 | 123 |
| Totals | 989,062 | 299 |
| Candidate | Delegates |
|---|---|
| Ronald Reagan | 73 |
| George H.W. Bush | 6 |
| John Anderson | 1 |
| Uncommitted | 47 |
| Totals | 127 |
- Note: The Republican Primary was not decided by votes for each candidate, but for their delegate slates in each and every congressional district.
| 1980 United States presidential election in New York | |||||
|---|---|---|---|---|---|
| Party | Candidate | Votes | Percentage | Electoral votes | |
| Republican | Ronald Reagan | 2,637,700 | 42.53% | ||
| Conservative | Ronald Reagan | 256,131 | 4.13% | ||
| Total | Ronald Reagan | 2,893,831 | 46.66% | 41 | |
| Democratic | Jimmy Carter (Incumbent) | 2,728,372 | 43.99% | 0 | |
| Liberal | John B. Anderson | 467,801 | 7.54% | 0 | |
| Free Libertarian | Ed Clark | 52,648 | 0.85% | 0 | |
| Right to Life | Ellen McCormack | 24,159 | 0.39% | 0 | |
| Citizens Party | Barry Commoner | 23,186 | 0.37% | 0 | |
| Communist | Gus Hall | 7,414 | 0.12% | 0 | |
| Socialist Workers | Clifton DeBerry | 2,068 | 0.03% | 0 | |
| Workers’ World | Deirdre Griswold | 1,416 | 0.02% | 0 | |
| Write-ins | — | 1,064 | 0.02% | 0 | |
| Totals | 6,201,959 | 100.0% | 41 | ||
Results by county[]
| County | Ronald Wilson Reagan Republican |
James Earl Carter Democratic |
John Bayard Anderson Liberal |
Edward E. Clark[5] Free Libertarian |
Ellen McCormack[5] Right to Life |
Barry Commoner[5] Citizens |
Various candidates[5] Other parties |
Margin | Total votes cast | ||||||||
|---|---|---|---|---|---|---|---|---|---|---|---|---|---|---|---|---|---|
| # | % | # | % | # | % | # | % | # | % | # | % | # | % | # | % | ||
| Albany | 52,354 | 36.27% | 74,429 | 51.56% | 14,563 | 10.09% | 1,723 | 1.19% | 642 | 0.44% | 502 | 0.35% | 151 | 0.10% | -22,075 | -15.29% | 144,364 |
| Allegany | 10,423 | 59.09% | 5,879 | 33.33% | 973 | 5.52% | 275 | 1.56% | 44 | 0.25% | 25 | 0.14% | 21 | 0.12% | 4,544 | 25.76% | 17,640 |
| Bronx | 86,843 | 30.70% | 181,090 | 64.02% | 11,286 | 3.99% | 991 | 0.35% | 995 | 0.35% | 685 | 0.24% | 957 | 0.34% | -94,247 | -33.32% | 282,847 |
| Broome | 39,275 | 43.99% | 37,013 | 41.46% | 11,388 | 12.76% | 969 | 1.09% | 323 | 0.36% | 206 | 0.23% | 106 | 0.12% | 2,262 | 2.53% | 89,280 |
| Cattaraugus | 17,222 | 52.65% | 12,917 | 39.49% | 1,848 | 5.65% | 477 | 1.46% | 149 | 0.46% | 42 | 0.13% | 54 | 0.17% | 4,305 | 13.16% | 32,709 |
| Cayuga | 17,945 | 54.78% | 11,708 | 35.74% | 2,539 | 7.75% | 360 | 1.10% | 111 | 0.34% | 47 | 0.14% | 46 | 0.14% | 6,237 | 19.04% | 32,756 |
| Chautauqua | 30,081 | 51.20% | 22,871 | 38.93% | 4,699 | 8.00% | 815 | 1.39% | 142 | 0.24% | 72 | 0.12% | 76 | 0.13% | 7,210 | 12.27% | 58,756 |
| Chemung | 19,674 | 52.87% | 14,565 | 39.14% | 2,465 | 6.62% | 327 | 0.88% | 121 | 0.33% | 38 | 0.10% | 19 | 0.05% | 5,109 | 13.73% | 37,209 |
| Chenango | 10,400 | 53.08% | 6,917 | 35.31% | 1,908 | 9.74% | 261 | 1.33% | 57 | 0.29% | 37 | 0.19% | 12 | 0.06% | 3,483 | 17.78% | 19,592 |
| Clinton | 13,120 | 48.79% | 11,498 | 42.76% | 1,904 | 7.08% | 193 | 0.72% | 95 | 0.35% | 60 | 0.22% | 20 | 0.07% | 1,622 | 6.03% | 26,890 |
| Columbia | 13,946 | 53.08% | 9,500 | 36.16% | 2,204 | 8.39% | 378 | 1.44% | 125 | 0.48% | 86 | 0.33% | 35 | 0.13% | 4,446 | 16.92% | 26,274 |
| Cortland | 9,885 | 54.77% | 6,176 | 34.22% | 1,603 | 8.88% | 249 | 1.38% | 49 | 0.27% | 55 | 0.30% | 31 | 0.17% | 3,709 | 20.55% | 18,048 |
| Delaware | 10,609 | 55.36% | 6,333 | 33.05% | 1,865 | 9.73% | 252 | 1.31% | 35 | 0.18% | 52 | 0.27% | 18 | 0.09% | 4,276 | 22.31% | 19,164 |
| Dutchess | 53,616 | 57.65% | 28,616 | 30.77% | 8,824 | 9.49% | 1,129 | 1.21% | 388 | 0.42% | 275 | 0.30% | 159 | 0.17% | 25,000 | 26.88% | 93,007 |
| Erie | 169,209 | 40.24% | 215,283 | 51.20% | 29,580 | 7.03% | 3,853 | 0.92% | 1,381 | 0.33% | 767 | 0.18% | 400 | 0.10% | -46,074 | -10.96% | 420,473 |
| Essex | 9,025 | 53.16% | 6,443 | 37.95% | 1,213 | 7.14% | 204 | 1.20% | 45 | 0.27% | 31 | 0.18% | 17 | 0.10% | 2,582 | 15.21% | 16,978 |
| Franklin | 7,620 | 46.77% | 7,281 | 44.69% | 1,182 | 7.26% | 88 | 0.54% | 80 | 0.49% | 30 | 0.18% | 11 | 0.07% | 339 | 2.08% | 16,292 |
| Fulton | 11,448 | 53.19% | 8,105 | 37.66% | 1,566 | 7.28% | 280 | 1.30% | 72 | 0.33% | 30 | 0.14% | 21 | 0.10% | 3,343 | 15.53% | 21,522 |
| Genesee | 11,650 | 47.57% | 10,677 | 43.60% | 1,651 | 6.74% | 346 | 1.41% | 97 | 0.40% | 29 | 0.12% | 39 | 0.16% | 973 | 3.97% | 24,489 |
| Greene | 11,286 | 57.88% | 6,488 | 33.28% | 1,338 | 6.86% | 220 | 1.13% | 115 | 0.59% | 29 | 0.15% | 22 | 0.11% | 4,798 | 24.61% | 19,498 |
| Hamilton | 2,038 | 63.10% | 925 | 28.64% | 176 | 5.45% | 52 | 1.61% | 16 | 0.50% | 20 | 0.62% | 3 | 0.09% | 1,113 | 34.46% | 3,230 |
| Herkimer | 14,105 | 50.58% | 11,497 | 41.23% | 1,830 | 6.56% | 321 | 1.15% | 73 | 0.26% | 40 | 0.14% | 22 | 0.08% | 2,608 | 9.35% | 27,888 |
| Jefferson | 16,455 | 49.67% | 13,271 | 40.06% | 2,834 | 8.55% | 387 | 1.17% | 85 | 0.26% | 71 | 0.21% | 25 | 0.08% | 3,184 | 9.61% | 33,128 |
| Kings | 200,306 | 38.43% | 288,893 | 55.44% | 24,341 | 4.67% | 2,039 | 0.39% | 1,615 | 0.31% | 2,266 | 0.43% | 1,649 | 0.32% | -88,587 | -17.00% | 521,109 |
| Lewis | 4,937 | 50.26% | 3,973 | 40.45% | 716 | 7.29% | 150 | 1.53% | 32 | 0.33% | 4 | 0.04% | 10 | 0.10% | 964 | 9.81% | 9,822 |
| Livingston | 11,193 | 49.85% | 9,030 | 40.22% | 1,694 | 7.54% | 400 | 1.78% | 63 | 0.28% | 47 | 0.21% | 27 | 0.12% | 2,163 | 9.63% | 22,454 |
| Madison | 13,369 | 55.85% | 7,843 | 32.77% | 2,122 | 8.86% | 444 | 1.85% | 77 | 0.32% | 53 | 0.22% | 29 | 0.12% | 5,526 | 23.09% | 23,937 |
| Monroe | 128,615 | 41.93% | 142,423 | 46.43% | 29,118 | 9.49% | 4,335 | 1.41% | 980 | 0.32% | 846 | 0.28% | 416 | 0.14% | -13,808 | -4.50% | 306,733 |
| Montgomery | 11,917 | 49.48% | 9,645 | 40.04% | 2,080 | 8.64% | 309 | 1.28% | 72 | 0.30% | 38 | 0.16% | 27 | 0.11% | 2,272 | 9.43% | 24,088 |
| Nassau | 333,567 | 55.95% | 207,602 | 34.81% | 44,758 | 7.51% | 3,463 | 0.58% | 3,795 | 0.64% | 2,257 | 0.38% | 712 | 0.12% | 125,965 | 21.13% | 596,154 |
| New York | 115,911 | 26.23% | 275,742 | 62.40% | 38,597 | 8.73% | 2,718 | 0.62% | 862 | 0.20% | 5,361 | 1.21% | 2,710 | 0.61% | -159,831 | -36.17% | 441,901 |
| Niagara | 38,760 | 44.86% | 40,405 | 46.77% | 6,014 | 6.96% | 816 | 0.94% | 285 | 0.33% | 72 | 0.08% | 56 | 0.06% | -1,645 | -1.90% | 86,409 |
| Oneida | 51,968 | 49.59% | 44,292 | 42.26% | 6,929 | 6.61% | 1,107 | 1.06% | 308 | 0.29% | 98 | 0.09% | 97 | 0.09% | 7,676 | 7.32% | 104,799 |
| Onondaga | 97,887 | 50.62% | 73,453 | 37.99% | 18,805 | 9.72% | 1,908 | 0.99% | 695 | 0.36% | 352 | 0.18% | 272 | 0.14% | 24,434 | 12.64% | 193,372 |
| Ontario | 17,036 | 47.98% | 14,477 | 40.77% | 3,147 | 8.86% | 606 | 1.71% | 133 | 0.37% | 66 | 0.19% | 41 | 0.12% | 2,559 | 7.21% | 35,506 |
| Orange | 51,268 | 56.67% | 30,022 | 33.18% | 7,656 | 8.46% | 948 | 1.05% | 302 | 0.33% | 151 | 0.17% | 123 | 0.14% | 21,246 | 23.48% | 90,470 |
| Orleans | 7,536 | 51.58% | 5,767 | 39.47% | 977 | 6.69% | 252 | 1.72% | 41 | 0.28% | 20 | 0.14% | 18 | 0.12% | 1,769 | 12.11% | 14,611 |
| Oswego | 22,816 | 53.63% | 15,343 | 36.07% | 3,333 | 7.83% | 810 | 1.90% | 118 | 0.28% | 65 | 0.15% | 56 | 0.13% | 7,473 | 17.57% | 42,541 |
| Otsego | 11,814 | 49.42% | 8,795 | 36.79% | 2,874 | 12.02% | 299 | 1.25% | 47 | 0.20% | 51 | 0.21% | 27 | 0.11% | 3,019 | 12.63% | 23,907 |
| Putnam | 20,193 | 63.46% | 8,691 | 27.31% | 2,340 | 7.35% | 294 | 0.92% | 146 | 0.46% | 112 | 0.35% | 43 | 0.14% | 11,502 | 36.15% | 31,819 |
| Queens | 251,333 | 44.81% | 269,147 | 47.98% | 32,566 | 5.81% | 2,482 | 0.44% | 2,227 | 0.40% | 1,889 | 0.34% | 1,279 | 0.23% | -17,814 | -3.18% | 560,923 |
| Rensselaer | 32,005 | 45.89% | 29,880 | 42.84% | 6,443 | 9.24% | 955 | 1.37% | 270 | 0.39% | 130 | 0.19% | 64 | 0.09% | 2,125 | 3.05% | 69,747 |
| Richmond | 64,885 | 58.64% | 37,306 | 33.72% | 7,055 | 6.38% | 561 | 0.51% | 518 | 0.47% | 225 | 0.20% | 101 | 0.09% | 27,579 | 24.93% | 110,651 |
| Rockland | 59,068 | 56.26% | 35,277 | 33.60% | 8,709 | 8.29% | 879 | 0.84% | 484 | 0.46% | 427 | 0.41% | 151 | 0.14% | 23,791 | 22.66% | 104,993 |
| Saratoga | 34,184 | 52.30% | 23,641 | 36.17% | 6,201 | 9.49% | 957 | 1.46% | 194 | 0.30% | 128 | 0.20% | 57 | 0.09% | 10,543 | 16.13% | 65,362 |
| Schenectady | 32,003 | 45.37% | 29,932 | 42.44% | 7,146 | 10.13% | 947 | 1.34% | 206 | 0.29% | 202 | 0.29% | 98 | 0.14% | 2,071 | 2.94% | 70,534 |
| Schoharie | 6,382 | 52.05% | 4,715 | 38.45% | 940 | 7.67% | 165 | 1.35% | 30 | 0.24% | 17 | 0.14% | 13 | 0.11% | 1,667 | 13.59% | 12,262 |
| Schuyler | 3,838 | 55.17% | 2,514 | 36.14% | 476 | 6.84% | 79 | 1.14% | 14 | 0.20% | 26 | 0.37% | 10 | 0.14% | 1,324 | 19.03% | 6,957 |
| Seneca | 7,174 | 52.40% | 5,010 | 36.60% | 1,205 | 8.80% | 199 | 1.45% | 53 | 0.39% | 34 | 0.25% | 15 | 0.11% | 2,164 | 15.81% | 13,690 |
| St. Lawrence | 18,437 | 46.53% | 17,006 | 42.92% | 3,544 | 8.94% | 319 | 0.81% | 164 | 0.41% | 115 | 0.29% | 39 | 0.10% | 1,431 | 3.61% | 39,624 |
| Steuben | 22,418 | 58.73% | 12,826 | 33.60% | 2,257 | 5.91% | 467 | 1.22% | 121 | 0.32% | 54 | 0.14% | 27 | 0.07% | 9,592 | 25.13% | 38,170 |
| Suffolk | 256,294 | 57.00% | 149,945 | 33.35% | 34,743 | 7.73% | 3,598 | 0.80% | 2,827 | 0.63% | 1,676 | 0.37% | 573 | 0.13% | 106,349 | 23.65% | 449,655 |
| Sullivan | 15,089 | 55.44% | 9,553 | 35.10% | 2,095 | 7.70% | 297 | 1.09% | 104 | 0.38% | 19 | 0.07% | 61 | 0.22% | 5,536 | 20.34% | 27,218 |
| Tioga | 10,291 | 53.56% | 6,690 | 34.82% | 1,851 | 9.63% | 261 | 1.36% | 52 | 0.27% | 33 | 0.17% | 36 | 0.19% | 3,601 | 18.74% | 19,214 |
| Tompkins | 12,448 | 41.96% | 11,970 | 40.35% | 4,081 | 13.76% | 305 | 1.03% | 49 | 0.17% | 764 | 2.58% | 51 | 0.17% | 478 | 1.61% | 29,668 |
| Ulster | 36,709 | 55.01% | 22,179 | 33.24% | 5,995 | 8.98% | 868 | 1.30% | 184 | 0.28% | 640 | 0.96% | 151 | 0.23% | 14,530 | 21.78% | 66,726 |
| Warren | 13,264 | 59.28% | 6,971 | 31.15% | 1,766 | 7.89% | 266 | 1.19% | 59 | 0.26% | 35 | 0.16% | 16 | 0.07% | 6,293 | 28.12% | 22,377 |
| Washington | 12,835 | 58.59% | 7,144 | 32.61% | 1,501 | 6.85% | 337 | 1.54% | 48 | 0.22% | 29 | 0.13% | 12 | 0.05% | 5,691 | 25.98% | 21,906 |
| Wayne | 16,498 | 50.74% | 12,590 | 38.72% | 2,623 | 8.07% | 628 | 1.93% | 85 | 0.26% | 55 | 0.17% | 33 | 0.10% | 3,908 | 12.02% | 32,512 |
| Westchester | 198,552 | 54.37% | 130,136 | 35.64% | 30,119 | 8.25% | 2,639 | 0.72% | 1,587 | 0.43% | 1,555 | 0.43% | 578 | 0.16% | 68,416 | 18.74% | 365,166 |
| Wyoming | 8,108 | 55.72% | 5,234 | 35.97% | 855 | 5.88% | 266 | 1.83% | 58 | 0.40% | 17 | 0.12% | 14 | 0.10% | 2,874 | 19.75% | 14,552 |
| Yates | 4,694 | 55.99% | 2,828 | 33.73% | 690 | 8.23% | 125 | 1.49% | 14 | 0.17% | 28 | 0.33% | 5 | 0.06% | 1,866 | 22.26% | 8,384 |
| Totals | 2,893,831 | 46.66% | 2,728,372 | 43.99% | 467,801 | 7.54% | 52,648 | 0.85% | 24,159 | 0.39% | 23,186 | 0.37% | 11,962 | 0.19% | 165,459 | 2.67% | 6,201,959 |
References[]
- ^ "1980 Presidential General Election Results – New York". Dave Leip's Atlas of U.S. Presidential Elections. Retrieved 2013-04-27.
- ^ Jerry Lanson (2008-11-06). "A historic victory. A changed nation. Now, can Obama deliver?". Christian Science Monitor. Retrieved 2013-04-27.
- ^ Sullivan, Robert David; ‘How the Red and Blue Map Evolved Over the Past Century’; America Magazine in The National Catholic Review; June 29, 2016
- ^ Menendez, Albert J.; The Geography of Presidential Elections in the United States, 1868-2004, pp. 261-265 ISBN 0786422173
- ^ a b c d "NY US President Race, November 04, 1980". Our Campaigns.
State and district results of the 1980 United States presidential election | ||
|---|---|---|
|  | |
- 1980 United States presidential election by state
- United States presidential elections in New York (state)
- 1980 New York (state) elections