1988 United States presidential election in Colorado
| ||||||||||||||||||||||||||
| ||||||||||||||||||||||||||
 County Results
| ||||||||||||||||||||||||||
| ||||||||||||||||||||||||||


| Elections in Colorado |
|---|
 |
The 1988 United States presidential election in Colorado took place on November 8, 1988, as part of the 1988 United States presidential election, which was held throughout all 50 states and D.C. Voters chose eight representatives, or electors to the Electoral College, who voted for president and vice president.
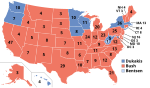
Colorado voted for the Republican nominee, Vice President George H. W. Bush, over the Democratic nominee, Massachusetts Governor Michael Dukakis, by a margin of 7.78%. Bush took 53.06% of the vote to Dukakis' 45.28%. This result made Colorado more Republican than the nation-at-large by a razor-thin margin of only 0.02%.
While the Republicans held onto Colorado's eight electoral votes, Bush's 53–45 win over Dukakis represented a vastly diminished margin compared to 1984, when Ronald Reagan had won the state in a 63–35 landslide over Walter Mondale. Unlike in the several preceding elections, Colorado voted roughly in line with the nation overall, which Bush won by 7.72%. Dukakis made substantial inroads by improving on Mondale's vote share in the city of Denver by over 10% (getting the highest vote share of any nominee in the city since Lyndon Johnson in 1964), becoming the first Democrat since 1964 (and only the second since 1936) to carry Boulder County, and comfortably reclaiming Pitkin County, which had supported McGovern in 1972 but had gone on to vote Republican in the next three elections.
These inroads lay the groundwork for Clinton's carrying Colorado for the Democrats for the first time since 1964 in 1992. In 1996, with the receding of the Perot vote,[1] Colorado returned to being a relatively red state, narrowly supporting Bob Dole even as he lost badly nationally. Nevertheless, in contrast with 1972, 1976, 1980, and 1984, Colorado would never again, as of 2020, vote Republican in a presidential election by double digits. After 2004, as of 2020, it has not voted Republican at all.
As of the 2020 presidential election, this is the last election in which Summit County voted for a Republican presidential candidate.[2]
Bush became the first Republican to win the White House without carrying Boulder County since William Howard Taft in 1908.
Results[]
| 1988 United States presidential election in Colorado[3] | |||||
|---|---|---|---|---|---|
| Party | Candidate | Votes | Percentage | Electoral votes | |
| Republican | George H. W. Bush | 728,177 | 53.06% | 8 | |
| Democratic | Michael Dukakis | 621,453 | 45.28% | 0 | |
| CO Libertarian | Ron Paul | 15,482 | 1.13% | 0 | |
| CO Prohibition | Earl Dodge | 4,604 | 0.34% | 0 | |
| New Alliance | Lenora Fulani | 2,539 | 0.19% | 0 | |
| No party | David Duke (Write-in) | 139 | 0.01% | 0 | |
| Totals | 1,372,394 | 100.00% | 8 | ||
Results by county[]
| County | George Herbert Walker Bush[4] Republican |
Michael Stanley Dukakis[4] Democratic |
Ronald Ernest Paul[4] Libertarian |
Various candidates[4] Other parties |
Margin | |||||
|---|---|---|---|---|---|---|---|---|---|---|
| % | # | % | # | % | # | % | # | % | # | |
| Hinsdale | 72.48% | 295 | 27.27% | 111 | 0.25% | 1 | 0.00% | 0 | 45.21% | 184 |
| Douglas | 70.09% | 17,035 | 28.52% | 6,931 | 1.39% | 338 | 0.19% | 46 | 41.57% | 10,104 |
| El Paso | 70.22% | 96,965 | 28.96% | 39,995 | 0.81% | 1,125 | 0.27% | 373 | 41.26% | 56,970 |
| Custer | 69.72% | 753 | 28.70% | 310 | 1.57% | 17 | 0.37% | 4 | 41.02% | 443 |
| Teller | 68.61% | 3,760 | 30.22% | 1,656 | 1.17% | 64 | 0.36% | 20 | 38.39% | 2,104 |
| Rio Blanco | 68.56% | 1,821 | 30.23% | 803 | 1.20% | 32 | 0.23% | 6 | 38.33% | 1,018 |
| Dolores | 67.22% | 488 | 31.68% | 230 | 1.10% | 8 | 0.83% | 6 | 35.54% | 258 |
| Jackson | 65.91% | 584 | 33.18% | 294 | 0.90% | 8 | 0.56% | 5 | 32.73% | 290 |
| Baca | 65.59% | 1,670 | 33.42% | 851 | 0.98% | 25 | 0.39% | 10 | 32.17% | 819 |
| Cheyenne | 64.74% | 760 | 33.99% | 399 | 1.28% | 15 | 0.77% | 9 | 30.75% | 361 |
| Kit Carson | 64.81% | 2,262 | 34.27% | 1,196 | 0.92% | 32 | 0.57% | 20 | 30.54% | 1,066 |
| Montezuma | 64.56% | 4,208 | 34.26% | 2,233 | 1.18% | 77 | 0.43% | 28 | 30.30% | 1,975 |
| Ouray | 64.30% | 814 | 34.68% | 439 | 1.03% | 13 | 0.24% | 3 | 29.62% | 375 |
| Archuleta | 63.89% | 1,440 | 35.27% | 795 | 0.84% | 19 | 0.35% | 8 | 28.62% | 645 |
| Elbert | 63.30% | 2,805 | 35.34% | 1,566 | 1.35% | 60 | 0.36% | 16 | 27.96% | 1,239 |
| Washington | 63.41% | 1,707 | 35.59% | 958 | 1.00% | 27 | 0.59% | 16 | 27.82% | 749 |
| Rio Grande | 62.43% | 2,626 | 36.73% | 1,545 | 0.83% | 35 | 0.52% | 22 | 25.70% | 1,081 |
| Moffat | 61.71% | 2,757 | 36.57% | 1,634 | 1.72% | 77 | 1.14% | 51 | 25.13% | 1,123 |
| Kiowa | 61.55% | 645 | 37.98% | 398 | 0.48% | 5 | 0.48% | 5 | 23.57% | 247 |
| Montrose | 60.84% | 6,012 | 37.93% | 3,748 | 1.22% | 121 | 0.93% | 92 | 22.91% | 2,264 |
| Grand | 60.27% | 2,306 | 37.92% | 1,451 | 1.80% | 69 | 0.31% | 12 | 22.35% | 855 |
| Arapahoe | 60.49% | 95,926 | 38.53% | 61,113 | 0.98% | 1,553 | 0.41% | 648 | 21.95% | 34,813 |
| Lincoln | 60.45% | 1,356 | 38.97% | 874 | 0.58% | 13 | 0.27% | 6 | 21.49% | 482 |
| Delta | 60.01% | 5,449 | 38.78% | 3,521 | 1.21% | 110 | 0.61% | 55 | 21.23% | 1,928 |
| Mesa | 59.89% | 22,150 | 38.86% | 14,372 | 1.25% | 462 | 0.46% | 170 | 21.03% | 7,778 |
| Sedgwick | 59.77% | 921 | 39.65% | 611 | 0.58% | 9 | 0.26% | 4 | 20.12% | 310 |
| Fremont | 58.52% | 7,623 | 40.52% | 5,278 | 0.96% | 125 | 0.46% | 60 | 18.00% | 2,345 |
| Phillips | 58.12% | 1,317 | 40.73% | 923 | 1.15% | 26 | 0.53% | 12 | 17.39% | 394 |
| La Plata | 58.00% | 7,714 | 40.93% | 5,443 | 1.07% | 142 | 0.47% | 62 | 17.08% | 2,271 |
| Park | 57.22% | 1,909 | 40.26% | 1,343 | 2.52% | 84 | 0.63% | 21 | 16.97% | 566 |
| Garfield | 57.44% | 6,358 | 41.74% | 4,620 | 0.81% | 90 | 0.38% | 42 | 15.70% | 1,738 |
| Crowley | 57.58% | 862 | 42.08% | 630 | 0.33% | 5 | 0.20% | 3 | 15.50% | 232 |
| Yuma | 57.30% | 2,513 | 41.84% | 1,835 | 0.87% | 38 | 0.50% | 22 | 15.46% | 678 |
| Jefferson | 56.72% | 110,820 | 41.88% | 81,824 | 1.40% | 2,735 | 0.57% | 1,120 | 14.84% | 28,996 |
| Prowers | 57.08% | 2,978 | 42.30% | 2,207 | 0.61% | 32 | 1.32% | 69 | 14.78% | 771 |
| Logan | 56.64% | 4,485 | 42.71% | 3,382 | 0.66% | 52 | 0.71% | 56 | 13.93% | 1,103 |
| Gunnison | 56.12% | 2,520 | 42.25% | 1,897 | 1.63% | 73 | 0.73% | 33 | 13.88% | 623 |
| Eagle | 56.09% | 4,366 | 42.57% | 3,314 | 1.34% | 104 | 0.32% | 25 | 13.51% | 1,052 |
| Weld | 55.67% | 26,497 | 43.17% | 20,548 | 1.16% | 553 | 0.41% | 194 | 12.50% | 5,949 |
| Morgan | 55.79% | 4,795 | 43.37% | 3,728 | 0.84% | 72 | 0.99% | 85 | 12.41% | 1,067 |
| Larimer | 55.53% | 45,967 | 43.13% | 35,703 | 1.34% | 1,106 | 0.35% | 289 | 12.40% | 10,264 |
| Mineral | 55.36% | 217 | 44.39% | 174 | 0.26% | 1 | 0.51% | 2 | 10.97% | 43 |
| Chaffee | 54.20% | 3,080 | 44.84% | 2,548 | 0.97% | 55 | 0.55% | 31 | 9.36% | 532 |
| Alamosa | 54.00% | 2,567 | 45.14% | 2,146 | 0.86% | 41 | 0.50% | 24 | 8.86% | 421 |
| Routt | 51.89% | 3,264 | 46.45% | 2,922 | 1.65% | 104 | 0.45% | 28 | 5.44% | 342 |
| Summit | 51.63% | 2,893 | 46.31% | 2,595 | 2.05% | 115 | 0.37% | 21 | 5.32% | 298 |
| San Juan | 50.97% | 210 | 46.60% | 192 | 2.43% | 10 | 0.49% | 2 | 4.37% | 18 |
| Otero | 51.97% | 4,265 | 47.64% | 3,910 | 0.39% | 32 | 1.10% | 90 | 4.33% | 355 |
| Clear Creek | 50.35% | 1,820 | 46.97% | 1,698 | 2.68% | 97 | 0.44% | 16 | 3.37% | 122 |
| Bent | 48.16% | 1,032 | 50.77% | 1,088 | 1.07% | 23 | 1.12% | 24 | -2.61% | -56 |
| Saguache | 47.11% | 945 | 51.50% | 1,033 | 1.40% | 28 | 0.35% | 7 | -4.39% | -88 |
| Gilpin | 46.11% | 728 | 50.92% | 804 | 2.98% | 47 | 0.70% | 11 | -4.81% | -76 |
| Adams | 46.07% | 43,163 | 52.80% | 49,464 | 1.13% | 1,059 | 0.44% | 408 | -6.73% | -6,301 |
| Boulder | 45.06% | 48,174 | 53.57% | 57,265 | 1.37% | 1,463 | 0.30% | 320 | -8.50% | -9,091 |
| San Miguel | 43.61% | 798 | 52.51% | 961 | 3.88% | 71 | 0.49% | 9 | -8.91% | -163 |
| Pitkin | 44.41% | 2,801 | 54.23% | 3,420 | 1.36% | 86 | 0.30% | 19 | -9.81% | -619 |
| Conejos | 42.01% | 1,445 | 57.44% | 1,976 | 0.55% | 19 | 0.20% | 7 | -15.44% | -531 |
| Lake | 38.41% | 969 | 60.09% | 1,516 | 1.51% | 38 | 0.79% | 20 | -21.68% | -547 |
| Pueblo | 37.85% | 20,119 | 61.68% | 32,788 | 0.48% | 253 | 0.29% | 152 | -23.83% | -12,669 |
| Denver | 37.51% | 77,753 | 61.36% | 127,173 | 1.13% | 2,342 | 1.04% | 2,155 | -23.84% | -49,420 |
| Huerfano | 36.37% | 1,079 | 63.23% | 1,876 | 0.40% | 12 | 0.10% | 3 | -26.86% | -797 |
| Las Animas | 34.49% | 2,162 | 65.00% | 4,075 | 0.51% | 32 | 0.97% | 61 | -30.52% | -1,913 |
| Costilla | 28.81% | 454 | 71.07% | 1,120 | 0.13% | 2 | 0.32% | 5 | -42.26% | -666 |
References[]
- ^ "CQ Almanac Online Edition". library.cqpress.com. Retrieved 2020-11-13.
- ^ Sullivan, Robert David; ‘How the Red and Blue Map Evolved Over the Past Century’; America Magazine in The National Catholic Review; June 29, 2016
- ^ "1988 Presidential General Election Results - Colorado". Dave Leip's Atlas of U.S. Presidential Elections. Retrieved 2013-01-29.
- ^ a b c d Our Campaigns; CO US President, November 08, 1988
State and district results of the 1988 U.S. presidential election | ||
|---|---|---|
|  | |
- 1988 United States presidential election by state
- United States presidential elections in Colorado
- 1988 Colorado elections