From Wikipedia, the free encyclopedia
This article
does not cite any sources .
Please help by adding citations to reliable sources . Unsourced material may be challenged and removed .Find sources: – · · · scholar · JSTOR (August 2020 ) (Learn how and when to remove this template message
2004 Dún Laoghaire–Rathdown County Council election
First party
Second party
Third party
Party
Fine Gael
Fianna Fáil
Labour
Seats won
9
7
6
Seat change
+1
-3
-
Fourth party
Fifth party
Sixth party
Party
Green
PD
Independent
Seats won
4
1
1
Seat change
+3
-2
+1
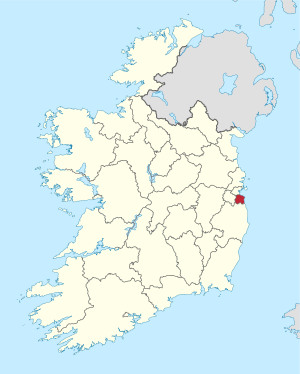
Map showing the area of Dún Laoghaire–Rathdown County Council
Council control after election TBD
An election to Dún Laoghaire–Rathdown County Council that year's Irish local elections . 28 councillors were elected from six electoral divisions by PR-STV voting for a five-year term of office.
Results by party [ ] Results by Electoral Area [ ] Ballybrack [ ]
Ballybrack - 6 seats
Party
Candidate
FPv% Count
1
2
3
4
5
Fine Gael
Donal Marren *
14.59
2,469
Labour
Denis O'Callaghan *
13.81
2,337
2,421
Fianna Fáil
Larry Butler 12.38
2,094
2,110
2,783
Fine Gael
Maria Bailey
12.15
2,055
2,070
2,224
2,326
2,432
Labour
Carrie Smyth *
11.81
1,998
2,040
2,190
2,237
2,662
Green
Tom Kivlehan
8.98
1,519
1,604
1,657
1,700
2,085
PD
Dr. Mazhar Bari
8.33
1,410
764
779
806
808
Fianna Fáil
Bernie Lowe*
7.68
1,299
1,041
1,059
1,101
1,102
Sinn Féin
Mick Nolan
7.53
1,274
706
746
765
767
Socialist Workers
Dave Lordan
2.74
464
282
300
Electorate: 33,550 Valid: 16,919 (50.43%) Spoilt: 375 Quota: 2,418 Turnout: 17,294 (51.55%)
Blackrock [ ]
Blackrock - 4 seats
Party
Candidate
FPv% Count
1
2
3
4
5
6
Labour
Niamh Bhreathnach 23.40
2,738
Fine Gael
Marie Baker
18.61
2,177
2,254
2,423
PD
Victor Boyhan *
12.25
1,433
1,467
1,540
1,553
1,694
2,074
Fianna Fáil
Barry Conway *
11.91
1,393
1,423
1,456
1,459
2,124
2,319
Green
Nessa Childers 10.50
1,229
1,293
1,572
1,607
1,721
2,113
Fianna Fáil
Lorcan Mooney
9.26
1,083
1,108
1,138
1,141
Fine Gael
William Dockrell*
9.06
1,060
1,091
1,137
1,165
1,247
Labour
Angela Timlin
5.02
587
723
Electorate: 22,665 Valid: 11,700 (51.62%) Spoilt: 236 Quota: 2,341 Turnout: 11,936 (52.66%)
Dundrum [ ]
Dundrum - 6 seats
Party
Candidate
FPv% Count
1
2
3
4
5
6
7
8
9
10
Labour
Aidan Culhane *
12.74
2,216
2,271
2,338
2,418
2,575
Fianna Fáil
Tony Fox *
12.20
2,121
2,156
2,258
2,377
2,598
Green
Ciaran Fallon
12.08
2,101
2,219
2,352
2,537
Fine Gael
Jim O'Leary
10.64
1,850
1,942
1,986
2,015
2,205
2,216
2,237
2,241
2,525
Fianna Fáil
Trevor Matthews *
8.71
1,515
1,541
1,582
1,616
1,723
1,760
1,768
1,774
2,538
Fianna Fáil
Tony Kelly*
8.67
1,508
1,534
1,554
1,601
1,682
1,722
1,732
1,737
Fine Gael
Pat Hand *
8.42
1,465
1,535
1,570
1,602
1,768
1,790
1,829
1,836
2,031
2,075
Socialist Party
Lisa Maher
7.40
1,287
1,311
1,448
1,757
1,814
1,817
1,829
1,859
1,982
1,991
PD
Mary Fitzpatrick
5.96
1,037
1,069
1,103
1,134
Sinn Féin
Ray O'Kelly
5.63
979
1,003
1,075
Independent
Michael Langsdorf
3.84
667
759
Independent
Seamus O'Neill
3.71
645
Electorate: 32,053 Valid: 17,391 (54.26%) Spoilt: 413 Quota: 2,485 Turnout: 17,804 (55.55%)
Dún Laoghaire [ ]
Dún Laoghaire - 6 seats
Party
Candidate
FPv% Count
1
2
3
4
5
6
7
8
Fine Gael
John Bailey 12.08
2,189
2,222
2,268
2,500
2,603
PD
Mary Mitchell O'Connor 11.14
2,018
2,100
2,142
2,282
2,360
2,576
2,771
Fine Gael
Eugene Regan 10.80
1,957
1,994
2,012
2,454
2,499
2,585
2,679
Fianna Fáil
Cormac Devlin 9.80
1,776
1,981
2,012
2,067
2,205
3,118
Green
Kealin Ireland *
9.75
1,767
1,795
1,858
1,920
2,313
2,397
2,469
2,497
Socialist Workers
Richard Boyd Barrett
7.94
1,439
1,450
1,502
1,527
Labour
Chris O'Malley *
7.84
1,420
1,444
1,655
1,751
1,967
2,082
2,124
2,167
Fianna Fáil
Brendan Kiely
7.72
1,399
1,626
1,642
1,664
1,736
Labour
Jane Dillon-Byrne *
7.43
1,346
1,364
1,748
1,816
2,117
2,207
2,274
2,288
Fine Gael
Tom O'Higgins
6.38
1,156
1,179
1,201
Labour
Roger Cole
4.99
905
914
Fianna Fáil
Eimear McAuliffe
4.14
750
Electorate: 34,737 Valid: 18,122 (52.17%) Spoilt: 449 Quota: 2,589 Turnout: 18,571 (53.46%)
Glencullen [ ]
Glencullen - 3 seats
Party
Candidate
FPv% Count
1
2
3
4
5
Labour
Lettie McCarthy
22.94
1,941
2,112
2,670
Fianna Fáil
Maria Corrigan 21.42
1,812
1,899
2,086
2,171
Fianna Fáil
Tom Murphy*
19.23
1,627
1,700
1,796
1,844
1,864
Fine Gael
Tom Joyce *
15.26
1,333
1,385
1,628
1,865
1,881
Green
Terence Corish
11.89
1,006
1,228
Sinn Féin
Joe Comerford
8.76
741
Electorate: 15,898 Valid: 8,460 (53.21%) Spoilt: 173 Quota: 2,116 Turnout: 8,633 (54.30%)
Stillorgan [ ]
Stillorgan - 3 seats
Party
Candidate
FPv% Count
1
2
3
4
5
6
Independent
Gearóid O'Keeffe
26.04
2,309
Fianna Fáil
Gerry Horkan 16.74
1,497
1,730
1,748
1,831
1,900
2,262
Labour
Margaret McCluskey
8.70
1,061
1,078
1,093
1,421
1,523
1,764
Fine Gael
Louise Cosgrave *
17.03
1,039
1,070
1,084
1,208
1,800
2,210
PD
Barry Saul*
10.65
953
993
1,013
1,112
1,236
Fine Gael
Shane Molloy
9.65
863
887
898
942
Green
Simon Curtis
9.06
810
824
838
Fianna Fáil
Mary White
4.39
393
Electorate: 15,589 Valid: 8,945 (57.38%) Spoilt: 161 Quota: 2,237 Turnout: 9,106 (58.41%)
External links [ ]
Categories :
2004 Irish local elections Dún Laoghaire–Rathdown County Council elections Hidden categories:
Articles lacking sources from August 2020 All articles lacking sources All articles with dead external links Articles with dead external links from April 2019 Articles with permanently dead external links