2004 United States presidential election in Michigan
| ||||||||||||||||||||||||||
| Turnout | 64.7% | |||||||||||||||||||||||||
|---|---|---|---|---|---|---|---|---|---|---|---|---|---|---|---|---|---|---|---|---|---|---|---|---|---|---|
| ||||||||||||||||||||||||||
 County Results
| ||||||||||||||||||||||||||
| ||||||||||||||||||||||||||
| Elections in Michigan |
|---|
 |
|
|
|
|
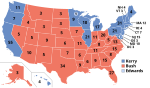
The 2004 United States presidential election in Michigan took place on November 2, 2004, and was part of the 2004 United States presidential election. Voters chose 17 representatives, or electors to the Electoral College, who voted for president and vice president.
Michigan was won by Democratic nominee John Kerry by a 3.4% margin of victory. Although no Republican carried this state in a presidential election since Bush's father George H. W. Bush in 1988, early polling showed the race was a toss-up, thus was considered as a possible target for the Republicans. Later polling favored Kerry, leading half of the news organizations to predict that Kerry would win the state, but the other half still considered it a swing state.
Although Michigan was also not carried by the winner of the 2000 presidential race, 2004 also marked the first time since 1976 in which the state was not carried by the candidate who led in the overall popular vote. Bush is to date the only Republican presidential candidate to win two terms in office without winning Michigan at least once.
As of 2020, this is the most recent election in which Michigan would vote for the losing candidate.
Caucuses[]
Campaign[]
Predictions[]
There were 12 news organizations who made state-by-state predictions of the election. Here are their last predictions before election day.[2]
- D.C. Political Report: Slight Democrat
- Associated Press: Toss-Up
- CNN: Kerry
- Cook Political Report: Lean Democrat
- Newsweek: Leans Kerry
- New York Times: Leans Kerry
- Rasmussen Reports: Toss-Up
- Research 2000: Lean Kerry
- Washington Post: Battleground
- Washington Times: Leans Kerry
- Zogby International: Kerry
- Washington Dispatch: Kerry
Polling[]
Pre-election polling did show a close race early on, but in the fall election Kerry pulled away and won every poll since the month of September. The last 3 poll average showed Kerry leading 49% to 46%.[3]
Fundraising[]
Bush raised $4,960,010.[4] Kerry raised $2,496,203.[5]
Advertising and visits[]
In the fall campaign, Bush visited the state ten times. Kerry visited seven times. Both candidates combined spent over $2 million in advertising each week,[6] but Kerry spent slightly more each week.[7]
Analysis[]
Kerry won Michigan with 51.2% and by a margin of 3.4%. While a reduced margin with respect to Gore's in 2000, the state trended Democratic in 2004 relative to the nation.[8] Bush won a majority of the state's counties and congressional districts, holding Kerry to only 15 counties (whereas Gore had carried 24). But he underperformed previous Republicans in two large suburban counties that had recently been Republican strongholds in the state, Oakland and Macomb Counties. Kerry narrowly held onto Oakland County, which had voted Republican in every election from 1940 through 1992 save 1964, and had voted to re-elect Bill Clinton in 1996 by only 4.3%. Bush did flip Macomb County, which Gore had become the second Democrat to carry after a twenty-year run of voting Republican from 1972 through 1992, but he carried it by only 1.4%, making it still slightly bluer than the nation. Meanwhile, Kerry maintained the traditional Democratic domination of Wayne County, winning about the same 69% vote share in it that Gore had won in 2000. Michigan had voted Republican in every election from 1972 through 1988, in all of which Oakland and Macomb had given the Republican a healthy margin.
Results[]
| 2004 United States presidential election in Michigan | |||||
|---|---|---|---|---|---|
| Party | Candidate | Votes | Percentage | Electoral votes | |
| Democratic | John Kerry | 2,479,183 | 51.2% | 17 | |
| Republican | George W. Bush (incumbent) | 2,313,746 | 47.8% | 0 | |
| Independent | Ralph Nader | 24,035 | 0.5% | 0 | |
| Libertarian | Michael Badnarik | 10,552 | 0.2% | 0 | |
| Green | David Cobb | 5,325 | 0.1% | 0 | |
| US Taxpayers | Michael Peroutka | 4,980 | 0.1% | 0 | |
| Natural Law | Walt Brown | 1,431 | 0.0% | 0 | |
| Totals | 4,839,252 | 100.00% | 17 | ||
| Voter turnout (Voting Age Population) | 64.2% | ||||
Results breakdown[]
By county[]
| County | Kerry | Bush | Others | Total votes | |||
|---|---|---|---|---|---|---|---|
| % | # | % | # | % | # | ||
| Alcona | 43.96% | 2,871 | 55.00% | 3,592 | 1.04% | 68 | 6,531 |
| Alger | 50.26% | 2,395 | 48.65% | 2,318 | 1.09% | 52 | 4,765 |
| Allegan | 35.90% | 19,355 | 63.11% | 34,022 | 0.98% | 530 | 53,907 |
| Alpena | 48.70% | 7,407 | 50.39% | 7,665 | 0.91% | 139 | 15,211 |
| Antrim | 37.24% | 5,072 | 61.52% | 8,379 | 1.23% | 168 | 13,619 |
| Arenac | 49.61% | 4,076 | 49.55% | 4,071 | 0.84% | 69 | 8,216 |
| Baraga | 45.06% | 1,660 | 53.66% | 1,977 | 1.28% | 47 | 3,684 |
| Barry | 37.37% | 11,312 | 61.57% | 18,638 | 1.06% | 322 | 30,272 |
| Bay | 54.42% | 31,049 | 44.60% | 25,448 | 0.98% | 562 | 57,059 |
| Benzie | 44.83% | 4,383 | 54.04% | 5,284 | 1.14% | 111 | 9,778 |
| Berrien | 43.99% | 32,846 | 55.01% | 41,076 | 1.00% | 749 | 74,671 |
| Branch | 38.98% | 7,004 | 60.02% | 10,784 | 1.00% | 179 | 17,967 |
| Calhoun | 47.70% | 29,891 | 51.21% | 32,093 | 1.09% | 683 | 62,667 |
| Cass | 42.02% | 9,537 | 57.12% | 12,964 | 0.86% | 196 | 22,697 |
| Charlevoix | 40.52% | 5,729 | 58.09% | 8,214 | 1.39% | 196 | 14,139 |
| Cheboygan | 42.78% | 5,941 | 56.15% | 7,798 | 1.07% | 148 | 13,887 |
| Chippewa | 43.69% | 7,203 | 55.33% | 9,122 | 0.99% | 163 | 16,488 |
| Clare | 49.09% | 6,984 | 49.82% | 7,088 | 1.08% | 154 | 14,226 |
| Clinton | 40.95% | 15,483 | 58.16% | 21,989 | 0.89% | 335 | 37,807 |
| Crawford | 43.21% | 3,126 | 55.52% | 4,017 | 1.27% | 92 | 7,235 |
| Delta | 48.76% | 9,381 | 50.32% | 9,680 | 0.92% | 177 | 19,238 |
| Dickinson | 41.70% | 5,650 | 57.08% | 7,734 | 1.22% | 165 | 13,549 |
| Eaton | 45.58% | 25,411 | 53.41% | 29,781 | 1.01% | 563 | 55,755 |
| Emmet | 39.41% | 6,846 | 59.48% | 10,332 | 1.12% | 194 | 17,372 |
| Genesee | 60.03% | 128,334 | 39.23% | 83,870 | 0.73% | 1,571 | 213,775 |
| Gladwin | 47.95% | 6,343 | 51.18% | 6,770 | 0.86% | 114 | 13,227 |
| Gogebic | 52.31% | 4,421 | 46.56% | 3,935 | 1.14% | 96 | 8,452 |
| Grand Traverse | 39.52% | 18,256 | 59.42% | 27,446 | 1.06% | 489 | 46,191 |
| Gratiot | 42.45% | 7,377 | 56.59% | 9,834 | 0.97% | 168 | 17,379 |
| Hillsdale | 35.23% | 7,123 | 63.34% | 12,804 | 1.43% | 289 | 20,216 |
| Houghton | 42.46% | 6,731 | 56.08% | 8,889 | 1.46% | 231 | 15,851 |
| Huron | 43.68% | 7,629 | 55.37% | 9,671 | 0.95% | 166 | 17,466 |
| Ingham | 57.78% | 76,877 | 41.14% | 54,734 | 1.08% | 1,442 | 133,053 |
| Ionia | 38.55% | 10,647 | 60.18% | 16,621 | 1.27% | 350 | 27,618 |
| Iosco | 46.82% | 6,557 | 52.13% | 7,301 | 1.06% | 148 | 14,006 |
| Iron | 49.38% | 3,215 | 49.52% | 3,224 | 1.11% | 72 | 6,511 |
| Isabella | 50.57% | 12,334 | 48.19% | 11,754 | 1.24% | 302 | 24,390 |
| Jackson | 43.21% | 31,025 | 55.75% | 40,029 | 1.03% | 741 | 71,795 |
| Kalamazoo | 51.31% | 61,462 | 47.71% | 57,147 | 0.98% | 1,174 | 119,783 |
| Kalkaska | 38.05% | 3,189 | 60.67% | 5,084 | 1.28% | 107 | 8,380 |
| Kent | 40.19% | 116,909 | 58.85% | 171,201 | 0.96% | 2,781 | 290,891 |
| Keweenaw | 43.78% | 630 | 54.27% | 781 | 1.95% | 28 | 1,439 |
| Lake | 50.99% | 2,675 | 47.71% | 2,503 | 1.30% | 68 | 5,246 |
| Lapeer | 40.97% | 18,086 | 57.89% | 25,556 | 1.14% | 505 | 44,147 |
| Leelanau | 43.46% | 6,048 | 55.57% | 7,733 | 0.98% | 136 | 13,917 |
| Lenawee | 44.22% | 20,787 | 54.61% | 25,675 | 1.17% | 550 | 47,012 |
| Livingston | 36.26% | 33,991 | 62.79% | 58,860 | 0.95% | 891 | 93,742 |
| Luce | 36.94% | 1,045 | 61.82% | 1,749 | 1.24% | 35 | 2,829 |
| Mackinac | 42.72% | 2,819 | 56.16% | 3,706 | 1.12% | 74 | 6,599 |
| Macomb | 48.75% | 196,160 | 50.24% | 202,166 | 1.01% | 4,084 | 402,410 |
| Manistee | 49.23% | 6,272 | 49.41% | 6,295 | 1.36% | 173 | 12,740 |
| Marquette | 53.60% | 17,412 | 45.22% | 14,690 | 1.19% | 386 | 32,488 |
| Mason | 43.34% | 6,333 | 55.60% | 8,124 | 1.05% | 154 | 14,611 |
| Mecosta | 43.97% | 7,730 | 55.23% | 9,710 | 0.80% | 141 | 17,581 |
| Menominee | 46.64% | 5,326 | 52.04% | 5,942 | 1.32% | 151 | 11,419 |
| Midland | 42.41% | 18,355 | 56.31% | 24,369 | 1.27% | 551 | 43,275 |
| Missaukee | 31.25% | 2,319 | 68.12% | 5,055 | 0.63% | 47 | 7,421 |
| Monroe | 48.68% | 36,089 | 50.54% | 37,470 | 0.77% | 573 | 74,132 |
| Montcalm | 42.91% | 11,471 | 55.99% | 14,968 | 1.10% | 295 | 26,734 |
| Montmorency | 39.48% | 2,196 | 59.32% | 3,300 | 1.20% | 67 | 5,563 |
| Muskegon | 55.14% | 44,282 | 43.96% | 35,302 | 0.91% | 729 | 80,313 |
| Newaygo | 39.60% | 9,057 | 59.49% | 13,608 | 0.91% | 208 | 22,873 |
| Oakland | 49.75% | 319,387 | 49.32% | 316,633 | 0.93% | 5,957 | 641,977 |
| Oceana | 44.25% | 5,441 | 54.30% | 6,677 | 1.46% | 179 | 12,297 |
| Ogemaw | 48.30% | 5,215 | 50.52% | 5,454 | 1.18% | 127 | 10,796 |
| Ontonagon | 44.44% | 1,863 | 53.96% | 2,262 | 1.60% | 67 | 4,192 |
| Osceola | 39.93% | 4,467 | 58.98% | 6,599 | 1.09% | 122 | 11,188 |
| Oscoda | 40.64% | 1,792 | 58.29% | 2,570 | 1.07% | 47 | 4,409 |
| Otsego | 37.98% | 4,674 | 60.70% | 7,470 | 1.32% | 163 | 12,307 |
| Ottawa | 27.64% | 35,552 | 71.55% | 92,048 | 0.81% | 1,043 | 128,643 |
| Presque Isle | 45.66% | 3,432 | 52.98% | 3,982 | 1.36% | 102 | 7,516 |
| Roscommon | 47.43% | 6,810 | 51.28% | 7,364 | 1.29% | 185 | 14,359 |
| Saginaw | 53.37% | 54,887 | 45.86% | 47,165 | 0.78% | 800 | 102,852 |
| St. Clair | 45.36% | 36,174 | 53.60% | 42,740 | 1.04% | 829 | 79,743 |
| St. Joseph | 38.23% | 9,648 | 60.78% | 15,340 | 0.99% | 251 | 25,239 |
| Sanilac | 37.97% | 7,883 | 60.84% | 12,632 | 1.19% | 248 | 20,763 |
| Schoolcraft | 48.12% | 2,137 | 51.05% | 2,267 | 0.83% | 37 | 4,441 |
| Shiawassee | 46.06% | 16,881 | 52.95% | 19,407 | 0.99% | 363 | 36,651 b |
| Tuscola | 44.57% | 12,631 | 54.31% | 15,389 | 1.12% | 318 | 28,338 |
| Van Buren | 47.26% | 16,151 | 51.60% | 17,634 | 1.14% | 389 | 34,174 |
| Washtenaw | 63.46% | 109,953 | 35.47% | 61,455 | 1.07% | 1,856 | 173,264 |
| Wayne | 69.39% | 600,047 | 29.81% | 257,750 | 0.80% | 6,931 | 864,728 |
| Wexford | 39.80% | 6,034 | 59.14% | 8,966 | 1.06% | 160 | 15,160 |
Counties that flipped from Democratic to Republican[]
- Alpena (largest municipality: Alpena)
- Calhoun (largest municipality: Battle Creek)
- Clare (largest municipality: Clare)
- Iosco (largest municipality: East Tawas)
- Iron (largest municipality: Iron River)
- Macomb (largest municipality: Warren)
- Manistee (largest municipality: Manistee)
- Monroe (largest municipality: Monroe)
- Ogemaw (largest municipality: Skidway Lake)
- Roscommon (largest municipality: Houghton Lake)
Counties that flipped from Republican to Democratic[]
- Alger (largest municipality: Munising)
By congressional district[]
Bush won 10 of 15 congressional districts.[9]
| District | Bush | Kerry | Representative |
|---|---|---|---|
| 1st | 53% | 46% | Bart Stupak |
| 2nd | 60% | 39% | Peter Hoekstra |
| 3rd | 59% | 40% | Vern Ehlers |
| 4th | 55% | 44% | Dave Camp |
| 5th | 41% | 59% | Dale Kildee |
| 6th | 53% | 46% | Fred Upton |
| 7th | 54% | 45% | Nick Smith |
| Joe Schwarz | |||
| 8th | 54% | 45% | Mike Rogers |
| 9th | 51% | 49% | Joe Knollenberg |
| 10th | 57% | 43% | Candice Miller |
| 11th | 53% | 47% | Thaddeus McCotter |
| 12th | 39% | 61% | Sander Levin |
| 13th | 19% | 81% | Carolyn Cheeks Kilpatrick |
| 14th | 17% | 83% | John Conyers Jr. |
| 15th | 38% | 62% | John Dingell |
Electors[]
Technically the voters of Michigan cast their ballots for electors: representatives to the Electoral College. Michigan is allocated 17 electors because it has 15 congressional districts and two senators. All candidates who appear on the ballot or qualify to receive write-in votes must submit a list of 17 electors, who pledge to vote for their candidate and his or her running mate. Whoever wins the majority of votes in the state is awarded all 17 electoral votes. Their chosen electors then vote for president and vice president. Although electors are pledged to their candidate and running mate, they are not obligated to vote for them. An elector who votes for someone other than his or her candidate is known as a faithless elector.
The electors of each state and the District of Columbia met on December 13, 2004, to cast their votes for president and vice president. The Electoral College itself never meets as one body. Instead the electors from each state and the District of Columbia met in their respective capitols.
The following were the members of the Electoral College from the state. All 17 were pledged for Kerry/Edwards:
- Carol Vining Moore
- Margaret Robinson
- Ida I. DeHaas
- Marcela L. Ort
- Vickie Sue Price
- Paul Todd
- Leonard Smigielski
- Bruce McAttee
- Stanley W. Harris
- Yvonne Williams
- Elizabeth D. Tavarozzi
- Charley Jackson
- Joan Robinson Cheeks
- Roger Short
- Harless Scott
- Richard Shoemaker
- Michael Pitt
See also[]
- Presidency of George W. Bush
- United States presidential elections in Michigan
References[]
- ^ http://www.michigan.gov/sos/0,4670,7-127-1633_8722-29616--,00.html
- ^ [1]
- ^ http://uselectionatlas.org/USPRESIDENT/GENERAL/CAMPAIGN/2004/polls.php?fips=26
- ^ http://www.campaignmoney.com/political/campaigns/george_w_bush.asp?cycle=04
- ^ http://www.campaignmoney.com/political/campaigns/john_f_kerry.asp?cycle=04
- ^ http://www.cnn.com/ELECTION/2004/special/president/campaign.ads/
- ^ http://www.cnn.com/ELECTION/2004/special/president/showdown/MI/
- ^ Leip, Dave (September 17, 2020). "Dave Leip's Atlas of U.S. Presidential Elections".
- ^ http://www.swingstateproject.com/diary/4161/
State and district results of the 2004 United States presidential election | ||
|---|---|---|
|  | |
- 2004 United States presidential election by state
- United States presidential elections in Michigan
- 2004 Michigan elections