2004 United States presidential election in Iowa
| ||||||||||||||||||||||||||
| ||||||||||||||||||||||||||
 County Results
| ||||||||||||||||||||||||||
| ||||||||||||||||||||||||||
| Elections in Iowa |
|---|
 |
|
|
|
|
|
|
|
|
The 2004 United States presidential election in Iowa took place on November 2, 2004, as part of the 2004 United States presidential election in which all 50 states plus the District of Columbia participated. Voters chose seven electors to represent them in the Electoral College via a popular vote pitting incumbent Republican President George W. Bush and his running mate, Vice President Dick Cheney, against Democratic challenger and Senator from Massachusetts John F. Kerry and his running mate, Senator from North Carolina John Edwards. Six third parties were also on the ballot.
Iowa was won by President George W. Bush by a 0.67% margin of victory, or 10,059 votes, despite losing the state to Al Gore four years earlier. Prior to the election, most news organizations considered this a swing state. The Democrats had won Iowa in the previous four presidential elections, though only narrowly in 2000. Gore had won the state by only 0.32 percentage points, or 4,144 votes, a much weaker margin compared to the prior three elections. In 1988, Democrat Michael Dukakis won the state by 10.21% even in an otherwise Republican landslide year, and Bill Clinton carried the state by 6.02% in 1992 and 10.34% in 1996. Iowa was one of just two states, along with New Mexico, to vote for Gore in 2000 but flip to Bush in 2004, although it was won both times by narrow margins. Bush became the first Republican to win Iowa since Ronald Reagan had done so in 1984. This is the last time a Republican won Iowa by only a plurality. Until 2020, this was the last time Iowa did not vote for the same candidate as neighboring Wisconsin.
Democratic caucuses[]
Campaign[]
Predictions[]
There were 12 news organizations who made state-by-state predictions of the election. Here are their last predictions before election day.[1]
- D.C. Political Report: Lean Democratic
- Associated Press: Toss-up
- CNN: Bush
- Cook Political Report: Toss-up
- Newsweek: Leans Bush
- New York Times: Leans Bush
- Rasmussen Reports: Toss-up
- Research 2000: Lean Kerry
- Washington Post: Battleground
- Washington Times: Battleground
- Zogby International: Kerry
- Washington Dispatch: Kerry
Polling[]
Polls showed the state was a pure tossup with neither candidate reaching a consistent lead. The last three polls averaged both candidates at 48%, with the last-second deciders the key to victory.[2] The final RealClearPolitics average gave Bush leading with a margin of 0.3%, with 47.4% to Kerry at 47.1% and Nader at 1.0%.[3]
Fundraising[]
Bush raised $671,335.[4] Kerry raised $449,980.[5]
Advertising and visits[]
The Kerry campaign visited the state 11 times to Bush's 10 times.[6] Both campaigns spent between $400,000 to $600,000 each week in television advertising.[7]
Analysis[]
Kerry's strength in the state lay in the highly-populated counties of Polk (Des Moines), Linn (Cedar Rapids), Scott (Davenport), Johnson (Iowa City), and Black Hawk (Waterloo). Johnson County, home to the University of Iowa, gave Kerry 64.01% of its vote, Kerry's best performance in the state. However, Kerry also did well in a series of rural and small-town counties in northeastern Iowa and along the Mississippi River, many of which had been traditionally Democratic since at least the 1980s.[8] He won eight of the ten counties along the Mississippi River, including Dubuque County, which had given Gore his margin in the state in 2000. The 1st and 2nd congressional districts were both carried by Kerry, despite being represented by Republicans in Congress.[9] Dubuque is located within the 1st district while the 2nd district contains Cedar Rapids, Iowa City, and Muscatine.[10]
However, Bush performed respectably even in areas of Democratic strength; in only two counties did he obtain less than 40% of the vote. And he was able to offset Kerry's strength in the population centers and in the northeast and Mississippi River counties with landslide margins in a series of rural counties in the west of the state, as well as by dominating the state's south. Bush's best performance in the state was in Sioux County, where he won with 85.87% of the vote. His raw vote margin in Sioux County of 11,970 votes alone was greater than his raw vote margin over Kerry statewide.[11] Bush won three congressional districts in the state: the 3rd district, home to the Democratic city of Des Moines and its Republican suburbs, gave Bush a razor thin 50-50 margin, despite re-electing Democrat Leonard Boswell to Congress. The 4th district also gave Bush a narrow margin, giving him 51% of the vote. The now obsolete 5th district in the western part of the state was home to the Hawkeye State's most Republican areas, having elected Steve King to Congress in 2002; it gave Bush a landslide 21-point margin.
In terms of counties carried, both candidates flipped counties. Bush flipped four that voted for Gore in 2000, while Kerry flipped five that voted for Bush in 2000.[12]
This election coincided with the 2004 United States Senate election in Iowa, where Republican Chuck Grassley was effortlessly re-elected with 70.83% of the vote.[13]
Iowa would return to the Democratic column in the next two elections, voting for Barack Obama by 9.54% in 2008 and 5.81% in 2012. However, in 2016, it returned to the Republican column when Donald Trump would win the state by 9.41%, the largest margin of victory for a Republican presidential nominee in the state since Ronald Reagan's in 1980.
Results[]
| 2004 United States presidential election in Iowa | ||||||
|---|---|---|---|---|---|---|
| Party | Candidate | Running mate | Votes | Percentage | Electoral votes | |
| Republican | George W. Bush | Richard Cheney | 751,957 | 49.90% | 7 | |
| Democratic | John Kerry | John Edwards | 741,898 | 49.23% | 0 | |
| Independent | Ralph Nader | Peter Camejo | 5,973 | 0.40% | 0 | |
| Libertarian | Michael Badnarik | Richard Campagna | 2,992 | 0.20% | 0 | |
| Constitution | Michael Peroutka | Chuck Baldwin | 1,304 | 0.09% | 0 | |
| Green | David Cobb | Pat LaMarche | 1,141 | 0.08% | 0 | |
| N/A | Write-ins | – | 1,094 | 0.07% | 0 | |
| Socialist Workers | Róger Calero | Margaret Trowe | 373 | 0.02% | 0 | |
| Socialist Equality | Bill Van Auken | Jim Lawrence | 176 | 0.01% | 0 | |
| Totals | 1,506,908 | 100% | 7 | |||
| Voter Turnout (Voting age/Registered) | 67%/76% | |||||
Results breakdown[]
By county[]
| County | Kerry | Votes | Bush | Votes | Others | Votes |
|---|---|---|---|---|---|---|
| Adair | 43.1% | 1,844 | 56.1% | 2,402 | 0.7% | 32 |
| Adams | 42.0% | 977 | 56.6% | 1,317 | 1.3% | 31 |
| Allamakee | 48.8% | 3,449 | 50.0% | 3,530 | 1.2% | 83 |
| Appanoose | 47.5% | 3,063 | 51.8% | 3,340 | 0.7% | 47 |
| Audubon | 44.8% | 1,608 | 54.5% | 1,958 | 0.7% | 26 |
| Benton | 50.0% | 6,747 | 49.3% | 6,658 | 0.7% | 96 |
| Black Hawk | 55.4% | 35,392 | 43.9% | 28,046 | 0.7% | 469 |
| Boone | 50.2% | 7,027 | 49.0% | 6,870 | 0.8% | 112 |
| Bremer | 47.1% | 6,025 | 52.2% | 6,665 | 0.7% | 89 |
| Buchanan | 53.5% | 5,608 | 45.8% | 4,797 | 0.7% | 70 |
| Buena Vista | 41.5% | 3,520 | 57.6% | 4,887 | 1.0% | 83 |
| Butler | 40.1% | 3,001 | 59.1% | 4,417 | 0.8% | 57 |
| Calhoun | 40.5% | 2,243 | 58.7% | 3,255 | 0.8% | 44 |
| Carroll | 44.6% | 4,689 | 54.8% | 5,762 | 0.7% | 73 |
| Cass | 35.5% | 2,679 | 63.6% | 4,796 | 0.9% | 68 |
| Cedar | 49.0% | 4,747 | 50.2% | 4,869 | 0.8% | 78 |
| Cerro Gordo | 54.5% | 13,372 | 44.7% | 10,960 | 0.8% | 184 |
| Cherokee | 44.0% | 2,988 | 55.3% | 3,758 | 0.7% | 50 |
| Chickasaw | 54.5% | 3,708 | 44.7% | 3,040 | 0.9% | 58 |
| Clarke | 50.9% | 2,323 | 48.2% | 2,200 | 0.9% | 43 |
| Clay | 41.3% | 3,547 | 57.0% | 4,898 | 1.7% | 143 |
| Clayton | 51.7% | 4,736 | 47.0% | 4,312 | 1.3% | 120 |
| Clinton | 56.0% | 13,813 | 43.2% | 10,666 | 0.8% | 205 |
| Crawford | 44.5% | 3,220 | 54.6% | 3,955 | 0.9% | 67 |
| Dallas | 41.5% | 10,917 | 57.7% | 15,183 | 0.7% | 193 |
| Davis | 44.2% | 1,731 | 54.8% | 2,148 | 1.0% | 39 |
| Decatur | 46.3% | 1,859 | 52.1% | 2,088 | 1.6% | 64 |
| Delaware | 45.9% | 4,227 | 53.3% | 4,908 | 0.7% | 65 |
| Des Moines | 59.7% | 12,456 | 39.4% | 8,221 | 0.9% | 197 |
| Dickinson | 43.3% | 4,140 | 55.9% | 5,337 | 0.8% | 76 |
| Dubuque | 56.5% | 26,561 | 42.7% | 20,100 | 0.8% | 382 |
| Emmet | 46.6% | 2,405 | 52.3% | 2,697 | 1.0% | 54 |
| Fayette | 49.9% | 5,185 | 49.3% | 5,128 | 0.8% | 79 |
| Floyd | 53.3% | 4,349 | 45.9% | 3,745 | 0.9% | 73 |
| Franklin | 42.4% | 2,340 | 56.7% | 3,128 | 1.0% | 53 |
| Fremont | 38.6% | 1,510 | 60.4% | 2,362 | 1.0% | 39 |
| Greene | 48.1% | 2,459 | 51.2% | 2,618 | 0.7% | 36 |
| Grundy | 34.8% | 2,386 | 64.7% | 4,429 | 0.5% | 34 |
| Guthrie | 43.6% | 2,614 | 55.5% | 3,325 | 0.9% | 55 |
| Hamilton | 46.7% | 3,895 | 52.4% | 4,367 | 0.9% | 73 |
| Hancock | 42.1% | 2,484 | 57.0% | 3,368 | 0.9% | 53 |
| Hardin | 44.9% | 4,015 | 54.5% | 4,875 | 0.7% | 59 |
| Harrison | 37.8% | 2,906 | 60.9% | 4,680 | 1.2% | 94 |
| Henry | 43.6% | 4,127 | 55.2% | 5,220 | 1.2% | 110 |
| Howard | 55.7% | 2,614 | 43.2% | 2,028 | 1.2% | 55 |
| Humboldt | 40.1% | 2,146 | 59.1% | 3,162 | 0.8% | 42 |
| Ida | 37.5% | 1,415 | 62.1% | 2,342 | 0.5% | 17 |
| Iowa | 45.4% | 3,841 | 53.7% | 4,544 | 0.8% | 69 |
| Jackson | 56.5% | 5,656 | 42.4% | 4,242 | 1.1% | 113 |
| Jasper | 52.0% | 10,430 | 47.2% | 9,462 | 0.8% | 170 |
| Jefferson | 54.2% | 4,490 | 44.1% | 3,648 | 1.7% | 143 |
| Johnson | 64.0% | 41,847 | 34.7% | 22,715 | 1.2% | 811 |
| Jones | 50.7% | 5,054 | 48.4% | 4,834 | 0.9% | 90 |
| Keokuk | 41.9% | 2,294 | 56.9% | 3,119 | 1.2% | 67 |
| Kossuth | 44.6% | 4,132 | 54.5% | 5,042 | 0.9% | 84 |
| Lee | 56.8% | 10,152 | 41.8% | 7,472 | 1.3% | 234 |
| Linn | 54.6% | 60,442 | 44.6% | 49,442 | 0.8% | 856 |
| Louisa | 46.7% | 2,297 | 52.3% | 2,572 | 1.0% | 47 |
| Lucas | 43.5% | 1,987 | 55.6% | 2,543 | 0.9% | 41 |
| Lyon | 21.4% | 1,303 | 77.9% | 4,751 | 0.8% | 47 |
| Madison | 42.2% | 3,380 | 56.7% | 4,538 | 1.1% | 86 |
| Mahaska | 35.3% | 3,790 | 63.9% | 6,858 | 0.7% | 80 |
| Marion | 39.4% | 6,574 | 59.8% | 9,990 | 0.8% | 132 |
| Marshall | 49.3% | 9,443 | 49.9% | 9,557 | 0.9% | 164 |
| Mills | 33.3% | 2,308 | 65.6% | 4,556 | 1.1% | 76 |
| Mitchell | 50.8% | 2,785 | 48.3% | 2,646 | 0.9% | 49 |
| Monona | 47.8% | 2,397 | 51.3% | 2,575 | 0.9% | 46 |
| Monroe | 46.8% | 1,855 | 52.2% | 2,067 | 1.0% | 41 |
| Montgomery | 34.2% | 1,899 | 64.8% | 3,601 | 1.0% | 56 |
| Muscatine | 51.0% | 9,542 | 48.2% | 9,020 | 0.8% | 155 |
| O'Brien | 30.1% | 2,330 | 68.9% | 5,328 | 0.9% | 73 |
| Osceola | 28.6% | 934 | 70.3% | 2,295 | 1.1% | 37 |
| Page | 29.4% | 2,211 | 69.8% | 5,243 | 0.8% | 59 |
| Palo Alto | 47.8% | 2,482 | 51.5% | 2,674 | 0.7% | 35 |
| Plymouth | 35.0% | 4,278 | 63.9% | 7,810 | 1.1% | 134 |
| Pocahontas | 42.2% | 1,822 | 56.6% | 2,441 | 1.2% | 50 |
| Polk | 51.9% | 105,218 | 47.3% | 95,828 | 0.8% | 1,572 |
| Pottawattamie | 40.4% | 16,906 | 58.7% | 24,558 | 0.9% | 356 |
| Poweshiek | 50.0% | 5,043 | 49.2% | 4,965 | 0.8% | 83 |
| Ringgold | 46.3% | 1,286 | 52.8% | 1,466 | 0.9% | 26 |
| Sac | 41.2% | 2,215 | 58.2% | 3,128 | 0.6% | 31 |
| Scott | 50.9% | 42,122 | 48.3% | 39,958 | 0.8% | 642 |
| Shelby | 35.3% | 2,355 | 63.8% | 4,256 | 0.9% | 59 |
| Sioux | 13.6% | 2,259 | 85.9% | 14,229 | 0.5% | 82 |
| Story | 52.2% | 23,296 | 46.6% | 20,819 | 1.2% | 537 |
| Tama | 49.9% | 4,487 | 49.5% | 4,456 | 0.6% | 58 |
| Taylor | 39.2% | 1,252 | 59.8% | 1,908 | 0.9% | 30 |
| Union | 46.0% | 2,747 | 52.9% | 3,165 | 1.1% | 66 |
| Van Buren | 40.9% | 1,568 | 57.6% | 2,211 | 1.5% | 57 |
| Wapello | 54.6% | 9,125 | 44.3% | 7,403 | 1.1% | 179 |
| Warren | 46.5% | 10,730 | 52.7% | 12,160 | 0.7% | 163 |
| Washington | 43.0% | 4,595 | 55.9% | 5,977 | 1.1% | 116 |
| Wayne | 44.0% | 1,379 | 55.3% | 1,733 | 0.7% | 21 |
| Webster | 51.3% | 9,561 | 48.1% | 8,959 | 0.6% | 111 |
| Winnebago | 45.5% | 2,707 | 53.3% | 3,175 | 1.2% | 70 |
| Winneshiek | 49.6% | 5,354 | 49.4% | 5,324 | 1.0% | 106 |
| Woodbury | 48.5% | 21,455 | 50.8% | 22,451 | 0.7% | 289 |
| Worth | 55.4% | 2,286 | 43.5% | 1,795 | 1.0% | 42 |
| Wright | 44.4% | 2,930 | 55.0% | 3,631 | 0.6% | 42 |
Counties that flipped from Democratic to Republican[]
- Cedar (largest city: Tipton)
- Greene (largest city: Jefferson)
- Louisa (largest city: Wapello)
- Winnebago (largest city: Forest City)
Counties that flipped from Republican to Democratic[]
- Fayette (largest city: Oelwein)
- Jasper (largest city: Newton)
- Jefferson (largest city: Fairfield)
- Poweshiek (largest city: Grinnell)
- Winneshiek (largest city: Decorah)
By congressional district[]
Bush won 3 of 5 congressional districts, including one – the 3rd district – held by a Democrat. Kerry won two. Interestingly, the two carried by Kerry were held by Republicans in Congress.[14]
| District | Bush | Kerry | Representative |
|---|---|---|---|
| 1st | 46% | 53% | Jim Nussle |
| 2nd | 44% | 55% | Jim Leach |
| 3rd | 50% | 50% | Leonard Boswell |
| 4th | 51% | 48% | Tom Latham |
| 5th | 60% | 39% | Steve King |
Electors[]
Iowa voters cast their ballots for electors: representatives to the Electoral College. Iowa has 7 electors because it has 5 congressional districts and 2 senators. All candidates who appear on the ballot or qualify to receive write-in votes must submit a list of 7 electors, who pledge to vote for their candidate and their running mate. Whoever wins the majority of votes in the state is awarded all 7 electoral votes. Their chosen electors then vote for president and vice president. Although electors are pledged to their candidate and running mate, they are not obligated to vote for them. An elector who votes for someone other than his or her candidate is known as a faithless elector.
The electors of each state and the District of Columbia met on December 13, 2004, to cast their votes for president and vice president. The Electoral College itself never meets as one body. Instead the electors from each state and the District of Columbia meet in their respective capitols.
The following were the members of the Electoral College from Iowa. All were pledged to and voted for Bush and Cheney.[15]
- Julie Hosch
- Velma Huebner
- Don Racheter
- Marilyn Bose
- Don Kass
- Dorothy Schlitter
- Wanda Sears
See also[]
References[]
- ^ http://www.dcpoliticalreport.com/members/2004/Pred2.htm#NW[permanent dead link]
- ^ http://uselectionatlas.org/USPRESIDENT/GENERAL/CAMPAIGN/2004/polls.php?fips=19
- ^ "RealClear Politics - Polls".
- ^ "George W Bush - $374,659,453 raised, '04 election cycle, Republican Party, President".
- ^ "John F Kerry - $345,826,176 raised, '04 election cycle, Democrat Party, President".
- ^ "CNN.com Specials". CNN.
- ^ "CNN.com Specials". CNN.
- ^ Lounsbury, Jud (December 16, 2016). "Pssst...Trump: You Won By Running to Clinton's Left". Progressive.org. Retrieved November 30, 2020.
- ^ "Presidential Results by Congressional District, 2000-2008 – Swing State Project". Retrieved November 22, 2020.
- ^ Lewis, Jeffrey B.; DeVine, Brandon; Martis, Kenneth C.; Pritcher, Lincoln (2013). "Digital Boundary Definitions of United States Congressional Districts, 1789-2012". University of California at Los Angeles. Retrieved November 22, 2020.
- ^ "Dave Leip's Atlas of U.S. Presidential Elections".
- ^ "2000 Presidential General Election Results - Iowa". Dave Leip's Election Atlas. Retrieved November 22, 2020.
- ^ "Iowa Election 2004 Results, News and Polls for the Senate race. View the latest election results, news and polls. Conservative election commentary". Townhall. Retrieved November 22, 2020.
- ^ "Presidential Results by Congressional District, 2000-2008 – Swing State Project". Retrieved November 22, 2020.
- ^ "The Electoral College". May 20, 2019.
- "Canvass Summary: Official Results". State of Iowa. December 6, 2004. Archived from the original (PDF) on November 13, 2007. Retrieved January 20, 2009.
- "Turnout Statistics" (PDF). State of Iowa. December 6, 2004. Retrieved January 20, 2009.
State and district results of the 2004 United States presidential election | ||
|---|---|---|
| 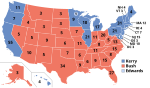 | |
- 2004 United States presidential election by state
- United States presidential elections in Iowa
- 2004 Iowa elections