Iowa's 5th congressional district

Iowa's 5th congressional district is an obsolete congressional district in the U.S. state of Iowa. It was last represented by Republican Steve King, who continued to serve in the United States House of Representative after the district's obsolescence as a representative of Iowa's 4th congressional district.
The district became obsolete for the 113th Congress in 2013 as Iowa lost a seat in the U.S. House of Representatives as a result of redistricting based upon the 2010 Census. Official redistricting maps divided the territory in this district in half, attaching the northern half to the 4th district and the southern half to the 3rd district.
History[]

Iowa's 5th congressional district was redistricted in 1942. U.S. Representative Karl M. LeCompte became the representative of Iowa's 4th congressional district, and U.S. Representative Paul H. Cunningham was the representative from Iowa's 6th congressional district.[citation needed]
Iowa's 5th congressional district was also redistricted in 1972. U.S. Representative Neal Smith was taken out of Iowa's 5th congressional district and put in the 4th congressional district. U.S. Representative William J. Scherle was taken out of Iowa's 7th congressional district (which was permanently removed) and put into the 5th congressional district where he ran against future U.S. Senator Tom Harkin.
On June 22, 2001, the Iowa General Assembly passed a plan to redistrict the state of Iowa. The plan went into effect in 2002 for the 108th U.S. Congress. The prior redistricting plan was effective from 1992–2001.[1]
Presidential election results[]
Election results from presidential races:
| Year | Office | Results |
|---|---|---|
| 2000 | President | George W. Bush 57% – Al Gore 40% |
| 2004 | President | George W. Bush 60% – John Kerry 39% |
| 2008 | President | John McCain 54% – Barack Obama 44% |
List of members representing the district[]
| Member | Party | Term | Cong ress |
Electoral history |
|---|---|---|---|---|
| District created March 4, 1863 | ||||
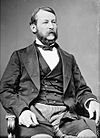 John A. Kasson |
Republican | March 4, 1863 – March 3, 1867 |
38th 39th |
Elected in 1862. Re-elected in 1864. Lost renomination. |
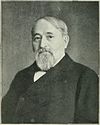
 Grenville M. Dodge |
Republican | March 4, 1867 – March 3, 1869 |
40th | Elected in 1866. Retired. |
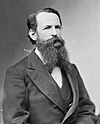
 Francis W. Palmer |
Republican | March 4, 1869 – March 3, 1873 |
41st 42nd |
Elected in 1868. Re-elected in 1870. Retired. |
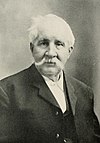
 James Wilson |
Republican | March 4, 1873 – March 3, 1877 |
43rd 44th |
Elected in 1872. Re-elected in 1874. Retired. |
 Rush Clark |
Republican | March 4, 1877 – April 29, 1879 |
45th 46th |
Elected in 1876. Re-elected in 1878. Died. |
| Vacant | April 29, 1879 – December 1, 1879 |
46th | ||
 William G. Thompson |
Republican | December 1, 1879 – March 3, 1883 |
46th 47th |
Elected to finish Clark's term. Re-elected in 1880. Retired. |
James Wilson |
Republican | March 4, 1883 – March 3, 1885 |
48th | Elected in 1882. Retired but lost contested election before end of term.[a] |
 Benjamin T. Frederick |
Democratic | March 4, 1885 – March 3, 1887 |
49th | Won contested election.[a] Re-elected in 1884. Lost re-election. |
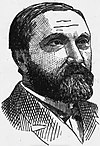
 Daniel Kerr |
Republican | March 4, 1887 – March 3, 1891 |
50th 51st |
Elected in 1886. Re-elected in 1888. Retired. |
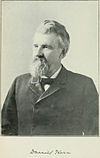
 John T. Hamilton |
Democratic | March 3, 1891 – March 3, 1893 |
52nd | Elected in 1890. Lost re-election. |
 Robert G. Cousins |
Republican | March 4, 1893 – March 3, 1909 |
53rd 54th 55th 56th 57th 58th 59th 60th |
Elected in 1892. Re-elected in 1894. Re-elected in 1896. Re-elected in 1898. Re-elected in 1900. Re-elected in 1902. Re-elected in 1904. Re-elected in 1906. Retired. |
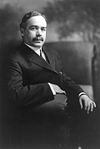 James W. Good |
Republican | March 4, 1909 – June 15, 1921 |
61st 62nd 63rd 64th 65th 66th 67th |
Elected in 1908. Re-elected in 1910. Re-elected in 1912. Re-elected in 1914. Re-elected in 1916. Re-elected in 1918. Re-elected in 1920. Resigned. |
| Vacant | June 15, 1921 – July 19, 1921 |
67th | ||
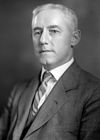
 Cyrenus Cole |
Republican | August 1, 1921 – March 3, 1933 |
67th 68th 69th 70th 71st 72nd |
Elected to finish Good's term. Re-elected in 1922. Re-elected in 1924. Re-elected in 1926. Re-elected in 1928. Re-elected in 1930. Redistricted to 2nd district but retired. |
 Lloyd Thurston |
Republican | March 4, 1933 – January 3, 1939 |
73rd 74th 75th |
Redistricted from the 8th district and re-elected in 1932. Re-elected in 1934. Re-elected in 1936. Retired to run for U.S. senator. |
 Karl M. LeCompte |
Republican | January 3, 1939 – January 3, 1943 |
76th 77th |
Elected in 1938. Re-elected in 1940. Redistricted to the 4th district. |
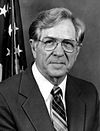
 Paul Cunningham |
Republican | January 3, 1943 – January 3, 1959 |
78th 79th 80th 81st 82nd 83rd 84th 85th |
Redistricted from the 6th district and re-elected in 1942. Re-elected in 1944. Re-elected in 1946. Re-elected in 1948. Re-elected in 1950. Re-elected in 1952. Re-elected in 1954. Re-elected in 1956. Lost re-election. |
 Neal E. Smith |
Democratic | January 3, 1959 – January 3, 1973 |
86th 87th 88th 89th 90th 91st 92nd |
Elected in 1958. Re-elected in 1960. Re-elected in 1962. Re-elected in 1964. Re-elected in 1966. Re-elected in 1968. Re-elected in 1970. Redistricted to the 4th district. |
 William J. Scherle |
Republican | January 3, 1973 – January 3, 1975 |
93rd | Redistricted from the 7th district and re-elected in 1972. Lost re-election. |
 Tom Harkin |
Democratic | January 3, 1975 – January 3, 1985 |
94th 95th 96th 97th 98th |
Elected in 1974. Re-elected in 1976. Re-elected in 1978. Re-elected in 1980. Re-elected in 1982. Retired to run for U.S. senator. |
 Jim R. Lightfoot |
Republican | January 3, 1985 – January 3, 1993 |
99th 100th 101st 102nd |
Elected in 1984. Re-elected in 1986. Re-elected in 1988. Re-elected in 1990. Redistricted to the 3rd district. |
 Fred Grandy |
Republican | January 3, 1993 – January 3, 1995 |
103rd | Redistricted from the 6th district and re-elected in 1992. Retired to run for governor. |
 Tom Latham |
Republican | January 3, 1995 – January 3, 2003 |
104th 105th 106th 107th |
Elected in 1994. Re-elected in 1996. Re-elected in 1998. Re-elected in 2000. Redistricted to the 4th district. |
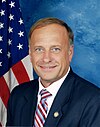 Steve King |
Republican | January 3, 2003 – January 3, 2013 |
108th 109th 110th 111th 112th |
Elected in 2002. Re-elected in 2004. Re-elected in 2006. Re-elected in 2008. Re-elected in 2010. Redistricted to the 4th district. |
| District eliminated January 3, 2013 | ||||
- ^ Jump up to: a b The resolution of the contest was delayed until the final hours of the Forty-eighth Congress, so Frederick was not declared winner until March 4, 1885.
Historical election results[]
| Year[2]
|
Party affiliation | Winner | Number of votes | Party affiliation | Loser | Number of votes | Percentage of votes |
|---|---|---|---|---|---|---|---|
| 1920 | Republican | James W. Good | 58,197 | N/A | N/A | 0 | 100% - 0% |
| 1922 | Republican | Cyrenus Cole | 32,586 | Democrat | 24,532 | 57% - 43% | |
| 1924 | Republican | Cyrenus Cole | 52,237 | Democrat | 22,175 | 70% - 30% | |
| 1926 | Republican | Cyrenus Cole | 31,253 | Democrat | 12,263 | 72% - 28% | |
| 1928 | Republican | Cyrenus Cole | 54,703 | Democrat | 27,893 | 66% - 34% | |
| 1930 | Republican | Cyrenus Cole | 23,221 | Democrat | 19,931 | 54% - 46% | |
| 1932 | Republican | Lloyd Thurston | 51,909 | Democrat | 51,732 | 50.1% - 49.9% | |
| 1934 | Republican | Lloyd Thurston | 54,699 | Democrat | 48,949 | 52% - 47% | |
| 1936 | Republican | Lloyd Thurston | 63,802 | Democrat | 59,971 | 51% - 48% | |
| 1938 | Republican | Karl M. LeCompte | 50,860 | Democrat | 43,452 | 54% - 46% | |
| 1940 | Republican | Karl M. LeCompte | 66,940 | Democrat | 58,718 | 54% - 46% | |
| 1942 | Republican | Paul H. Cunningham | 48,578 | Democrat | 28,287 | 63% - 37% | |
| 1944 | Republican | Paul H. Cunningham | 66,260 | Democrat | 56,138 | 54% - 46% | |
| 1946 | Republican | Paul H. Cunningham | 41,679 | Democrat | 28,490 | 59% - 41% | |
| 1948 | Republican | Paul H. Cunningham | 60,103 | Democrat | William F. Martin | 57,370 | 51% - 48% |
| 1950 | Republican | Paul H. Cunningham | 57,429 | Democrat | 43,105 | 57% - 43% | |
| 1952 | Republican | Paul H. Cunningham | 95,057 | Democrat | 66,303 | 59% - 41% | |
| 1954 | Republican | Paul H. Cunningham | 61,355 | Democrat | 49,063 | 56% - 44% | |
| 1956 | Republican | Paul H. Cunningham | 85,178 | Democrat | 81,418 | 51% - 49% | |
| 1958 | Democrat | Neal Smith | 61,693 | Republican | Paul H. Cunningham | 56,320 | 52% - 48% |
| 1960 | Democrat | Neal Smith | 91,808 | Republican | 81,474 | 53% - 47% | |
| 1962 | Democrat | Neal Smith | 73,963 | Republican | 43,877 | 63% - 37% | |
| 1964 | Democrat | Neal Smith | 108,212 | Republican | 46,160 | 70% - 30% | |
| 1966 | Democrat | Neal Smith | 72,875 | Republican | 46,981 | 60% - 39% | |
| 1968 | Democrat | Neal Smith | 99,586 | Republican | 60,710 | 62% - 38% | |
| 1970 | Democrat | Neal Smith | 73,820 | Republican | 37,374 | 65% - 33% | |
| 1972 | Republican | William J. Scherle | 108,596 | Democrat | Tom Harkin | 87,937 | 55% - 45% |
| 1974 | Democrat | Tom Harkin | 81,146 | Republican | William J. Scherle | 77,683 | 51% - 49% |
| 1976 | Democrat | Tom Harkin | 135,600 | Republican | 71,377 | 65% - 34% | |
| 1978 | Democrat | Tom Harkin | 82,333 | Republican | 57,377 | 59% - 41% | |
| 1980 | Democrat | Tom Harkin | 127,895 | Republican | 84,472 | 60% - 40% | |
| 1982 | Democrat | Tom Harkin | 93,333 | Republican | Arlyn E. Danker | 65,200 | 59% - 41% |
| 1984 | Republican | Jim Ross Lightfoot | 104,632 | Democrat | 101,435 | 51% - 49% | |
| 1986 | Republican | Jim Ross Lightfoot | 85,025 | Democrat | 58,552 | 59% - 40% | |
| 1988 | Republican | Jim Ross Lightfoot | 117,761 | Democrat | 66,599 | 64% - 36% | |
| 1990 | Republican | Jim Ross Lightfoot | 99,978 | Democrat | 47,022 | 68% - 32% | |
| 1992 | Republican | Fred Grandy | 196,942 | N/A | N/A | 1,424 | 99% - 1% |
| 1994 | Republican | Tom Latham | 114,796 | Democrat | 73,627 | 61% - 39% | |
| 1996 | Republican | Tom Latham | 147,576 | Democrat | 75,785 | 65% - 34% | |
| 1998 | Republican | Tom Latham | 132,730 | N/A | N/A | 1,041 | 99% - 1% |
| 2000 | Republican | Tom Latham | 159,367 | Democrat | 67,593 | 69% - 29% | |
| 2002 | Republican | Steve King | 113,257 | Democrat | Paul Shomshor | 68,853 | 62% - 38% |
| 2004 | Republican | Steve King | 168,583 | Democrat | 97,597 | 63% - 37% | |
| 2006 | Republican | Steve King | 105,245 | Democrat | 64,004 | 59% - 36% | |
| 2008[3] | Republican | Steve King | 159,430 | Democrat | 99,601 | 60% - 37% | |
| 2010[4] | Republican | Steve King | 128,363 | Democrat | Matthew Campbell | 63,160 | 66% - 32% |
Recent election results[]
2002[]
| Party | Candidate | Votes | % | |
|---|---|---|---|---|
| Republican | Steve King | 113,257 | 62.15 | |
| Democratic | Paul Shomshor | 68,853 | 37.78 | |
| No party | Others | 127 | 0.07 | |
| Total votes | 182,237 | 100.00 | ||
| Turnout | ||||
| Republican hold | ||||
2004[]
| Party | Candidate | Votes | % | |
|---|---|---|---|---|
| Republican | Steve King* | 168,593 | 63.30 | |
| Democratic | Joyce Schulte | 97,597 | 36.64 | |
| No party | Others | 161 | 0.06 | |
| Total votes | 266,351 | 100.00 | ||
| Turnout | ||||
| Republican hold | ||||
2006[]
| Party | Candidate | Votes | % | |
|---|---|---|---|---|
| Republican | Steve King* | 121,650 | 58.50 | |
| Democratic | Joyce Schulte | 64,181 | 35.56 | |
| Independent | Roy Nielsen | 8,159 | 4.52 | |
| Independent | Cheryl Broderson | 2,479 | 1.37 | |
| No party | Others | 65 | 0.04 | |
| Total votes | 196,534 | 100.00 | ||
| Turnout | ||||
| Republican hold | ||||
2008[]
| Party | Candidate | Votes | % | |
|---|---|---|---|---|
| Republican | Steve King* | 159,430 | 59.80 | |
| Democratic | Rob Hubler | 99,601 | 37.36 | |
| Independent | Victor Vara | 7,406 | 2.78 | |
| No party | Others | 180 | 0.07 | |
| Total votes | 266,617 | 100.00 | ||
| Turnout | ||||
| Republican hold | ||||
2010[]
| Party | Candidate | Votes | % | |
|---|---|---|---|---|
| Republican | Steve King* | 128,363 | 65.75 | |
| Democratic | Matthew Campbell | 63,160 | 32.35 | |
| Independent | Martin James Monroe | 3,622 | 1.86 | |
| No party | Others | 94 | 0.05 | |
| Total votes | 195,239 | 100.00 | ||
| Turnout | ||||
| Republican hold | ||||
See also[]
References[]
- ^ "2001 Iowa Redistricting Plan,". 2001. Archived from the original on 2006-10-16. Retrieved 2006-11-10.
- ^ "Election Statistics,". 2005. Archived from the original on 2007-07-25.
- ^ "Archived copy". Archived from the original on 2009-04-08. Retrieved 2009-02-10.CS1 maint: archived copy as title (link)
- ^ http://www.sos.state.ia.us/pdfs/elections/2010/usreporr.pdf
External links[]
- Martis, Kenneth C. (1989). The Historical Atlas of Political Parties in the United States Congress. New York: Macmillan Publishing Company.
- Martis, Kenneth C. (1982). The Historical Atlas of United States Congressional Districts. New York: Macmillan Publishing Company.
- Congressional Biographical Directory of the United States 1774–present

- Congressional districts of Iowa
- Obsolete United States congressional districts
- 1863 establishments in Iowa
- 2013 disestablishments in Iowa