Iowa's 3rd congressional district
| Iowa's 3rd congressional district | |||
|---|---|---|---|
 Iowa's 3rd congressional district since January 3, 2013 | |||
| Representative |
| ||
| Distribution |
| ||
| Population (2019) | 848,170 | ||
| Median household income | $67,681[1] | ||
| Ethnicity |
| ||
| Cook PVI | R+3[2] | ||
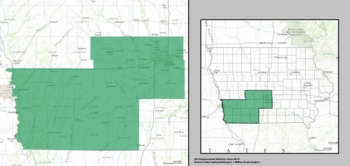
Iowa's 3rd congressional district is a congressional district in the U.S. state of Iowa that covers its southwest quadrant, roughly an area including Des Moines to the borders with Nebraska and Missouri.
From 2003 to 2013, it encompassed Des Moines (on the western end), to the western outskirts of the metropolitan area of Cedar Falls and Waterloo (on the northeastern end), to the western outskirts of the Cedar Rapids area (on the eastern end), and to Lucas County and Monroe County (on the southern end).
The district has been represented in the United States House of Representatives by Democrat Cindy Axne since 2019. As of 2022, it is one of seven districts that voted for Donald Trump in the 2020 presidential election, while being won by a Democrat. With a Cook Partisan Voting Index rating of R+3, it is the least Republican district in Iowa.[2]
Statewide races since 2000[]
Election results from statewide races:
| Office | Year | District | Statewide | Nationwide |
|---|---|---|---|---|
| President | 2000 | Al Gore 49% – George W. Bush 48% | Gore | Bush |
| 2004 | George W. Bush 50% – John Kerry 50% | Bush | ||
| 2008 | Barack Obama 54% – John McCain 44% | Obama | Obama | |
| 2012 | Barack Obama 51% – Mitt Romney 47% | |||
| 2016 | Donald Trump 48% – Hillary Clinton 45% | Trump | Trump | |
| 2020 | Donald Trump 49.1% – Joe Biden 49.0% | Biden |
List of members representing the district[]
| Representative | Party | Years | Cong ress |
Electoral history |
|---|---|---|---|---|
| District created March 4, 1863 | ||||
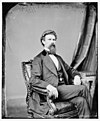
 William B. Allison |
Republican | March 4, 1863 – March 3, 1871 |
38th 39th 40th 41st |
Elected in 1862. Re-elected in 1864. Re-elected in 1866. Re-elected in 1868. Retired to run for U.S. senator. |
 William G. Donnan |
Republican | March 4, 1871 – March 3, 1875 |
42nd 43rd |
Elected in 1870. Re-elected in 1872. Retired. |
 Lucien L. Ainsworth |
Democratic | March 4, 1875 – March 3, 1877 |
44th | Elected in 1874. Retired. |
 Theodore W. Burdick |
Republican | March 4, 1877 – March 3, 1879 |
45th | Elected in 1876. Retired. |
 Thomas Updegraff |
Republican | March 4, 1879 – March 3, 1883 |
46th 47th |
Elected in 1878. Re-elected in 1880. Redistricted to the 4th district and lost re-election. |
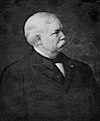 David B. Henderson |
Republican | March 4, 1883 – March 3, 1903 |
48th 49th 50th 51st 52nd 53rd 54th 55th 56th 57th |
Elected in 1882. Re-elected in 1884. Re-elected in 1886. Re-elected in 1888. Re-elected in 1890. Re-elected in 1892. Re-elected in 1894. Re-elected in 1896. Re-elected in 1898. Re-elected in 1900. Renominated but withdrew prior to election. |
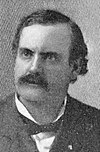 Benjamin P. Birdsall |
Republican | March 4, 1903 – March 3, 1909 |
58th 59th 60th |
Elected in 1902. Re-elected in 1904. Re-elected in 1906. Retired. |
 Charles E. Pickett |
Republican | March 4, 1909 – March 3, 1913 |
61st 62nd |
Elected in 1908. Re-elected in 1910. Lost re-election. |
 Maurice Connolly |
Democratic | March 4, 1913 – March 3, 1915 |
63rd | Elected in 1912. Retired to run for U.S. senator. |
 Burton E. Sweet |
Republican | March 4, 1915 – March 3, 1923 |
64th 65th 66th 67th |
Elected in 1914. Re-elected in 1916. Re-elected in 1918. Re-elected in 1920. Retired to run for U.S. senator. |
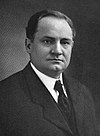
 Thomas J. B. Robinson |
Republican | March 4, 1923 – March 3, 1933 |
68th 69th 70th 71st 72nd |
Elected in 1922. Re-elected in 1924. Re-elected in 1926. Re-elected in 1928. Re-elected in 1930. Lost re-election. |
 Albert C. Willford |
Democratic | March 4, 1933 – January 3, 1935 |
73rd | Elected in 1932. Lost re-election. |
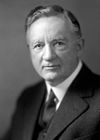
 John W. Gwynne |
Republican | January 3, 1935 – January 3, 1949 |
74th 75th 76th 77th 78th 79th 80th |
Elected in 1934. Re-elected in 1936. Re-elected in 1938. Re-elected in 1940. Re-elected in 1942. Re-elected in 1944. Re-elected in 1946. Lost renomination. |
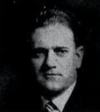
 Harold R. Gross |
Republican | January 3, 1949 – January 3, 1975 |
81st 82nd 83rd 84th 85th 86th 87th 88th 89th 90th 91st 92nd 93rd |
Elected in 1948. Re-elected in 1950. Re-elected in 1952. Re-elected in 1954. Re-elected in 1956. Re-elected in 1958. Re-elected in 1960. Re-elected in 1962. Re-elected in 1964. Re-elected in 1966. Re-elected in 1968. Re-elected in 1970. Re-elected in 1972. Retired. |
 Chuck Grassley |
Republican | January 3, 1975 – January 3, 1981 |
94th 95th 96th |
Elected in 1974. Re-elected in 1976. Re-elected in 1978. Retired to run for U.S. senator. |
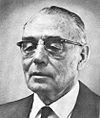
 T. Cooper Evans |
Republican | January 3, 1981 – January 3, 1987 |
97th 98th 99th |
Elected in 1980. Re-elected in 1982. Re-elected in 1984. Retired. |
 David R. Nagle |
Democratic | January 3, 1987 – January 3, 1993 |
100th 101st 102nd |
Elected in 1986. Re-elected in 1988. Re-elected in 1990. Redistricted to the 2nd district and lost re-election. |
 Jim R. Lightfoot |
Republican | January 3, 1993 – January 3, 1997 |
103rd 104th |
Redistricted from the 5th district and re-elected in 1992. Re-elected in 1994. Retired to run for U.S. senator. |
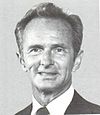
 Leonard Boswell |
Democratic | January 3, 1997 – January 3, 2013 |
105th 106th 107th 108th 109th 110th 111th 112th |
Elected in 1996. Re-elected in 1998. Re-elected in 2000. Re-elected in 2002. Re-elected in 2004. Re-elected in 2006. Re-elected in 2008. Re-elected in 2010. Lost re-election. |
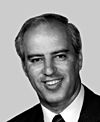
 Tom Latham |
Republican | January 3, 2013 – January 3, 2015 |
113th | Redistricted from the 4th district and re-elected in 2012. Retired. |
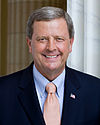
 David Young |
Republican | January 3, 2015 – January 3, 2019 |
114th 115th |
Elected in 2014. Re-elected in 2016. Lost re-election. |
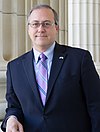
 Cindy Axne |
Democratic | January 3, 2019 – Present |
116th 117th |
Elected in 2018. Re-elected in 2020. |
Recent election results[]
| Year[3] | Winner | Second | Percentage | ||||
|---|---|---|---|---|---|---|---|
| Party affiliation | Candidate | Votes | Party affiliation | Candidate | Votes | ||
| 1920 | Republican | Burton E. Sweet | 67,859 | Farmer–Labor | 1,974 | 97% – 3% | |
| 1922 | Thomas J. B. Robinson | 34,518 | Democratic | 24,304 | 58% – 41% | ||
| 1924 | 54,921 | 25,215 | 69% – 31% | ||||
| 1926 | 32,180 | 13,696 | 70% – 30% | ||||
| 1928 | 60,025 | 38,469 | 61% – 39% | ||||
| 1930 | 27,098 | 15,908 | 63% – 37% | ||||
| 1932 | Democratic | Albert C. Willford | 48,939 | Republican | Thomas J. B. Robinson | 47,776 | 51% – 49% |
| 1934 | Republican | John W. Gwynne | 42,063 | Democratic | Albert C. Willford | 35,159 | 51% – 43% |
| 1936 | 53,928 | 47,391 | 52% – 46% | ||||
| 1938 | 45,541 | 30,158 | 60% – 40% | ||||
| 1940 | 65,425 | 43,709 | 60% – 40% | ||||
| 1942 | 54,124 | 35,065 | 61% – 39% | ||||
| 1944 | 74,901 | 56,985 | 58% – 42% | ||||
| 1946 | 48,346 | 29,661 | 62% – 38% | ||||
| 1948 | H. R. Gross | 78,838 | 56,002 | 58% – 41% | |||
| 1950 | 73,490 | 40,786 | 64% – 36% | ||||
| 1952 | 109,992 | 56,871 | 66% – 34% | ||||
| 1954 | 68,307 | 41,622 | 62% – 38% | ||||
| 1956 | 97,590 | 69,076 | 59% – 41% | ||||
| 1958 | 61,920 | 53,467 | 54% – 46% | ||||
| 1960 | 99,046 | 76,837 | 56% – 44% | ||||
| 1962 | 66,337 | 50,580 | 57% – 43% | ||||
| 1964 | 83,455 | 83,036 | 50.1% – 49.9% | ||||
| 1966 | 79,343 | 48,530 | 62% – 38% | ||||
| 1968 | 101,839 | 57,164 | 64% – 36% | ||||
| 1970 | 66,087 | 45,958 | 59% – 41% | ||||
| 1972 | 109,113 | 86,848 | 56% – 44% | ||||
| 1974 | Chuck Grassley | 77,468 | Stephen Rapp | 74,859 | 51% – 49% | ||
| 1976 | 117,957 | 90,981 | 56% – 44% | ||||
| 1978 | 103,659 | 34,880 | 75% – 25% | ||||
| 1980 | T. Cooper Evans | 107,869 | 101,735 | 51% – 48% | |||
| 1982 | 104,072 | 83,581 | 55% – 45% | ||||
| 1984 | 133,737 | Joe Johnston | 86,574 | 61% – 39% | |||
| 1986 | Democratic | David R. Nagle | 83,504 | Republican | 69,386 | 55% – 45% | |
| 1988 | 129,204 | 74,682 | 63% – 37% | ||||
| 1990 | 100,947 | unopposed | 833 | 99% – 1% | |||
| 1992 | Republican | Jim Ross Lightfoot | 125,931 | Democratic | Elaine Baxter | 121,063 | 49% – 47% |
| 1994 | 111,862 | 79,310 | 58% – 41% | ||||
| 1996 | Democratic | Leonard Boswell | 115,914 | Republican | Mike Mahaffey | 111,895 | 49% – 48% |
| 1998 | 107,947 | Larry McKibben | 78,063 | 57% – 41% | |||
| 2000 | 156,327 | 83,810 | 63% – 34% | ||||
| 2002 | 115,367 | Stan Thompson | 97,285 | 53% – 45% | |||
| 2004 | 168,007 | 136,099 | 55% – 45% | ||||
| 2006 | 114,689 | Jeff Lamberti | 103,182 | 52% – 47% | |||
| 2008 | 175,423 | 131,524 | 56% – 42% | ||||
| 2010 | 122,147 | Brad Zaun | 111,925 | 50% – 46% | |||
| 2012 | Republican | Tom Latham | 202,000 | Democratic | Leonard Boswell | 168,632 | 51% – 42% |
| 2014 | David Young | 148,814 | Staci Appel | 119,109 | 52% – 42% | ||
| 2016 | 208,598 | Jim Mowrer | 155,002 | 53% – 40% | |||
| 2018 | Democratic | Cindy Axne | 169,888 | Republican | David Young | 164,667 | 49% – 47% |
| 2020 | Democratic | Cindy Axne | 219,205 | Republican | David Young | 212,997 | 49% – 48% |
2002[]
| Party | Candidate | Votes | % | |
|---|---|---|---|---|
| Democratic | Leonard Boswell* | 115,367 | 53.41 | |
| Republican | Stan Thompson | 97,285 | 45.04 | |
| Libertarian | Jeffrey J. Smith | 2,689 | 1.25 | |
| Socialist Workers | Edwin B. Fruit | 569 | 0.26 | |
| No party | Others | 75 | 0.04 | |
| Total votes | 215,985 | 100.00 | ||
| Turnout | ||||
| Democratic hold | ||||
2004[]
| Party | Candidate | Votes | % | |
|---|---|---|---|---|
| Democratic | Leonard Boswell* | 168,007 | 55.21 | |
| Republican | Stan Thompson | 136,009 | 44.72 | |
| No party | Others | 213 | 0.07 | |
| Total votes | 304,229 | 100.00 | ||
| Turnout | ||||
| Democratic hold | ||||
2006[]
| Party | Candidate | Votes | % | |
|---|---|---|---|---|
| Democratic | Leonard Boswell* | 115,769 | 51.85 | |
| Republican | Jeff Lamberti | 103,722 | 46.45 | |
| Socialist Workers | Helen Meyers | 3,591 | 1.61 | |
| No party | Others | 205 | 0.09 | |
| Total votes | 223,287 | 100.00 | ||
| Turnout | ||||
| Democratic hold | ||||
2008[]
| Party | Candidate | Votes | % | |
|---|---|---|---|---|
| Democratic | Leonard Boswell* | 176,904 | 56.31 | |
| Republican | 132,136 | 42.06 | ||
| Socialist Workers | Frank Forrestal | 4,599 | 1.46 | |
| No party | Others | 521 | 0.17 | |
| Total votes | 314,160 | 100.00 | ||
| Turnout | ||||
| Democratic hold | ||||
2010[]
| Party | Candidate | Votes | % | |
|---|---|---|---|---|
| Democratic | Leonard Boswell* | 122,147 | 50.73 | |
| Republican | Brad Zaun | 111,925 | 46.49 | |
| Socialist Workers | Rebecca Williamson | 6,258 | 2.60 | |
| No party | Others | 426 | 0.18 | |
| Total votes | 240,756 | 100.00 | ||
| Turnout | ||||
| Democratic hold | ||||
2012[]
| Party | Candidate | Votes | % | |||
|---|---|---|---|---|---|---|
| Republican | Tom Latham* | 202,000 | 50.56 | |||
| Democratic | Leonard Boswell* | 168,632 | 42.20 | |||
| Independent | Scott G. Batcher | 9,352 | 2.34 | |||
| Socialist Workers | David Rosenfeld | 6,286 | 1.57 | |||
| No party | Others | 572 | 0.14 | |||
| Total votes | 399,561 | 100.00 | ||||
| Turnout | ||||||
| Republican gain from Democratic | ||||||
2014[]
| Party | Candidate | Votes | % | |
|---|---|---|---|---|
| Republican | David Young | 148,814 | 52.8 | |
| Democratic | Staci Appel | 119,109 | 42.2 | |
| Libertarian | Edward Wright | 9,054 | 3.2 | |
| No party preference | Bryan Jack Holder | 4,360 | 1.5 | |
| Write-ins | 729 | 0.3 | ||
| Total votes | 282,066 | 100 | ||
| Republican hold | ||||
2016[]

| Party | Candidate | Votes | % | |
|---|---|---|---|---|
| Republican | David Young* | 208,598 | 53.45 | |
| Democratic | Jim Mowrer | 155,002 | 39.71 | |
| Libertarian | Bryan Jack Holder | 15,372 | 3.94 | |
| Nominated by Petition | Claudia Addy | 6,348 | 1.63 | |
| Nominated by Petition | Joe Grandanette | 4,518 | 1.16 | |
| Write-ins | 449 | 0.12 | ||
| Total votes | 390,287 | 100.00 | ||
| Republican hold | ||||
2018[]
| Party | Candidate | Votes | % | ±% | |
|---|---|---|---|---|---|
| Democratic | Cindy Axne | 169,888 | 49.0 | +9.29 | |
| Republican | David Young* | 164,667 | 47.49 | -5.96 | |
| Libertarian | Bryan Jack Holder | 7,005 | 2.02 | −1.92 | |
| Legal Marijuana Now | Mark Elworth, Jr. | 1,906 | 0.55 | +0.55 | |
| Green | Paul Knupp | 1,795 | 0.52 | +0.52 | |
| Independent | Joe Grandanette | 1,271 | 0.37 | −0.79 | |
| Write-ins | 178 | 0.05 | +0.00 | ||
| Plurality | 5,221 | 1.51 | |||
| Turnout | 346,710 | 100 | |||
| Democratic gain from Republican | Swing | +15.25 | |||
2020[]
| Party | Candidate | Votes | % | |
|---|---|---|---|---|
| Democratic | Cindy Axne (incumbent) | 219,205 | 48.9 | |
| Republican | David Young | 212,997 | 47.6 | |
| Libertarian | Bryan Jack Holder | 15,361 | 3.4 | |
| Write-in | 384 | 0.1 | ||
| Total votes | 447,947 | 100.0 | ||
| Democratic hold | ||||
Historical district boundaries[]

See also[]
References[]
- General
- ^ "My Congressional District".
- ^ a b "Introducing the 2021 Cook Political Report Partisan Voter Index". The Cook Political Report. April 15, 2021. Retrieved April 15, 2021.
- ^ "Election Statistics". 2005. Archived from the original on July 25, 2007.
- ^ "Iowa General Election 2018". Iowa Secretary of State. Retrieved November 11, 2018.
- ^ "General Election - 2020 Canvass Summary" (PDF). Iowa Secretary of State.
- Specific
- Martis, Kenneth C. (1989). The Historical Atlas of Political Parties in the United States Congress. New York: Macmillan Publishing Company.
- Martis, Kenneth C. (1982). The Historical Atlas of United States Congressional Districts. New York: Macmillan Publishing Company.
- Congressional Biographical Directory of the United States 1774–present
Coordinates: 41°12′34″N 94°38′25″W / 41.20944°N 94.64028°W

- Congressional districts of Iowa