2004 United States presidential election in New York
| |||||||||||||||||||||||||||||
| Turnout | 62.44% | ||||||||||||||||||||||||||||
|---|---|---|---|---|---|---|---|---|---|---|---|---|---|---|---|---|---|---|---|---|---|---|---|---|---|---|---|---|---|
| |||||||||||||||||||||||||||||
 County Results
| |||||||||||||||||||||||||||||
| |||||||||||||||||||||||||||||
| Elections in New York State |
|---|
 |
The 2004 United States presidential election in New York took place on November 2, 2004, and was part of the 2004 United States presidential election. Voters chose 31 representatives, or electors to the Electoral College, who voted for president and vice president.
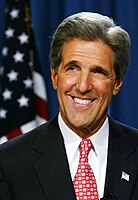
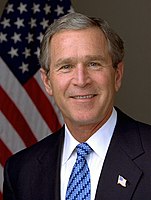
New York was won by Democratic nominee John Kerry with an 18.3% margin of victory. Kerry took 58.37% of the vote to Bush's 40.08%. Prior to the election, all 12 news organizations considered this a state Kerry would win, or otherwise considered as a safe blue state. The last Republican presidential nominee to have carried the state of New York was Ronald Reagan in 1984 and the last one to even be competitive was Bush's father George H. W. Bush in 1988. Despite being a "safe blue state", this was the best showing for a Republican candidate in a presidential election in New York since 1988 and a significant improvement over Bush's performance in 2000; this is often attributed to increased support for President Bush after the 9/11 attacks. However, New York also had Kerry's fourth largest margin of victory after Kerry's home state of Massachusetts, and neighboring Rhode Island and Vermont. New York was one of just seven states that Kerry won by double digits, the others being neighboring Connecticut, Rhode Island, Massachusetts, Vermont, Maryland and Illinois.
As of the 2020 United States presidential election, this is the last election in which the Republican candidate both received over 40% of the vote, and lost by less than a 20% margin in New York or Westchester County, and carried Rockland and Dutchess counties. This is also the last time that any candidate won a majority of the vote in Ontario County.
Primaries[]
- 2004 New York Democratic presidential primary
Campaign[]
Predictions[]
There were 12 news organizations who made state-by-state predictions of the election. Here are their last predictions before election day.[1]
- D.C. Political Report: Solid Democrat
- Associated Press: Solid Kerry
- CNN: Kerry
- Cook Political Report: Solid Democrat
- Newsweek: Solid Kerry
- New York Times: Solid Kerry
- Rasmussen Reports: Kerry
- Research 2000: Solid Kerry
- Washington Post: Kerry
- Washington Times: Solid Kerry
- Zogby International: Kerry
- Washington Dispatch: Kerry
Polling[]
Kerry won every single pre-election poll, and all but one with a double-digit margin and with at least 49%. The final 3-poll average showed Kerry leading 55% to 38%.[2]
Fundraising[]
Bush raised $11,994,227.[3] Kerry raised $27,733,309.[4]
Advertising and visits[]
Neither campaign advertised or visited the state during the fall campaign.[5][6]
Geographic analysis[]
The voters of the five boroughs of New York City were the main force responsible for Kerry's decisive victory in the state. Kerry won New York City by an overwhelming margin, taking 1,828,015 votes to Bush's 587,534, a 74.99% to 24.10% victory. Excluding New York City's votes, John Kerry still would have carried New York State, but by a reduced margin, taking 2,486,265 votes to Bush's 2,375,033 votes, a 51.14% - 48.86% victory.
The New York City suburbs consist of Long Island's Nassau and Suffolk counties as well as Westchester and Rockland counties. Traditionally Republican, this area went clearly Democratic through the past few decades, with the arrival of people from New York City. However, in this area where many voters commute to Manhattan, Bush did better than expected. Although he clearly lost these counties to Gore in 2000 with 39.55% to 56.42%, or 655,665 votes to 935,456, he only lost them by a close 46.13% to 52.30% to Kerry. While Bush won 167,397 more votes than in 2000, Kerry lost 2,437. This can be mainly explained by the concerns of suburban moderate voters about terrorism, an issue about which they trusted Bush more than Kerry. Exit polls showed 49% of voters in New York trusted Bush to handle terrorism, as opposed to 42% for Kerry. [7]
Upstate New York region, including all of the counties that are not part of New York City or its suburbs, is the least liberal region of the three. Its politics are very similar to those of Ohio or Pennsylvania, both key swing states and sharing conservative rural areas. Bush expanded his margin in New York City's northern exurban counties Dutchess, Orange and Putnam from 2000. Despite this, Senator Kerry still managed a slim victory in Upstate New York, with 1,553,246 votes to 1,551,971 for Bush. This was largely due to a Democratic tidal wave in the region's four largest cities--Buffalo, Rochester, Syracuse and Albany. Kerry also ran strongly in college dominated Tompkins County and two counties with an influx of former New York City residents moving to vacation homes, Ulster County and Columbia County.
According to exit polls, Senator Kerry won both males (56%-42%) and Females (60%-40%) over the president. [8] President Bush narrowly carried white voters in New York 50% to 49%.[9] This was not enough to overcome Senator Kerry carrying African Americans 90% to 9%, Latinos 75% to 24% and Asians 72% to 27%. [10] Kerry won all age groups over President Bush, with his closest wins being 52% to 47% among those aged 45-59 and 53% to 47% among those 60 and older. [11] Kerry also won all income groups and all levels of education.[12]
Results[]
| 2004 United States presidential election in New York[13] | ||||||
|---|---|---|---|---|---|---|
| Party | Candidate | Popular votes | Percentage | Electoral votes | ||
| Democratic | John Kerry | 4,180,755 | 56.57% | |||
| Working Families | John Kerry | 133,525 | 1.81% | |||
| Total | John F. Kerry | 4,314,280 | 58.37% | 31 | ||
| Republican | George W. Bush | 2,806,993 | 37.98% | |||
| Conservative | George W. Bush | 155,574 | 2.10% | |||
| Total | George W. Bush (Incumbent) | 2,962,567 | 40.08% | 0 | ||
| Independence | Ralph Nader | 84,247 | 1.14% | |||
| Peace and Justice | Ralph Nader | 15,626 | 0.21% | |||
| Total | Ralph Nader | 99,873 | 1.35% | 0 | ||
| Libertarian | Michael Badnarik | 11,607 | 0.16% | 0 | ||
| Socialist Workers | Roger Calero | 2,405 | 0.03% | 0 | ||
| Constitution (Write-In) | Michael Peroutka | 363 | >0.01% | 0 | ||
| Green (Write-In) | David Cobb | 138 | >0.01% | 0 | ||
| Independent (Write-In) | John J. Kennedy | 8 | >0.01% | 0 | ||
| Independent (Write-In) | Michael Halpin | 4 | >0.01% | 0 | ||
| Socialist Equality | Bill Van Auken | 4 | >0.01% | 0 | ||
| Totals | 7,391,036 | 100% | 31 | |||
| Voter turnout: | 62.44% | |||||
Results breakdown[]
By congressional district[]
Kerry won 20 of 29 congressional districts.[14]
| District | Bush | Kerry | Representative |
|---|---|---|---|
| 1st | 49% | 49% | Tim Bishop |
| 2nd | 45% | 53% | Steve Israel |
| 3rd | 52% | 47% | Peter T. King |
| 4th | 44% | 55% | Carolyn McCarthy |
| 5th | 36% | 63% | Gary Ackerman |
| 6th | 15% | 84% | Gregory W. Meeks |
| 7th | 25% | 74% | Joseph Crowley |
| 8th | 27% | 72% | Jerrold Nadler |
| 9th | 44% | 56% | Anthony D. Weiner |
| 10th | 13% | 86% | Edolphus Towns |
| 11th | 13% | 86% | Major Owens |
| 12th | 19% | 80% | Nydia Velasquez |
| 13th | 55% | 45% | Vito Fossella |
| 14th | 25% | 75% | Carolyn B. Maloney |
| 15th | 9% | 90% | Charlie Rangel |
| 16th | 10% | 89% | Jose Serrano |
| 17th | 33% | 67% | Eliot L. Engel |
| 18th | 42% | 58% | Nita Lowey |
| 19th | 54% | 45% | Sue W. Kelly |
| 20th | 54% | 46% | John E. Sweeney |
| 21st | 43% | 55% | Michael R. McNulty |
| 22nd | 45% | 54% | Maurice Hinchey |
| 23rd | 51% | 47% | John M. McHugh |
| 24th | 53% | 47% | Sherwood Boehlert |
| 25th | 48% | 50% | James T. Walsh |
| 26th | 55% | 43% | Thomas M. Reynolds |
| 27th | 45% | 53% | Jack Quinn |
| Brian Higgins | |||
| 28th | 36% | 63% | Louise Slaughter |
| 29th | 56% | 42% | Amo Houghton |
| Randy Kuhl |
By county[]
| County | Kerry% | Kerry# | Bush% | Bush# | Others% | Others# | Total |
|---|---|---|---|---|---|---|---|
| Albany | 60.7% | 89,323 | 37.3% | 54,872 | 2.0% | 3,004 | 145,722 |
| Allegany | 34.1% | 6,566 | 63.9% | 12,310 | 2.0% | 394 | 19,270 |
| Bronx | 82.8% | 283,994 | 16.5% | 56,701 | 0.7% | 2,234 | 342,929 |
| Broome | 50.4% | 46,281 | 47.4% | 43,568 | 2.2% | 2,041 | 91,890 |
| Cattaraugus | 39.4% | 13,514 | 58.5% | 20,051 | 2.0% | 697 | 34,262 |
| Cayuga | 48.6% | 17,534 | 49.2% | 17,743 | 2.1% | 775 | 36,052 |
| Chautauqua | 44.7% | 27,257 | 53.2% | 32,434 | 2.1% | 1,253 | 60,944 |
| Chemung | 43.7% | 17,080 | 54.6% | 21,321 | 1.7% | 674 | 39,075 |
| Chenango | 43.5% | 9,277 | 54.3% | 11,582 | 2.3% | 482 | 21,341 |
| Clinton | 52.2% | 17,624 | 45.4% | 15,330 | 2.3% | 782 | 33,736 |
| Columbia | 51.2% | 15,929 | 46.5% | 14,457 | 2.3% | 717 | 31,103 |
| Cortland | 46.9% | 10,670 | 51.0% | 11,613 | 2.1% | 477 | 22,760 |
| Delaware | 41.2% | 8,724 | 56.5% | '11,958 | 2.3% | 495 | 21,177 |
| Dutchess | 47.0% | 58,232 | 51.2% | 63,372 | 1.8% | 2,277 | 123,881 |
| Erie | 56.4% | 251,090 | 41.4% | 184,423 | 2.2% | 9,625 | 445,138 |
| Essex | 45.9% | 8,768 | 51.7% | 9,869 | 2.3% | 445 | 19,082 |
| Franklin | 52.1% | 9,543 | 45.8% | 8,383 | 2.1% | 390 | 18,316 |
| Fulton | 41.4% | 9,202 | 56.6% | 12,570 | 2.0% | 443 | 22,215 |
| Genesee | 37.5% | 10,331 | 60.6% | 16,725 | 1.9% | 524 | 27,580 |
| Greene | 39.9% | 8,933 | 58.0% | 12,996 | 2.1% | 469 | 22,398 |
| Hamilton | 31.0% | 1,145 | 67.0% | 2,475 | 2.0% | 75 | 3,695 |
| Herkimer | 41.2% | 11,675 | 56.6% | 16,024 | 2.2% | 611 | 28,310 |
| Jefferson | 43.5% | 16,860 | 54.7% | 21,231 | 1.8% | 709 | 38,800 |
| Kings | 74.9% | 514,973 | 24.3% | 167,149 | 0.8% | 5,658 | 687,780 |
| Lewis | 39.9% | 4,546 | 58.1% | 6,624 | 2.0% | 227 | 11,397 |
| Livingston | 38.4% | 11,504 | 59.2% | 17,729 | 2.4% | 715 | 29,948 |
| Madison | 43.3% | 13,121 | 54.6% | 16,537 | 2.1% | 629 | 30,287 |
| Monroe | 50.6% | 173,497 | 47.7% | 163,545 | 1.8% | 6,022 | 343,064 |
| Montgomery | 44.5% | 9,449 | 53.4% | 11,338 | 2.0% | 434 | 21,221 |
| Nassau | 52.2% | 323,070 | 46.6% | 288,355 | 2.2% | 6,918 | 618,343 |
| New York | 82.1% | 526,765 | 16.7% | 107,405 | 1.2% | 7,577 | 641,747 |
| Niagara | 49.3% | 47,602 | 48.8% | 47,111 | 1.9% | 1,868 | 96,581 |
| Oneida | 42.8% | 40,792 | 54.9% | 52,392 | 2.3% | 2,185 | 95,369 |
| Onondaga | 54.2% | 116,381 | 43.8% | 94,006 | 2.0% | 4,238 | 214,625 |
| Ontario | 42.2% | 21,166 | 55.9% | 27,999 | 1.9% | 945 | 50,110 |
| Orange | 43.8% | 63,394 | 54.7% | 79,089 | 1.5% | 2,190 | 144,673 |
| Orleans | 36.0% | 5,959 | 62.3% | 10,317 | 1.8% | 301 | 16,573 |
| Oswego | 46.8% | 24,133 | 51.0% | 26,325 | 2.2% | 1,149 | 51,607 |
| Otsego | 47.7% | 12,734 | 50.1% | 13,342 | 2.2% | 587 | 26,652 |
| Putnam | 42.0% | 19,575 | 56.6% | 26,356 | 2.4% | 640 | 46,571 |
| Queens | 71.7% | 433,835 | 27.4% | 165,954 | 0.9% | 5,273 | 605,062 |
| Rensselaer | 49.7% | 36,075 | 47.9% | 34,734 | 2.4% | 1,705 | 72,514 |
| Richmond | 42.7% | 68,448 | 56.4% | 90,325 | 0.8% | 1,353 | 160,126 |
| Rockland | 48.9% | 64,191 | 49.6% | 65,130 | 1.5% | 1,910 | 131,231 |
| Saratoga | 45.6% | 48,730 | 52.5% | 56,158 | 1.9% | 1,985 | 106,873 |
| Schenectady | 51.8% | 35,971 | 46.2% | 32,066 | 2.1% | 1,432 | 69,469 |
| Schoharie | 38.7% | 5,630 | 59.0% | 8,591 | 2.3% | 338 | 14,559 |
| Schuyler | 40.1% | 3,445 | 57.7% | 4,960 | 2.2% | 185 | 8,590 |
| Seneca | 45.5% | 6,979 | 52.1% | 7,981 | 2.4% | 365 | 15,325 |
| St. Lawrence | 54.7% | 22,857 | 43.2% | 18,029 | 2.1% | 875 | 41,761 |
| Steuben | 34.3% | 14,523 | 63.8% | 26,980 | 1.8% | 781 | 42,284 |
| Suffolk | 49.5% | 315,909 | 48.5% | 309,949 | 2.0% | 12,854 | 638,712 |
| Sullivan | 48.6% | 15,034 | 49.5% | 15,319 | 2.0% | 613 | 30,966 |
| Tioga | 40.6% | 9,694 | 57.6% | 13,762 | 1.9% | 446 | 23,902 |
| Tompkins | 64.2% | 27,229 | 33.0% | 13,994 | 2.8% | 1,198 | 42,421 |
| Ulster | 54.3% | 47,602 | 43.1% | 37,821 | 2.6% | 2,289 | 87,712 |
| Warren | 43.2% | 13,405 | 54.6% | 16,969 | 2.2% | 685 | 31,059 |
| Washington | 42.3% | 10,624 | 55.1% | 13,827 | 2.6% | 652 | 25,103 |
| Wayne | 38.1% | 15,709 | 60.0% | 24,709 | 1.9% | 802 | 41,220 |
| Westchester | 58.1% | 229,849 | 40.3% | 159,628 | 1.6% | 6,293 | 395,770 |
| Wyoming | 33.8% | 6,134 | 64.7% | 11,745 | 1.6% | 290 | 18,169 |
| Yates | 39.3% | 4,205 | 58.9% | 6,309 | 1.8% | 197 | 10,711 |
Electors[]
NY voters cast their ballots for electors: representatives to the Electoral College. New York has 31 electors because it has 29 congressional districts and 2 senators. All candidates who appear on the ballot or qualify to receive write-in votes must submit a list of 31 electors, who pledge to vote for their candidate and his or her running mate. Whoever wins the majority of votes in the state is awarded all 31 electoral votes. Their chosen electors then vote for president and vice president. Although electors are pledged to their candidate and running mate, they are not obligated to vote for them. An elector who votes for someone other than his or her candidate is known as a faithless elector.
The electors of each state and the District of Columbia met on December 13, 2004, to cast their votes for president and vice president. The Electoral College itself never meets as one body. Instead the electors from each state and the District of Columbia meet in their respective capitols.
The following were the members of the Electoral College from New York. All were pledged to and voted for Kerry/Edwards.
- Joseph Ashton
- Bill De Blasio
- Molly Clifford
- Lorraine Cortes-Vazquez
- Inez Dickens
- Danny Donahue
- Herman D. Farrell
- C. Virginia Fields
- Emily Giske
- Bea Gonzalez
- Alan Hevesi
- Frank Hoare
- Virginia Kee
- Peggy Kerry
- Denise King
- Len Lenihan
- Bertha Lewis
- Alan Lubin
- Thomas J. Manton
- Dennis Mehiel
- June O'Neill
- David Paterson
- Jose Rivera
- Rich Schaffer
- Chung Seto
- Sheldon Silver
- Eliot Spitzer
- Antoine Thompson
- Paul Tokasz
- Bill Wood
- Robert Zimmerman
See also[]
- United States presidential elections in New York
- Presidency of George W. Bush
References[]
- ^ [1]
- ^ "Election 2004 Polls - Dave Leip's Atlas of U.S. Presidential Elections". Uselectionatlas.org. Retrieved 8 October 2014.
- ^ "George W Bush - $374,659,453 raised, '04 election cycle, Republican Party, President". Campaignmoney.com. Retrieved 8 October 2014.
- ^ "John F Kerry - $345,826,176 raised, '04 election cycle, Democratic Party, President". Campaignmoney.com. Retrieved 8 October 2014.
- ^ "CNN.com Specials". Cnn.com. Retrieved 8 October 2014.
- ^ "CNN.com Specials". Cnn.com. Retrieved 8 October 2014.
- ^ https://us.cnn.com/ELECTION/2004/pages/results/states/NY/P/00/epolls.0.html
- ^ https://us.cnn.com/ELECTION/2004/pages/results/states/NY/P/00/epolls.0.html
- ^ https://us.cnn.com/ELECTION/2004/pages/results/states/NY/P/00/epolls.0.html
- ^ https://us.cnn.com/ELECTION/2004/pages/results/states/NY/P/00/epolls.0.html
- ^ https://us.cnn.com/ELECTION/2004/pages/results/states/NY/P/00/epolls.0.html
- ^ https://us.cnn.com/ELECTION/2004/pages/results/states/NY/P/00/epolls.0.html
- ^ "Dave Leip's Atlas of U.S. Presidential Elections 2004 - New York". Uselectionatlas.org. Retrieved 2013-01-07.
- ^ "Swing State Project". Swingstateproject.com. Retrieved 8 October 2014.
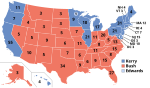
State and district results of the 2004 United States presidential election | ||
|---|---|---|
|  | |
- United States presidential elections in New York (state)
- 2004 United States presidential election by state