2004 United States presidential election in Virginia
| ||||||||||||||||||||||||||
| Turnout | 70.8% | |||||||||||||||||||||||||
|---|---|---|---|---|---|---|---|---|---|---|---|---|---|---|---|---|---|---|---|---|---|---|---|---|---|---|
| ||||||||||||||||||||||||||
 County and Independent City Results
| ||||||||||||||||||||||||||
| ||||||||||||||||||||||||||
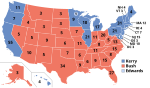
The 2004 United States presidential election in Virginia took place on November 2, 2004, and was part of the 2004 United States presidential election. Voters chose 13 representatives, or electors to the Electoral College, who voted for president and vice president.
Virginia was won by incumbent President George W. Bush by an 8.20% margin of victory. Prior to the election, all 12 news organizations considered this a state Bush would win, or otherwise a red state. The state had voted for the Republican candidate in all presidential elections since 1952 except for 1964's Democratic landslide. This pattern continued in 2004, although it would be broken four years later by the Democratic victory in 2008.
As of the 2020 presidential election, the 2004 election is the last time that Virginia has voted Republican. This was also the last time Buchanan County and Dickenson County would vote Democratic for president; and the last time Loudoun County, Prince William County, and Henrico County, and the independent Cities of Winchester, Radford, Staunton, Harrisonburg, Manassas, Suffolk, Hopewell, and Manassas Park, would vote Republican for president. As of 2020, this is the last time Virginia has voted to the right of Missouri, Florida, or Ohio.
Bush became the first Republican to win the White House without carrying Fairfax County since Calvin Coolidge in 1924.
Primaries[]
- Virginia Democratic primary, 2004
Campaign[]
Predictions[]
| Elections in Virginia |
|---|
 |
|
show |
|
show |
|
show |
|
show |
|
show |
|
show |
|
show |
|
show |
There were 12 news organizations who made state-by-state predictions of the election. Here are their last predictions before election day.[2]
- D.C. Political Report: Solid Republican
- Associated Press: Leans Bush
- CNN: Bush
- Cook Political Report: Lean Republican
- Newsweek: Lean Bush
- New York Times: Lean Bush
- Rasmussen Reports: Bush
- Research 2000: Solid Bush
- Washington Post: Bush
- Washington Times: Solid Bush
- Zogby International: Bush
- Washington Dispatch: Bush
Polling[]
Bush won every single pre-election poll. The final 3 poll average showed Bush leading 50% to 45%.[3]
Fundraising[]
Bush raised $8,594,386.[4] Kerry raised $6,125,128.[5]
Advertising and visits[]
Neither campaign advertised or visited this state during the fall election.[6][7]
Analysis[]
In the last century Virginia has shifted from a largely rural, politically Southern and conservative state to a more urbanized, pluralistic, and politically moderate environment. Up until the 1970s, Virginia was a racially divided one-party state dominated by the Byrd Organization.[8] African Americans were effectively disfranchised until after passage of civil rights legislation in the mid-1960s.[9] Enfranchisement and immigration of other groups, especially Hispanics, have placed growing importance on minority voting.[10] Regional differences play a large part in Virginia politics.[11] Rural southern and western areas moved to support the Republican Party in response to its "southern strategy", while urban and growing suburban areas, including Northern Virginia, form the Democratic Party base.[12][13] Democratic support also persists in union-influenced parts of Southwest Virginia, college towns such as Charlottesville and Blacksburg, and the southeastern region.[14][15]
Results[]
| United States presidential election in Virginia, 2004[16] | ||||||
|---|---|---|---|---|---|---|
| Party | Candidate | Running mate | Votes | Percentage | Electoral votes | |
| Republican | George W. Bush (inc.) | Dick Cheney | 1,716,959 | 53.73% | 13 | |
| Democratic | John Kerry | John Edwards | 1,454,742 | 45.53% | 0 | |
| Libertarian | Michael Badnarik | Richard Campagna | 11,032 | 0.35% | 0 | |
| Constitution | Michael Peroutka | Chuck Baldwin | 10,161 | 0.32% | 0 | |
| Independent (Write-in) | Ralph Nader (Write-in) | Peter Camejo | 2,393 | 0.07% | 0 | |
| Green (Write-in) | David Cobb (Write-in) | Pat LaMarche | 104 | <0.01% | 0 | |
| Write-ins | - | 24 | <0.01% | 0 | ||
| Totals | 3,195,415 | 100.00% | 13 | |||
| Voter turnout (Voting age population) | 57.2% | — | ||||
Results breakdown[]
By county[]
These results combine counties and independent cities in Virginia.
| County or City | Kerry % | Kerry # | Bush % | Bush # | Other % | Other # |
|---|---|---|---|---|---|---|
| Accomack | 41.3% | 5,518 | 57.8% | 7,726 | 0.8% | 112 |
| Albemarle | 50.5% | 22,088 | 48.5% | 21,189 | 1.0% | 449 |
| Alleghany | 44.5% | 3,203 | 55.1% | 3,962 | 0.4% | 30 |
| Amelia | 34.5% | 1,862 | 64.8% | 3,499 | 0.7% | 36 |
| Amherst | 38.3% | 4,866 | 61.1% | 7,758 | 0.6% | 71 |
| Appomattox | 32.9% | 2,191 | 65.6% | 4,366 | 1.5% | 98 |
| Arlington | 67.6% | 63,987 | 31.3% | 29,635 | 1.1% | 1,028 |
| Augusta | 23.6% | 7,019 | 74.4% | 22,100 | 2.0% | 585 |
| Bath | 36.3% | 828 | 62.8% | 1,432 | 1.0% | 22 |
| Bedford | 29.0% | 9,102 | 69.8% | 21,925 | 1.2% | 377 |
| Bland | 29.5% | 846 | 68.5% | 1,962 | 2.0% | 57 |
| Botetourt | 30.4% | 4,801 | 68.8% | 10,865 | 0.8% | 131 |
| Brunswick | 58.6% | 4,062 | 41.2% | 2,852 | 0.2% | 12 |
| Buchanan | 53.7% | 5,275 | 45.9% | 4,507 | 0.5% | 47 |
| Buckingham | 46.3% | 2,789 | 52.8% | 3,185 | 0.9% | 53 |
| Campbell | 29.8% | 6,862 | 69.1% | 15,891 | 1.1% | 244 |
| Caroline | 49.0% | 4,878 | 50.2% | 4,999 | 0.8% | 77 |
| Carroll | 32.1% | 3,888 | 67.4% | 8,173 | 0.6% | 67 |
| Charles City | 62.7% | 2,155 | 36.5% | 1,254 | 0.9% | 30 |
| Charlotte | 40.9% | 2,223 | 58.2% | 3,166 | 0.9% | 49 |
| Chesterfield | 36.9% | 49,346 | 62.6% | 83,745 | 0.5% | 723 |
| Clarke | 41.5% | 2,699 | 57.5% | 3,741 | 1.0% | 65 |
| Craig | 34.4% | 901 | 65.1% | 1,706 | 0.5% | 14 |
| Culpeper | 35.1% | 5,476 | 64.2% | 10,026 | 0.7% | 103 |
| Cumberland | 41.7% | 1,721 | 57.6% | 2,377 | 0.7% | 28 |
| Dickenson | 50.8% | 3,761 | 48.5% | 3,591 | 0.7% | 54 |
| Dinwiddie | 42.2% | 4,569 | 57.1% | 6,193 | 0.7% | 77 |
| Essex | 46.2% | 2,007 | 53.0% | 2,304 | 0.8% | 33 |
| Fairfax | 53.2% | 245,671 | 45.9% | 211,980 | 0.8% | 3,728 |
| Fauquier | 35.8% | 10,712 | 63.6% | 19,011 | 0.6% | 192 |
| Floyd | 36.9% | 2,488 | 61.8% | 4,162 | 1.2% | 84 |
| Fluvanna | 40.3% | 4,415 | 58.9% | 6,458 | 0.8% | 84 |
| Franklin | 36.0% | 8,002 | 63.2% | 14,048 | 0.8% | 173 |
| Frederick | 31.0% | 8,853 | 67.9% | 19,386 | 1.1% | 301 |
| Giles | 40.6% | 3,047 | 57.6% | 4,320 | 1.7% | 131 |
| Gloucester | 31.3% | 5,105 | 67.9% | 11,084 | 0.9% | 144 |
| Goochland | 34.7% | 3,583 | 64.5% | 6,668 | 0.8% | 87 |
| Grayson | 34.0% | 2,430 | 65.2% | 4,655 | 0.7% | 52 |
| Greene | 32.3% | 2,240 | 65.9% | 4,570 | 1.9% | 129 |
| Greensville | 59.0% | 2,514 | 40.7% | 1,732 | 0.3% | 12 |
| Halifax | 42.4% | 6,220 | 57.1% | 8,363 | 0.5% | 73 |
| Hanover | 28.1% | 13,941 | 71.4% | 35,404 | 0.5% | 266 |
| Henrico | 45.6% | 60,864 | 53.8% | 71,809 | 0.6% | 745 |
| Henry | 42.0% | 9,851 | 56.9% | 13,358 | 1.1% | 249 |
| Highland | 34.3% | 522 | 64.6% | 982 | 1.1% | 16 |
| Isle of Wight | 37.0% | 5,871 | 62.6% | 9,929 | 0.4% | 71 |
| James City | 38.4% | 11,934 | 60.9% | 18,949 | 0.7% | 207 |
| King and Queen | 45.8% | 1,506 | 52.9% | 1,737 | 1.3% | 43 |
| King George | 34.6% | 2,739 | 64.7% | 5,124 | 0.7% | 58 |
| King William | 35.4% | 2,436 | 64.0% | 4,397 | 0.6% | 39 |
| Lancaster | 39.8% | 2,477 | 59.8% | 3,724 | 0.5% | 29 |
| Lee | 41.0% | 4,005 | 58.0% | 5,664 | 1.0% | 101 |
| Loudoun | 43.6% | 47,271 | 55.7% | 60,382 | 0.7% | 777 |
| Louisa | 40.2% | 4,844 | 58.9% | 7,083 | 0.9% | 108 |
| Lunenburg | 45.0% | 2,362 | 54.5% | 2,858 | 0.5% | 25 |
| Madison | 37.7% | 2,176 | 61.6% | 3,556 | 0.7% | 40 |
| Mathews | 31.0% | 1,589 | 68.2% | 3,497 | 0.8% | 43 |
| Mecklenburg | 41.4% | 5,293 | 57.3% | 7,319 | 1.3% | 168 |
| Middlesex | 35.6% | 1,914 | 62.0% | 3,336 | 2.4% | 127 |
| Montgomery | 44.8% | 14,128 | 54.2% | 17,070 | 1.0% | 317 |
| Nelson | 49.6% | 3,543 | 49.6% | 3,539 | 0.8% | 57 |
| New Kent | 30.7% | 2,443 | 68.1% | 5,414 | 1.1% | 89 |
| Northampton | 50.5% | 2,775 | 48.5% | 2,669 | 1.0% | 55 |
| Northumberland | 39.8% | 2,548 | 59.8% | 3,832 | 0.5% | 29 |
| Nottoway | 43.7% | 2,635 | 54.8% | 3,303 | 1.5% | 92 |
| Orange | 38.8% | 5,015 | 59.9% | 7,749 | 1.3% | 164 |
| Page | 34.6% | 3,324 | 64.8% | 6,221 | 0.6% | 58 |
| Patrick | 31.3% | 2,572 | 67.0% | 5,507 | 1.7% | 136 |
| Pittsylvania | 33.8% | 9,274 | 64.5% | 17,673 | 1.7% | 470 |
| Powhatan | 25.6% | 3,112 | 73.6% | 8,955 | 0.8% | 96 |
| Prince Edward | 49.6% | 3,632 | 48.8% | 3,571 | 1.5% | 113 |
| Prince George | 38.2% | 5,066 | 61.3% | 8,131 | 0.4% | 57 |
| Prince William | 46.4% | 61,271 | 52.8% | 69,776 | 0.8% | 1,016 |
| Pulaski | 37.3% | 5,310 | 61.5% | 8,769 | 1.2% | 172 |
| Rappahannock | 45.4% | 1,837 | 53.6% | 2,172 | 1.0% | 41 |
| Richmond | 37.0% | 1,243 | 61.9% | 2,082 | 1.1% | 36 |
| Roanoke | 34.2% | 16,082 | 65.1% | 30,596 | 0.6% | 295 |
| Rockbridge | 39.5% | 3,627 | 58.9% | 5,412 | 1.5% | 142 |
| Rockingham | 24.9% | 7,273 | 74.4% | 21,737 | 0.7% | 206 |
| Russell | 45.2% | 5,167 | 53.2% | 6,077 | 1.6% | 179 |
| Scott | 33.4% | 3,324 | 65.0% | 6,479 | 1.6% | 164 |
| Shenandoah | 30.2% | 5,186 | 68.9% | 11,820 | 0.8% | 140 |
| Smyth | 33.6% | 4,143 | 64.2% | 7,906 | 2.2% | 270 |
| Southampton | 45.8% | 3,431 | 53.6% | 4,018 | 0.6% | 43 |
| Spotsylvania | 36.6% | 16,623 | 62.8% | 28,527 | 0.6% | 295 |
| Stafford | 37.4% | 17,208 | 62.0% | 28,500 | 0.6% | 278 |
| Surry | 55.5% | 1,954 | 43.8% | 1,543 | 0.7% | 25 |
| Sussex | 55.7% | 2,420 | 43.5% | 1,890 | 0.8% | 35 |
| Tazewell | 41.1% | 7,184 | 57.4% | 10,039 | 1.5% | 257 |
| Warren | 37.3% | 5,241 | 61.1% | 8,600 | 1.6% | 227 |
| Washington | 32.6% | 7,339 | 65.5% | 14,749 | 1.9% | 426 |
| Westmoreland | 49.2% | 3,370 | 50.1% | 3,433 | 0.7% | 45 |
| Wise | 40.5% | 5,802 | 58.2% | 8,330 | 1.3% | 180 |
| Wythe | 31.0% | 3,581 | 68.5% | 7,911 | 0.5% | 62 |
| York | 34.4% | 10,276 | 64.9% | 19,396 | 0.7% | 208 |
| Alexandria | 66.8% | 41,116 | 32.3% | 19,844 | 0.9% | 555 |
| Bedford | 41.0% | 1,042 | 57.9% | 1,472 | 1.1% | 28 |
| Bristol | 35.7% | 2,400 | 63.6% | 4,275 | 0.7% | 49 |
| Buena Vista | 39.2% | 936 | 59.3% | 1,417 | 1.5% | 36 |
| Charlottesville | 71.8% | 11,088 | 27.0% | 4,172 | 1.2% | 190 |
| Chesapeake | 42.3% | 38,744 | 57.1% | 52,283 | 0.6% | 514 |
| Colonial Heights | 25.0% | 2,061 | 74.5% | 6,129 | 0.5% | 41 |
| Covington | 51.2% | 1,179 | 48.0% | 1,104 | 0.8% | 18 |
| Danville | 49.4% | 9,436 | 49.2% | 9,399 | 1.4% | 277 |
| Emporia | 56.1% | 1,247 | 43.7% | 970 | 0.2% | 4 |
| Fairfax | 51.2% | 5,395 | 47.8% | 5,045 | 1.0% | 106 |
| Falls Church | 64.7% | 3,944 | 34.0% | 2,074 | 1.3% | 80 |
| Franklin | 54.0% | 1,910 | 45.6% | 1,613 | 0.4% | 13 |
| Fredericksburg | 54.2% | 4,085 | 44.9% | 3,390 | 0.9% | 67 |
| Galax | 42.3% | 987 | 57.2% | 1,336 | 0.5% | 12 |
| Hampton | 57.4% | 32,016 | 42.0% | 23,399 | 0.6% | 326 |
| Harrisonburg | 42.8% | 4,726 | 55.9% | 6,165 | 1.3% | 139 |
| Hopewell | 45.0% | 3,573 | 53.6% | 4,251 | 1.4% | 112 |
| Lexington | 57.0% | 1,340 | 41.8% | 982 | 1.1% | 27 |
| Lynchburg | 44.5% | 11,727 | 54.7% | 14,400 | 0.8% | 213 |
| Manassas | 43.1% | 5,562 | 56.2% | 7,257 | 0.7% | 84 |
| Manassas Park | 45.0% | 1,498 | 54.2% | 1,807 | 0.8% | 27 |
| Martinsville | 54.2% | 3,036 | 45.3% | 2,538 | 0.5% | 29 |
| Newport News | 52.0% | 35,319 | 47.4% | 32,208 | 0.6% | 425 |
| Norfolk | 61.7% | 43,518 | 37.4% | 26,401 | 0.9% | 651 |
| Norton | 48.2% | 725 | 51.1% | 768 | 0.7% | 11 |
| Petersburg | 81.0% | 9,682 | 18.7% | 2,238 | 0.2% | 29 |
| Poquoson | 22.0% | 1,424 | 77.2% | 5,004 | 0.8% | 52 |
| Portsmouth | 61.0% | 24,112 | 38.5% | 15,212 | 0.5% | 210 |
| Radford | 46.3% | 2,244 | 52.9% | 2,564 | 0.8% | 37 |
| Richmond | 70.2% | 52,167 | 29.1% | 21,637 | 0.7% | 521 |
| Roanoke | 52.4% | 18,862 | 46.3% | 16,661 | 1.3% | 477 |
| Salem | 37.0% | 4,254 | 62.0% | 7,115 | 1.0% | 115 |
| Staunton | 39.0% | 3,756 | 60.3% | 5,805 | 0.7% | 68 |
| Suffolk | 47.3% | 15,233 | 52.1% | 16,763 | 0.6% | 193 |
| Virginia Beach | 40.2% | 70,666 | 59.1% | 103,752 | 0.7% | 1,269 |
| Waynesboro | 35.1% | 2,792 | 63.9% | 5,092 | 1.0% | 79 |
| Williamsburg | 51.3% | 2,216 | 47.8% | 2,064 | 0.9% | 40 |
| Winchester | 42.5% | 3,967 | 56.5% | 5,283 | 1.0% | 93 |
Counties and independent cities that flipped from Democratic to Republican[]
- Caroline (largest municipality: Bowling Green)
- Russell (largest municipality: Lebanon)
- Southampton (largest municipality: Courtland)
- Norton (independent city)
- Suffolk (independent city)
Counties and independent cities that flipped from Republican to Democratic[]
- Albemarle (largest municipality: Scottsville)
- Fairfax (largest municipality: Herndon)
- Nelson (largest municipality: Nellysford)
- Prince Edward (largest municipality: Farmville)
- Danville (independent city)
- Fairfax (independent city)
- Williamsburg (independent city)
By congressional district[]
Bush won 9 of 11 congressional districts, including one that elected a Democrat.[17]
| District | Bush | Kerry | Representative |
|---|---|---|---|
| 1st | 60% | 39% | Jo Ann Davis |
| 2nd | 58% | 42% | Thelma Drake |
| 3rd | 33% | 66% | Robert C. Scott |
| 4th | 57% | 43% | Randy Forbes |
| 5th | 56% | 43% | Virgil Goode |
| 6th | 63% | 36% | Bob Goodlatte |
| 7th | 61% | 38% | Eric Cantor |
| 8th | 35% | 64% | Jim Moran |
| 9th | 60% | 39% | Rick Boucher |
| 10th | 55% | 44% | Frank Wolf |
| 11th | 50% | 49% | Thomas M. Davis |
Electors[]
Technically the voters of Virginia cast their ballots for electors: representatives to the Electoral College. Virginia is allocated 13 electors because it has 11 congressional districts and 2 senators. All candidates who appear on the ballot or qualify to receive write-in votes must submit a list of 13 electors, who pledge to vote for their candidate and his or her running mate. Whoever wins the majority of votes in the state is awarded all 13 electoral votes. Their chosen electors then vote for president and vice president. Although electors are pledged to their candidate and running mate, they are not obligated to vote for them. An elector who votes for someone other than his or her candidate is known as a faithless elector.
The electors of each state and the District of Columbia met on December 13, 2004, to cast their votes for president and vice president. The Electoral College itself never meets as one body. Instead the electors from each state and the District of Columbia met in their respective capitols.
The following were the members of the Electoral College from the state. All 13 were pledged for Bush/Cheney:
- Yvonne McGee McCoy
- Loretta H. Tate
- Theodore C. Brown
- Woodrow Harris
- Keith C. Drake
- Wendell S. Walker
- Peter E. Broadbent
- Sean Michael Spicer
- Lloyd C. Martin
- Dorothy L. Simpson
- Carlton John Davis
- Charles E. Dane
- Rebecca Anne Stoeckel
References[]
- ^ "Registration/Turnout Statistics". Virginia Department of Elections. Archived from the original on 2018-10-18. Retrieved 2018-09-18.
- ^ [1]
- ^ http://uselectionatlas.org/USPRESIDENT/GENERAL/CAMPAIGN/2004/polls.php?fips=51
- ^ "George W Bush - $374,659,453 raised, '04 election cycle, Republican Party, President". campaignmoney.com. Retrieved 26 July 2017.
- ^ "John F Kerry - $345,826,176 raised, '04 election cycle, Democratic Party, President". campaignmoney.com. Retrieved 26 July 2017.
- ^ "CNN.com Specials". CNN.
- ^ "CNN.com Specials". CNN.
- ^ Sweeney, James R. (1999). ""Sheep without a Shepherd": The New Deal Faction in the Virginia Democratic Party". Presidential Studies Quarterly. 29: 438. doi:10.1111/1741-5705.00043. Retrieved March 31, 2008.
- ^ Burchett, Michael H. (Summer 1997). "Promise and prejudice: Wise County, Virginia and the Great Migration, 1910–1920". The Journal of Negro History. 82 (3): 312. doi:10.2307/2717675. JSTOR 2717675.
- ^ Eisman, Dale (October 25, 2006). "Webb, Allen court Hispanic, white-collar voters in N. Va". The Virginian-Pilot. Retrieved March 29, 2008.
- ^ Turque, Bill; Wiggins, Ovetta; Stewart, Nikita (February 13, 2008). "In Virginia, Results Signal A State in Play for November". The Washington Post. Retrieved September 29, 2008.
- ^ Miller, Gary; Schofield, Norman (May 2003). "Activists and Partisan Realignment in the United States". The American Political Science Review. 97 (2): 245–260. doi:10.1017/s0003055403000650. JSTOR 3118207.
- ^ Craig, Tim (December 11, 2007). "Tensions Could Hurt Majority in Va. Senate". The Washington Post. Retrieved December 23, 2007.
- ^ "State Political Profile: Virginia". The Washington Post. Associated Press. 2006. Archived from the original on August 24, 2007. Retrieved December 23, 2007.
- ^ Clemons, Michael L.; Jones, Charles E. (July 2000). "African American Legislative Politics in Virginia". Journal of Black Studies. 30 (6, Special Issue: African American State Legislative Politics): 744–767. doi:10.1177/002193470003000603. JSTOR 2645922.
- ^ http://clerk.house.gov/member_info/electionInfo/2004election.pdf
- ^ "Presidential Results by Congressional District, 2000-2008". Swing State Project. Retrieved 26 July 2017.
| show State and district results of the 2004 United States presidential election |
|---|
- 2004 United States presidential election by state
- United States presidential elections in Virginia
- 2004 Virginia elections