Virginia's 11th congressional district
| Virginia's 11th congressional district | |||
|---|---|---|---|
 Virginia's 11th congressional district since January 3, 2013 | |||
| Representative |
| ||
| Distribution |
| ||
| Population (2019) | 789,553[2] | ||
| Median household income | $118,099[3] | ||
| Ethnicity |
| ||
| Cook PVI | D+19[4] | ||
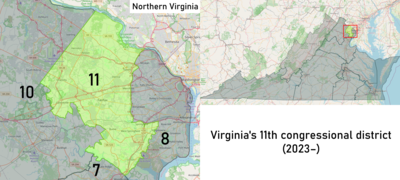
Virginia's 11th congressional district is a U.S. congressional district in the Commonwealth of Virginia. The district stretches from Herndon to Quantico, comprising most of Fairfax County, all of the City of Fairfax, as well as part of eastern Prince William County. The district is represented by Democrat Gerry Connolly.
The Hill newspaper quotes census data to conclude that Virginia's 11th district was the wealthiest congressional district in the nation from 2003 to 2013. The article attributed the wealth to the many lobbyists and two-career couples in Northern Virginia.[5]
The district last existed in what is now West Virginia's 1st district and was held by Jacob B. Blair before the events of the U.S. Civil War. Virginia did not have an 11th district until it was re-created after the 1990 United States Census from portions of the old 8th and 10th districts because of explosive growth in Northern Virginia. It was intended to be a "fair fight" district; indeed, it encompassed most of the more Democratic portions of the old 10th district and the more Republican portions of the old 8th district. George W. Bush only narrowly defeated John Kerry here in 2004, while Democratic Governor Tim Kaine and Democratic Senator Jim Webb both carried this district, in 2005 and 2006 respectively. In 2008, Barack Obama won this district over Republican Senator John McCain. Democrat Leslie L. Byrne briefly held the seat for the first election cycle of the new district, but was quickly defeated in 1994 by Republican Tom Davis. Davis established a secure hold on the district during his tenure (1995–2008), but Democrat Gerald Connolly won it when Davis stepped down. Both Davis and Connolly may have been aided by their previous service on the Board of Supervisors of Fairfax County, where most of the 11th district's population is concentrated. 61.5% of 11th congressional district residents live in Fairfax County.[6] The results of the 2010 United States Census showed this district's population continued to grow, and due to redistricting covered more urban areas in Northern Virginia to favor the incumbent, Connolly.
Recent electoral history[]
1992-1998s[]
| Party | Candidate | Votes | % | |
|---|---|---|---|---|
| Democratic | Leslie L. Byrne | 114,172 | 50.02 | |
| Republican | Henry N. Butler | 103,119 | 45.17 | |
| Independent | A. T. "Art" Narro | 6,681 | 2.93 | |
| Independent | Perry J. Mitchell | 4,155 | 1.82 | |
| Write-ins | 145 | 0.06 | ||
| Total votes | 228,272 | 100.00 | ||
| Party | Candidate | Votes | % | |||
|---|---|---|---|---|---|---|
| Republican | Tom Davis | 98,216 | 52.90 | |||
| Democratic | Leslie L. Byrne (inc.) | 84,104 | 45.30 | |||
| Independent | Gordon S. Cruickshank | 3,246 | 1.75 | |||
| Write-ins | 114 | 0.06 | ||||
| Total votes | 185,680 | 100.00 | ||||
| Republican gain from Democratic | ||||||
| Party | Candidate | Votes | % | |
|---|---|---|---|---|
| Republican | Tom Davis (inc.) | 138,758 | 64.10 | |
| Democratic | Thomas J. Horton | 74,701 | 34.51 | |
| Independent | C. W. "Levi" Levy | 2,842 | 1.31 | |
| Write-ins | 181 | 0.08 | ||
| Total votes | 216,482 | 100.00 | ||
| Republican hold | ||||
| Party | Candidate | Votes | % | |
|---|---|---|---|---|
| Republican | Tom Davis (inc.) | 91,603 | 81.71 | |
| Independent | C. W. "Levi" Levy | 18,807 | 16.78 | |
| Write-ins | 1,701 | 1.52 | ||
| Total votes | 112,111 | 100.00 | ||
| Republican hold | ||||
2000s[]
| Party | Candidate | Votes | % | |
|---|---|---|---|---|
| Republican | Tom Davis (inc.) | 150,395 | 61.90 | |
| Democratic | Mike L. Corrigan | 83,455 | 34.35 | |
| Independent | Robert K. McBride | 4,774 | 1.96 | |
| Independent | C. W. "Levi" Levy | 4,059 | 1.67 | |
| Write-ins | 285 | 0.12 | ||
| Total votes | 242,968 | 100.00 | ||
| Republican hold | ||||
| Party | Candidate | Votes | % | |
|---|---|---|---|---|
| Republican | Tom Davis (inc.) | 135,379 | 82.90 | |
| Constitution | Frank W. Creel | 26,892 | 16.47 | |
| Write-ins | 1,027 | 0.63 | ||
| Total votes | 163,298 | 100.00 | ||
| Republican hold | ||||
| Party | Candidate | Votes | % | |
|---|---|---|---|---|
| Republican | Tom Davis (inc.) | 186,299 | 60.25 | |
| Democratic | Ken Longmyer | 118,305 | 38.26 | |
| Independent | Joseph P. Oddo | 4,338 | 1.40 | |
| Write-ins | 259 | 0.08 | ||
| Total votes | 309,233 | 100.00 | ||
| Republican hold | ||||
| Party | Candidate | Votes | % | |
|---|---|---|---|---|
| Republican | Tom Davis (inc.) | 130,468 | 55.45 | |
| Democratic | Andrew L. Hurst | 102,411 | 43.57 | |
| Independent Greens | Ferdinando C. Greco | 2,042 | 0.87 | |
| Write-ins | 259 | 0.11 | ||
| Total votes | 235,280 | 100.00 | ||
| Republican hold | ||||
| Party | Candidate | Votes | % | |||
|---|---|---|---|---|---|---|
| Democratic | Gerry Connolly | 196,598 | 54.69 | |||
| Republican | Keith Fimian | 154,758 | 43.05 | |||
| Independent Greens | Joseph P. Oddo | 7,271 | 2.02 | |||
| Write-ins | 864 | 0.24 | ||||
| Total votes | 359,491 | 100.00 | ||||
| Democratic gain from Republican | ||||||
2010s[]
| Party | Candidate | Votes | % | |
|---|---|---|---|---|
| Democratic | Gerry Connolly (inc.) | 111,720 | 49.22 | |
| Republican | Keith Fimian | 110,739 | 48.79 | |
| Independent | Christopher F. DeCarlo | 1,846 | 0.81 | |
| Libertarian | David L. Dotson | 1,382 | 0.60 | |
| Independent Greens | David William Gillis, Jr. | 959 | 0.42 | |
| Write-ins | 305 | 0.13 | ||
| Total votes | 226,951 | 100 | ||
| Democratic hold | ||||
| Party | Candidate | Votes | % | |
|---|---|---|---|---|
| Democratic | Gerry Connolly (inc.) | 202,606 | 60.98 | |
| Republican | Christopher Perkins | 117,902 | 35.49 | |
| Independent | Mark T. Gibson | 3,806 | 1.15 | |
| Independent | Christopher F. DeCarlo | 3,027 | 0.91 | |
| Green | Joe F. Galdo | 2,195 | 0.66 | |
| Independent Greens | Peter M. Marchetti | 1,919 | 0.58 | |
| Write-ins | 788 | 0.24 | ||
| Total votes | 332,243 | 100 | ||
| Democratic hold | ||||
| Party | Candidate | Votes | % | |
|---|---|---|---|---|
| Democratic | Gerry Connolly (inc.) | 106,780 | 56.86 | |
| Republican | Suzanne Scholte | 75,796 | 40.36 | |
| Libertarian | Marc Harrold | 3,264 | 1.74 | |
| Green | Joe F. Galdo | 1,739 | 0.93 | |
| Write-ins | 226 | 0.12 | ||
| Total votes | 187,805 | 100 | ||
| Democratic hold | ||||
| Party | Candidate | Votes | % | |
|---|---|---|---|---|
| Democratic | Gerry Connolly (inc.) | 247,818 | 87.88 | |
| Write-ins | 34,185 | 12.12 | ||
| Total votes | 282,003 | 100 | ||
| Democratic hold | ||||
| Party | Candidate | Votes | % | |
|---|---|---|---|---|
| Democratic | Gerry Connolly (inc.) | 219,191 | 71.11 | |
| Republican | Jeff Dove | 83,023 | 26.93 | |
| Libertarian | Stevan Porter | 5,546 | 1.80 | |
| Write-ins | 490 | 0.16 | ||
| Total votes | 308,250 | 100 | ||
| Democratic hold | ||||
2020s[]
| Party | Candidate | Votes | % | |
|---|---|---|---|---|
| Democratic | Gerry Connolly (inc.) | 280,733 | 71.6 | |
| Republican | Manga Anantatmula | 111,380 | 28.4 | |
| Total votes | 392,113 | 94.0 | ||
| Democratic hold | ||||
Statewide elections[]
Data on election results for Virginia districts can be found via the Virginia Department of Elections.[12]
| Year | Office | Results |
|---|---|---|
| 1996 | President | Clinton 48%–46% |
| Senator | Warner 55%–45% | |
| 1997 | Governor | Gilmore 52%–47% |
| Lieutenant Governor | Hager 49%–47% | |
| Earley 53%–47% | ||
| 2000 | President | Bush 52%–45% |
| Senator | Robb 53%–47% | |
| 2001 | Governor | Warner 56%–44% |
| Lieutenant Governor | Kaine 54%–45% | |
| Kilgore 51%–49% | ||
| 2004 | President | Bush 50%–49%[13] |
| 2008 | President | Obama 57%–42%[14] |
| 2012 | President | Obama 62%–36%[15] |
| 2013 | Governor | McAuliffe 60%–35%–5%[16] |
| Lieutenant Governor | Northam 65%–34%[17] | |
| Attorney General | Herring 63%–37%[18] | |
| 2014 | Senator | Warner 59%–38%[19] |
| 2016 | President | Clinton 66%–27%[20] |
| 2018 | Senator | Kaine 73%–25%[21] |
| 2020 | President | Biden 70%–28%[22] |
List of members representing the district[]
| Representative | Party | Years | Cong ress |
Electoral history |
|---|---|---|---|---|
| District created March 4, 1793 | ||||
 Josiah Parker |
Pro-Administration | March 4, 1793 – March 3, 1795 |
3rd 4th 5th 6th |
Redistricted from the 8th district and re-elected in 1793. Re-elected in 1795. Re-elected in 1797. Re-elected in 1799. Lost re-election. |
| Federalist | March 4, 1795 – March 3, 1801 | |||
 Thomas Newton Jr. |
Democratic-Republican | March 4, 1801 – March 3, 1803 |
7th | Elected in 1801. Redistricted to the 20th district. |
| Anthony New | Democratic-Republican | March 4, 1803 – March 3, 1805 |
8th | Redistricted from the 16th district and re-elected in 1803. Retired. |
| James M. Garnett | Democratic-Republican | March 4, 1805 – March 3, 1809 |
9th 10th |
Elected in 1805. Re-elected in 1807. Retired. |
| John Roane | Democratic-Republican | March 4, 1809 – March 3, 1813 |
11th 12th |
Elected in 1809. Re-elected in 1811. Redistricted to the 12th district. |
| John Dawson | Democratic-Republican | March 4, 1813 – March 31, 1814 |
13th | Redistricted from the 10th district and re-elected in 1813. Died. |
| Vacant | March 31, 1814 – September 19, 1814 |
|||
 Philip P. Barbour |
Democratic-Republican[a] | September 19, 1814 – March 3, 1825 |
13th 14th 15th 16th 17th 18th |
Elected in June 1814 to finish Dawson's term and seated September 19, 1814. Re-elected in 1815. Re-elected in 1817. Re-elected in 1819. Re-elected in 1821. Retired. |
| Robert Taylor | Anti-Jacksonian | March 4, 1825 – March 3, 1827 |
19th | Elected in 1825. Retired. |
Philip P. Barbour |
Jacksonian | March 4, 1827 – October 15, 1830 |
20th 21st |
Elected in 1827. Re-elected in 1829. Resigned to become U.S. Circuit Court judge. |
| Vacant | October 16, 1830 – November 24, 1830 |
21st | ||
 John M. Patton |
Jacksonian | November 25, 1830 – March 3, 1833 |
21st 22nd |
Elected to finish Barbour's term Re-elected in 1831. Redistricted to the 13th district. |
 Andrew Stevenson |
Jacksonian | March 4, 1833 – June 2, 1834 |
23rd | Elected in 1833. Resigned. |
| Vacant | June 3, 1834 – December 7, 1834 |
|||
| John Robertson | Anti-Jacksonian | December 8, 1834 – March 3, 1837 |
23rd 24th 25th |
Re-elected in 1835. Re-elected in 1837. Retired. |
| Whig | March 4, 1837 – March 3, 1839 | |||
 John M. Botts |
Whig | March 4, 1839 – March 3, 1843 |
26th 27th |
Elected in 1839. Re-elected in 1841. Lost re-election. |
| William Taylor | Democratic | March 4, 1843 – January 17, 1846 |
28th 29th |
Elected in 1843. Re-elected in 1845. Died. |
| Vacant | January 18, 1846 – March 5, 1846 |
29th | ||
 James McDowell |
Democratic | March 6, 1846 – March 3, 1851 |
29th 30th 31st |
Re-elected in 1847. Re-elected in 1849. Retired. |
 John Letcher |
Democratic | March 4, 1851 – March 3, 1853 |
32nd | Elected in 1851. Redistricted to the 9th district. |
| John F. Snodgrass | Democratic | March 4, 1853 – June 5, 1854 |
33rd | Elected in 1853. Died. |
| Vacant | June 6, 1854 – December 3, 1854 |
|||
 Charles S. Lewis |
Democratic | December 4, 1854 – March 3, 1855 |
Lost re-election. | |
 John S. Carlile |
American | March 4, 1855 – March 3, 1857 |
34th | Elected in 1855. Lost re-election. |
 Albert G. Jenkins |
Democratic | March 4, 1857 – March 3, 1861 |
35th 36th |
Elected in 1857. Re-elected in 1859. Resigned (Civil War). |
John S. Carlile |
Unionist | March 4, 1861 – July 9, 1861 |
37th | Elected in 1861. Resigned to become U.S. Senator. |
| Vacant | July 10, 1861 – December 1, 1861 |
|||
 Jacob B. Blair |
Unionist | December 2, 1861 – March 3, 1863 |
Elected to finish Carlile's term Retired. | |
| District eliminated March 3, 1863 | ||||
| District recreated January 3, 1993 | ||||
 Leslie Byrne |
Democratic | January 3, 1993 – January 3, 1995 |
103rd | Elected in 1992. Lost re-election. |
 Tom Davis |
Republican | January 3, 1995 – November 24, 2008 |
104th 105th 106th 107th 108th 109th 110th |
Elected in 1994. Re-elected in 1996. Re-elected in 1998. Re-elected in 2000. Re-elected in 2002. Re-elected in 2004. Re-elected in 2006. Retired and then resigned. |
| Vacant | November 24, 2008 – January 3, 2009 |
110th | ||
 Gerry Connolly |
Democratic | January 3, 2009 – present |
111th 112th 113th 114th 115th 116th 117th |
Elected in 2008. Re-elected in 2010. Re-elected in 2012. Re-elected in 2014. Re-elected in 2016. Re-elected in 2018. Re-elected in 2020. |
Historical district boundaries[]

See also[]
- Virginia's congressional districts
- List of United States congressional districts
- Virginia's 11th congressional district election, 2010
Notes[]
- ^ Supported the Crawford faction in the 1824 United States presidential election
References[]
- ^ https://www.census.gov/geo/maps-data/data/cd_state.html
- ^ "My Congressional District".
- ^ "My Congressional District".
- ^ "Introducing the 2021 Cook Political Report Partisan Voter Index". The Cook Political Report. April 15, 2021. Retrieved July 30, 2021.
- ^ Barr, Andy (February 28, 2006). "Washington Area Tops List for Income". The Hill. Capitol Hill Publishing Corp. Archived from the original on May 8, 2006. Retrieved June 7, 2009.
- ^ "Virginia Census Viewer". Census Viewer. Retrieved April 13, 2016.
- ^ "November 2, 2010 General and Special Elections Unofficial Results as of November 5, 2010". Virginia State Board of Elections. Archived from the original on November 3, 2010. Retrieved November 9, 2010.
- ^ "Archived copy". Archived from the original on November 7, 2014. Retrieved November 27, 2014.
{{cite web}}: CS1 maint: archived copy as title (link) - ^ "2016 November General Congress". Virginia State Board of Elections. Retrieved November 26, 2016.
- ^ "2018 November General".
- ^ https://www.nytimes.com/interactive/2020/11/03/us/elections/results-virginia-house-district-11.html
- ^ Virginia Department of Elections: Election Results. Accessed June 1 ,2017.
- ^ "Official Results/President". Commonwealth of Virginia/November 2nd – General Election. Virginia State Board of Elections. Archived from the original on December 28, 2012.
- ^ "President>President And Vice President>Votes By District". November 2008 Official Results. Virginia State Board of Elections. Archived from the original on March 4, 2016.
- ^ "President>President And Vice President>Votes By District". November 6, 2012 General Election Official Results. Virginia State Board of Elections. Archived from the original on August 9, 2016.
- ^ "Governor>Votes by District". November 2013 General Election Official Results. Virginia State Board of Elections. Retrieved July 5, 2020.
- ^ "Lieutenant Governor>Votes by District". November 2013 General Election Official Results. Virginia State Board of Elections. Retrieved July 5, 2020.
- ^ "Attorney General>Votes by District". November 2013 General Election Official Results. Virginia State Board of Elections. Retrieved July 5, 2020.
- ^ "Turnout by Congressional District". The Virginia Public Access Project. Retrieved July 4, 2020.
- ^ "2016 November General President". Retrieved October 1, 2020.
- ^ "2018 U.S. Senate Results by Congressional District". The Virginia Public Access Project. Retrieved June 16, 2018.
- ^ https://www.dailykos.com/stories/2012/11/19/1163009/-Daily-Kos-Elections-presidential-results-by-congressional-district-for-the-2012-2008-elections
- Martis, Kenneth C. (1989). The Historical Atlas of Political Parties in the United States Congress. New York: Macmillan Publishing Company.
- Martis, Kenneth C. (1982). The Historical Atlas of United States Congressional Districts. New York: Macmillan Publishing Company.
- Congressional Biographical Directory of the United States 1774–present
External links[]
- Rep. Gerry Connolly's Official Website
- Eleventh Congressional District Democratic Committee official website
- Eleventh Congressional District Republican Committee official website
Coordinates: 38°47′18″N 77°17′41″W / 38.78833°N 77.29472°W

- Congressional districts of Virginia
- 1793 establishments in Virginia
- Constituencies established in 1793
- Constituencies disestablished in 1863
- 1863 disestablishments in Virginia
- Constituencies established in 1993
- 1993 establishments in Virginia