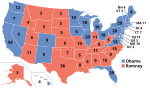
The 2012 United States presidential election in Kansas took place on November 6, 2012, as part of the 2012 United States presidential election in which all 50 states plus the District of Columbia participated. Kansas voters chose six electors to represent them in the Electoral College via a popular vote pitting incumbentDemocraticPresidentBarack Obama and his running mate, Vice PresidentJoe Biden, against Republican challenger and former Massachusetts GovernorMitt Romney and his running mate, CongressmanPaul Ryan. Romney and Ryan carried the state with 59.66% of the popular vote to Obama's and Biden's 38.05%, thus winning the state's six electoral votes.[1]
Obama carried only two counties: Douglas, home to Lawrence and the University of Kansas; and Wyandotte, home to Kansas City and the state's largest concentration of nonwhite voters. He lost Crawford County, home to Pittsburg State University, which he won in 2008.
No major Democratic candidate challenged President Obama for the Democratic nomination in 2012. Obama thus won all 517 votes at the State Convention on June 9 and all 53 delegates.
The Republican caucuses were held on Saturday, March 10, 2012.[2][3] Kansas has 40 delegates to the 2012 Republican National Convention. 25 of these delegates are allocated proportionally to candidates who exceed a 20% threshold in the statewide vote tally. The 15 remaining delegates are 'winner-take-all' delegates. 12 delegates are given (3 each) to the candidates with most votes in each of Kansas's 4 congressional districts. 3 delegates are awarded to the candidate with most votes statewide.[4]
Rick Santorum won the caucus and will receive 33 delegates. He won the state with 51% of the statewide vote and received most votes in all of the congressional districts, thus winning 15 delegates. As only Santorum and Mitt Romney exceeded the 20% threshold, 18 of the 25 proportionally allocated delegates were allocated to Santorum and 7 to Romney.
2012 Kansas Republican caucuses
Candidate
Votes
Percentage
Delegates
Rick Santorum
15,290
51.2%
33
Mitt Romney
6,250
20.9%
7
Newt Gingrich
4,298
14.4%
0
Ron Paul
3,767
12.6%
0
Uncommitted
122
0.4%
0
Herman Cain
39
0.1%
0
Jon Huntsman
38
0.1%
0
Rick Perry
37
0.1%
0
Michele Bachmann
16
0.1%
0
Totals
29,857
100%
0
Key:
Withdrew prior to contest
General election[]
Results[]
2012 United States presidential election in Kansas
Party
Candidate
Running mate
Votes
Percentage
Electoral votes
Republican
Mitt Romney
Paul Ryan
689,809
59.66%
6
Democratic
Barack Obama
Joe Biden
439,908
38.05%
0
Libertarian
Gary Johnson
Jim Gray
20,409
1.77%
0
Reform
Chuck Baldwin
Joseph Martin
4,990
0.43%
0
Green (Write-In)
Jill Stein
Cheri Honkala
714
0.06%
0
Constitution (Write-In)
Virgil Goode
Jim Clymer
187
0.02%
0
Justice (Write-In)
Rocky Anderson
Luis J. Rodriguez
95
0.01%
0
Peace & Freedom (Write-In)
Roseanne Barr
Cindy Sheehan
58
0.01%
0
Other Write-Ins
Other Write-Ins
84
0.01%
0
Totals
1,156,254
100.00%
6
By county[]
County
Obama%
Obama#
Romney%
Romney#
Others%
Others#
Total
Allen
35.20%
1,869
62.45%
3,316
2.35%
125
5,310
Anderson
28.48%
944
68.66%
2,276
2.87%
95
3,315
Atchison
38.46%
2,567
58.69%
3,917
2.85%
190
6,674
Barber
20.83%
482
76.58%
1,772
2.59%
60
2,314
Barton
22.21%
2,297
76.14%
7,874
1.64%
170
10,341
Bourbon
31.92%
1,996
65.59%
4,102
2.49%
156
6,254
Brown
26.95%
1,076
70.85%
2,829
2.20%
88
3,993
Butler
27.92%
7,282
69.61%
18,157
2.48%
646
26,085
Chase
28.17%
358
68.84%
875
2.99%
38
1,271
Chautauqua
17.18%
280
80.00%
1,304
2.82%
46
1,630
Cherokee
34.19%
2,930
63.66%
5,456
2.16%
185
8,571
Cheyenne
16.34%
233
81.28%
1,159
2.38%
34
1,426
Clark
17.11%
174
79.15%
805
3.74%
38
1,017
Clay
22.63%
834
75.64%
2,788
1.74%
64
3,686
Cloud
24.00%
974
72.79%
2,954
3.20%
130
4,058
Coffey
22.99%
898
74.32%
2,903
2.69%
105
3,906
Comanche
15.41%
143
82.65%
767
1.94%
18
928
Cowley
33.98%
4,319
63.58%
8,081
2.44%
310
12,710
Crawford
45.67%
6,826
51.58%
7,708
2.75%
411
14,945
Decatur
17.36%
266
79.50%
1,218
3.13%
48
1,532
Dickinson
25.12%
2,020
72.52%
5,832
2.36%
190
8,042
Doniphan
26.51%
902
70.94%
2,414
2.56%
87
3,403
Douglas
60.79%
29,267
36.14%
17,401
3.07%
1,477
48,145
Edwards
21.52%
298
76.46%
1,059
2.02%
28
1,385
Elk
20.53%
281
76.63%
1,049
2.85%
39
1,369
Ellis
26.10%
3,057
71.70%
8,399
2.20%
258
11,714
Ellsworth
25.88%
702
71.17%
1,930
2.95%
80
2,712
Finney
29.52%
2,682
68.46%
6,219
2.01%
183
9,084
Ford
31.09%
2,600
66.99%
5,602
1.91%
160
8,362
Franklin
33.61%
3,694
63.55%
6,984
2.84%
312
10,990
Geary
42.47%
3,332
55.73%
4,372
1.80%
141
7,845
Gove
12.73%
176
84.45%
1,168
2.82%
39
1,383
Graham
19.10%
256
78.81%
1,056
2.09%
28
1,340
Grant
19.77%
456
78.53%
1,811
1.69%
39
2,306
Gray
16.55%
324
81.87%
1,603
1.58%
31
1,958
Greeley
16.87%
113
81.04%
543
2.09%
14
670
Greenwood
22.52%
478
74.89%
1,590
2.59%
55
2,123
Hamilton
18.59%
163
79.02%
693
2.39%
21
877
Harper
23.02%
550
73.63%
1,759
3.35%
80
2,389
Harvey
37.59%
5,373
60.08%
8,588
2.33%
333
14,294
Haskell
15.40%
215
83.02%
1,159
1.58%
22
1,396
Hodgeman
16.89%
179
81.89%
868
1.23%
13
1,060
Jackson
34.18%
1,901
63.42%
3,527
2.39%
133
5,561
Jefferson
37.15%
2,977
60.24%
4,827
2.61%
209
8,013
Jewell
15.30%
229
82.50%
1,235
2.20%
33
1,497
Johnson
40.18%
110,526
57.58%
158,401
2.23%
6,147
275,074
Kearny
19.34%
268
79.15%
1,097
1.52%
21
1,386
Kingman
22.69%
733
74.19%
2,397
3.13%
101
3,231
Kiowa
14.25%
163
85.31%
976
.44%
5
1,144
Labette
38.78%
3,117
59.00%
4,742
2.21%
178
8,037
Lane
18.53%
172
79.63%
739
1.83%
17
928
Leavenworth
39.05%
11,357
58.65%
17,059
2.30%
669
29,085
Lincoln
19.49%
289
78.56%
1,165
1.96%
29
1,483
Linn
26.19%
1,170
71.12%
3,177
2.69%
120
4,467
Logan
14.59%
197
83.41%
1,126
2.0%
27
1,350
Lyon
43.04%
5,111
54.48%
6,470
2.48%
294
11,875
Marion
25.61%
1,385
71.90%
3,889
2.50%
135
5,409
Marshall
30.78%
1,469
66.94%
3,195
2.28%
109
4,773
McPherson
28.05%
3,449
69.49%
8,545
2.46%
303
12,297
Meade
15.10%
258
83.56%
1,428
1.35%
23
1,709
Miami
31.72%
4,712
66.36%
9,858
1.93%
286
14,856
Mitchell
19.70%
584
78.48%
2,327
1.82%
54
2,965
Montgomery
28.20%
3,501
69.50%
8,630
2.30%
286
12,417
Morris
28.02%
718
69.20%
1,773
2.77%
71
2,562
Morton
14.79%
189
83.88%
1,072
1.33%
17
1,278
Nemaha
19.90%
1,000
78.19%
3,930
1.91%
96
5,026
Neosho
31.64%
2,050
65.93%
4,272
2.44%
158
6,480
Ness
15.10%
218
83.73%
1,209
1.18%
17
1,444
Norton
17.12%
398
80.77%
1,878
2.11%
49
2,325
Osage
32.84%
2,268
64.10%
4,427
3.06%
211
6,906
Osborne County
17.63%
324
80.47%
1,479
1.90%
35
1,838
Ottawa
19.02%
558
78.25%
2,295
2.73%
80
2,933
Pawnee
27.53%
718
70.40%
1,836
2.07%
54
2,608
Phillips
14.89%
382
83.24%
2,135
1.87%
48
2,565
Pottawatomie
24.63%
2,335
71.78%
6,804
3.59%
340
9,479
Pratt
25.78%
980
72.90%
2,771
1.32%
50
3,801
Rawlins
13.16%
190
84.70%
1,223
2.15%
31
1,444
Reno
33.11%
8,085
64.36%
15,718
2.53%
619
24,422
Republic
17.76%
477
79.45%
2,134
2.79%
75
2,686
Rice
24.75%
911
72.70%
2,676
2.55%
94
3,681
Riley
42.54%
8,977
54.53%
11,507
2.92%
617
21,101
Rooks
14.67%
361
82.85%
2,038
2.48%
61
2,460
Rush
23.38%
367
74.27%
1,166
2.36%
37
1,570
Russell
18.53%
593
79.78%
2,553
1.69%
54
3,200
Saline
32.75%
7,040
64.38%
13,840
2.87%
616
21,496
Scott
13.50%
277
84.21%
1,728
2.29%
47
2,052
Sedgwick
40.13%
71,977
59.38%
106,506
.50%
891
179,374
Seward
28.79%
1,490
69.88%
3,617
1.33%
69
5,176
Shawnee
48.33%
36,975
49.38%
37,782
2.29%
1,754
76,511
Sheridan
12.52%
168
85.99%
1,154
1.49%
20
1,342
Sherman
22.00%
577
75.33%
1,976
2.67%
70
2,623
Smith
17.70%
358
80.28%
1,624
2.03%
41
2,023
Stafford
21.97%
404
75.31%
1,385
2.72%
50
1,839
Stanton
18.84%
143
79.71%
605
1.45%
11
759
Stevens
12.39%
252
85.99%
1,749
1.62%
33
2,034
Sumner
29.08%
2,658
68.48%
6,260
2.44%
223
9,141
Thomas
17.21%
598
80.25%
2,788
2.53%
88
3,474
Trego
18.43%
291
79.86%
1,261
1.71%
27
1,579
Wabaunsee
28.10%
918
69.05%
2,256
2.85%
93
3,267
Wallace
08.52%
68
90.10%
719
1.38%
11
798
Washington
18.14%
524
80.17%
2,316
1.70%
49
2,889
Wichita
15.91%
157
83.18%
821
.91%
9
987
Wilson
22.01%
818
76.00%
2,825
1.99%
74
3,717
Woodson
26.26%
380
71.53%
1,035
2.21%
32
1,447
Wyandotte
67.61%
34,302
30.54%
15,496
1.85%
940
50,738
Counties that flipped from Democratic to Republican[]