Election in Minnesota
Main article: 2012 United States presidential election
2012 United States presidential election in Minnesota Turnout 76.42%[1]
Nominee
Barack Obama Mitt Romney
Party
Democratic (DFL)
Republican
Home state
Illinois
Massachusetts
Running mate
Joe Biden Paul Ryan
Electoral vote
10
0
Popular vote
1,546,167
1,320,225
Percentage
52.65%
44.96%
County Results
Obama
40-50%
50-60%
60-70%
Romney
40-50%
50-60%
60-70%
President before election Barack Obama Democratic
Elected President Barack Obama Democratic
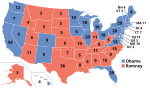
The 2012 United States presidential election in Minnesota took place on November 6, 2012, as part of the 2012 United States presidential election in which all 50 states plus the District of Columbia participated. State voters chose ten electors to represent them in the Electoral College via a popular vote pitting incumbent Democratic President Barack Obama and his running mate, Vice President Joe Biden , against Republican challenger and former Massachusetts Governor Mitt Romney and his running mate, Congressman Paul Ryan .
Minnesota backed Obama for re-election, giving him 52.65% of the vote, while Republican challenger Mitt Romney took 44.96%, a victory margin of 7.69%. With ten Democratic wins in a row, Minnesota has the longest current streak of voting for the Democratic candidate in presidential elections of any state, having not voted Republican since Richard Nixon in 1972 . This is the longest streak for the Democrats in history amongst non-Southern states.[2]
However, Romney was able to significantly improve on McCain's performance in the North Star State, as he did nationally. Fourteen counties which voted for Obama in 2008 flipped and voted for the Republican Party in 2012, while many Democratic counties had a margin of victory much narrower than in 2008. Many of these counties had not voted for a Republican in decades, such as Big Stone County which only voted for a Republican only once since 1952 for Dwight D. Eisenhower until this election. [3]
As of the 2020 election, this is the most recent time the Democratic candidate won the following counties: Beltrami ,
Chippewa , Fillmore , Freeborn , Houston , Itasca , Kittson , Koochiching , Lac qui Parle , Mahnomen , Mower , Norman , Rice , Swift , and Traverse . It is also, to date, the most recently that Minnesota voted to the left of Colorado and Virginia, two former Republican strongholds that rapidly transitioned to being reliably blue in the 2010s.
Democratic caucuses [ ] 2012 Minnesota Democratic presidential caucus
Candidate
Barack Obama
Home state
Illinois
Delegate count
91
Popular vote
16,733
Percentage
96.3%
Minnesota results by county
Barack Obama
No votes
2012 Minnesota Democratic caucus[4]
Candidate
Votes
Percentage
Delegates
Barack Obama
16,733
96.30%
91
Uncommited
643
3.70%
0
Republican caucuses [ ] 2012 Minnesota Republican presidential caucus
Candidate
Rick Santorum Ron Paul
Home state
Pennsylvania
Texas
Popular vote
21,988
13,282
Percentage
44.95%
27.15%
Candidate
Mitt Romney
Newt Gingrich
Home state
Massachusetts
Georgia
Popular vote
8,240
5,263
Percentage
16.85%
10.76%
Minnesota results by county
Rick Santorum
Ron Paul
Tie
The Republican caucuses were held on February 7, 2012.[5] Colorado Republican caucuses as well as the Missouri Republican primary . Minnesota has a total of 40 delegates, 37 of which are tied to the caucuses while 3 are unpledged RNC delegates. The non-binding straw poll was won by Rick Santorum , but Ron Paul won 32 of the 40 delegates to the Republican National Convention .
Results with 100.0% (4,137 of 4,137 precincts) reporting:
Election Reporting[6] [7] [8] [9] [10]
Candidate
Votes
Delegates
Total
Percentage
Total
Percentage
Rick Santorum
21,988
44.95%
2
5%
Ron Paul 13,282
27.15%
32
80%
Mitt Romney
8,240
16.85%
1
2.5%
Newt Gingrich
5,263
10.76%
0
0%
Write-in
143
0.29%
0
0%
Unpledged delegates:
5
12.5%
Total:
48,916
100.0%
40
100.0%
Conventions [ ] There is no formal system of allocating delegates to candidates in any step of the election process. At each meeting the participants decides what the best course of action is. The state convention can vote to bind the 13 at-large delegates to a candidate. The 24 delegates elected at the CD conventions and the 3 automatic (RNC) delegates are not legally bound to vote for a candidate.
17 February - 31 March: BPOU conventions elect delegates to the state convention and the congressional district conventions.
14–21 April: Eight congressional conventions elect 3 National Convention delegates each.
18–19 May: State convention elect 13 National Convention delegates.[11]
Convention Results[7] [9] [10]
Candidate
1st
2nd
3rd
4th
5th
6th
7th
8th
State
Party
Total
Ron Paul
2
3
3
3
3
3
1
2
12
0
32
Rick Santorum
0
0
0
0
0
0
2
0
0
0
2
Mitt Romney
0
0
0
0
0
0
0
0
1
0
1
Unknown
1
1
3
5
Total
24
13
3
40
General election [ ] Results [ ]
2012 United States presidential election in Minnesota[12]
Party
Candidate
Running mate
Votes
Percentage
Electoral votes
Democratic Barack Obama Joe Biden 1,546,167
52.65%
10
Republican
Mitt Romney
Paul Ryan
1,320,225
44.96%
0
Libertarian
Gary Johnson
Jim Gray
35,098
1.20%
0
Green
Jill Stein
Cheri Honkala
13,023
0.44%
0
Constitution
Virgil Goode
Jim Clymer
3,722
0.13%
0
Grassroots
Jim Carlson
George McMahon
3,149
0.11%
0
Justice
Rocky Anderson
Luis J. Rodriguez
1,996
0.07%
0
Constitutional Government
Dean Morstad
Josh Franke-Hyland
1,092
0.04%
0
Socialist Workers
James Harris
Maura DeLuca
1,051
0.04%
0
Socialism and Liberation
Peta Lindsay
Yari Osorio
397
0.01%
0
Write-Ins
10,641
0.36%
0
Totals
2,936,561
100.00%
10
Voter turnout (eligible voters)
75.74%
By county [ ]
County
Obama %
Obama Votes
Romney %
Romney Votes
Others %
Others Votes
Total Votes
Aitkin 48.26%
4,412
49.58% 4,533 2.15%
197
9,142
Anoka 47.52%
88,611
50.11% 93,430 2.37%
4,420
186,461
Becker 41.69%
6,829
56.18% 9,204 2.13%
349
16,382
Beltrami 53.59% 11,818 43.70%
9,637
2.70%
596
22,051
Benton 41.66%
8,173
55.30% 10,849 3.04%
597
19,619
Big Stone 48.23%
1,345
49.66% 1,385 2.12%
59
2,789
Blue Earth 53.00% 18,164 43.52%
14,916
3.48%
1,194
34,274
Brown 40.42%
5,630
56.99% 7,938 2.59%
361
13,929
Carlton 61.78% 11,389 35.72%
6,586
2.50%
461
18,436
Carver 39.22%
20,745
58.90% 31,155 1.89%
999
52,899
Cass 42.49%
6,858
55.49% 8,957 2.02%
326
16,141
Chippewa 49.72% 3,083 47.85%
2,967
2.44%
151
6,201
Chisago 42.54%
12,524
55.12% 16,227 2.34%
690
29,441
Clay 52.65% 15,208 44.73%
12,920
2.62%
758
28,886
Clearwater 41.77%
1,753
56.21% 2,359 2.03%
85
4,197
Cook 59.99% 1,993 36.75%
1,221
3.25%
108
3,322
Cottonwood 41.50%
2,433
56.57% 3,316 1.93%
113
5,862
Crow Wing 42.27%
14,760
55.60% 19,415 2.13%
745
34,920
Dakota 50.37% 116,252 47.45%
109,514
2.19%
5,049
230,815
Dodge 43.46%
4,487
53.48% 5,522 3.06%
316
10,325
Douglas 41.29%
8,665
56.73% 11,905 1.98%
416
20,986
Faribault 44.17%
3,407
53.21% 4,104 2.62%
202
7,713
Fillmore 52.45% 5,713 45.11%
4,913
2.44%
266
10,892
Freeborn 55.82% 9,326 41.72%
6,969
2.46%
411
16,706
Goodhue 47.33%
12,212
50.33% 12,986 2.34%
603
25,801
Grant 47.23%
1,647
50.13% 1,748 2.64%
92
3,487
Hennepin 62.34% 423,979 35.30%
240,073
2.35%
16,007
680,059
Houston 50.56% 5,281 47.40%
4,951
2.05%
214
10,446
Hubbard 40.59%
4,676
57.48% 6,622 1.93%
222
11,520
Isanti 39.69%
8,024
57.75% 11,675 2.56%
518
20,217
Itasca 53.73% 12,852 43.90%
10,500
2.37%
566
23,918
Jackson 41.77%
2,268
56.06% 3,044 2.17%
118
5,430
Kanabec 44.09%
3,593
53.10% 4,328 2.81%
229
8,150
Kandiyohi 45.68%
9,806
52.36% 11,239 1.96%
420
21,465
Kittson 51.32% 1,241 45.29%
1,095
3.39%
82
2,418
Koochiching 53.44% 3,451 43.99%
2,841
2.57%
166
6,458
Lac Qui Parle 49.55% 1,974 48.64%
1,938
1.81%
72
3,984
Lake 59.31% 4,043 38.29%
2,610
2.41%
164
6,817
Lake of the Woods 38.45%
859
58.46% 1,306 3.09%
69
2,234
Le Sueur 45.65%
6,753
52.14% 7,714 2.21%
327
14,794
Lincoln 45.80%
1,428
51.12% 1,594 3.08%
96
3,118
Lyon 44.11%
5,465
53.23% 6,595 2.66%
329
12,389
Mahnomen 58.48% 1,276 39.92%
871
1.60%
35
2,182
Marshall 42.53%
1,998
54.68% 2,569 2.79%
131
4,698
Martin 36.96%
4,054
60.69% 6,657 2.34%
257
10,968
McLeod 37.56%
6,968
59.66% 11,069 2.78%
516
18,553
Meeker 40.68%
4,969
56.60% 6,913 2.72%
332
12,214
Mille Lacs 44.53%
5,829
53.10% 6,951 2.38%
311
13,091
Morrison 36.81%
6,153
60.78% 10,159 2.41%
402
16,714
Mower 60.03% 11,129 37.42%
6,938
2.55%
472
18,539
Murray 45.31%
2,160
52.53% 2,504 2.16%
103
4,767
Nicollet 52.58% 9,652 44.75%
8,214
2.67%
491
18,357
Nobles 44.52%
3,793
53.77% 4,581 1.71%
146
8,520
Norman 53.94% 1,730 43.16%
1,384
2.90%
93
3,207
Olmsted 50.23% 39,338 47.03%
36,832
2.74%
2,146
78,316
Otter Tail 38.41%
12,165
59.55% 18,860 2.04%
645
31,670
Pennington 46.41%
3,024
50.71% 3,304 2.89%
188
6,516
Pine 48.34%
6,750
49.02% 6,845 2.65%
370
13,965
Pipestone 37.13%
1,725
60.83% 2,826 2.04%
95
4,646
Polk 46.10%
6,773
51.83% 7,615 2.08%
305
14,693
Pope 47.73%
2,981
50.30% 3,142 1.97%
123
6,246
Ramsey 66.33% 184,936 31.13%
86,799
2.54%
7,086
278,821
Red Lake 46.99%
928
49.52% 978 3.49%
69
1,975
Redwood 38.61%
3,008
58.66% 4,570 2.72%
212
7,790
Renville 44.02%
3,394
53.81% 4,149 2.17%
167
7,710
Rice 52.85% 17,054 44.58%
14,384
2.57%
829
32,267
Rock 40.16%
1,946
57.99% 2,810 1.86%
90
4,846
Roseau 37.70%
2,772
59.97% 4,409 2.33%
171
7,352
Saint Louis 63.48% 73,378 33.85%
39,131
2.67%
3,085
115,594
Scott 41.47%
29,712
56.28% 40,323 2.25%
1,612
71,647
Sherburne 37.84%
17,597
59.88% 27,848 2.29%
1,064
46,509
Sibley 37.31%
2,916
60.05% 4,693 2.64%
206
7,815
Stearns 42.75%
33,551
54.81% 43,015 2.44%
1911
78,477
Steele 45.52%
8,706
51.78% 9,903 2.69%
515
19,124
Stevens 48.51%
2,742
48.94% 2,766 2.55%
144
5,652
Swift 53.74% 2,751 43.91%
2,248
2.34%
120
5,119
Todd 40.83%
4,819
56.93% 6,719 2.25%
265
11,803
Traverse 51.06% 942 46.61%
860
2.33%
43
1,845
Wabasha 46.03%
5,415
51.42% 6,049 2.54%
299
11,763
Wadena 36.70%
2,492
61.02% 4,143 2.28%
155
6,790
Waseca 44.83%
4,370
52.49% 5,116 2.68%
261
9,747
Washington 49.39% 70,203 48.64%
69,137
1.97%
2,793
142,133
Watonwan 48.48%
2,494
48.93% 2,517 2.59%
133
5,144
Wilkin 39.04%
1,258
58.47% 1,884 2.48%
80
3,222
Winona 55.01% 14,980 42.16%
11,480
2.83%
772
27,232
Wright 37.95%
25,739
59.67% 40,468 2.37%
1,609
67,816
Yellow Medicine 45.53%
2,465
51.83% 2,806 2.64%
143
5,414
Minnesota Total 52.65% 1,546,021 44.95% 1,320,048 2.38% 70,139 2,936,208
Counties that flipped from Democratic to Republican [ ] Aitkin (largest city: Aitkin )Big Stone (largest city: Ortonville )Grant (largest city: Elbow Lake )Lincoln (largest city: Tyler )Marshall (largest city: Warren )Murray (largest city: Slayton )Pennington (largest city: Thief River Falls )Pine (largest city: Pine City )Polk (largest city: East Grand Forks )Pope (largest city: Glenwood )Red Lake (largest city: Red Lake Falls )Stevens (largest city: Morris )Watonwan (largest city: St. James )Yellow Medicine (largest city: Granite Falls )See also [ ] References [ ]
^ "Office of the State Of Minnesota Secretary of State" . www.sos.state.mn.us . Retrieved 2017-07-22 .^ "Will Vermont's 27-Cycle GOP Presidential Streak Ever Be Broken?" . Smart Politics . 2012-04-30. Retrieved 2021-06-22 .^ "Dave Leip's Atlas of U.S. Presidential Elections" . uselectionatlas.org . Retrieved 2020-09-02 .^ "Presidential Preference by County" . Minnesota Secretary of State. Archived from the original on 2016-10-09. Retrieved 2016-10-07 .^ Scheck, Tom (September 30, 2011). "MNGOP keeping Feb. 7 Caucus date" . Capitol View . Minnesota Public Radio. ^ "Election Reporting System: Statewide Results for Republican Party" . Minnesota Secretary of State. Retrieved March 1, 2012 .^ a b "Paul supporters chosen as delegates in three congressional districts" . Pierce County Herald . April 15, 2012. Archived from the original on April 19, 2012. Retrieved April 17, 2012 .^ Anderson, Pat (21 April 2012). "Ron Paul gets 20/24 Congressional District delegates. CD4 3, CD2 3, CD8 2, CD1 2 #mngop #mnleg" . twitter.com . Twitter. Retrieved 22 April 2012 . ^ a b "Rep. Paul supporters elected to half of Minnesota GOP convention delegation" . Pierce County Herald . April 22, 2012. Archived from the original on April 25, 2012. Retrieved April 22, 2012 .^ a b "Ron Paul Wins Minnesota State Convention" . Retrieved 20 May 2012 .^ "Republican Party of Minnesota Events" . Archived from the original on 17 May 2012. Retrieved 4 May 2012 .^ "Minnesota Secretary of State" . Archived from the original on 2012-11-10. Retrieved 2012-11-10 .
External links [ ]
State and district results of the 2012 United States presidential election
State elections
Executive elections
Legislative elections
Senate elections House of Representatives elections
Ballot questions
Special elections
Senate House of Representatives
Municipal elections
Minneapolis
General elections Mayoral elections City Council elections
Saint Paul
Mayoral elections
2001 2005 2009 2013 2017 2021
United States presidential primaries and caucuses
Election timelines National polling
Democratic Party
2008 2016 2020 Republican Party
2008 2012 2016 2020 State polling
Democratic Party
2004 2008 2016 2020 Republican Party
2008 2012 2016 2020 Fundraising Debates and forums
Democratic Party 2004 2008 2016 2020
debates forums Republican Party 2008 2012 2016 2020 Libertarian Party
2016 Green Party
2016 Straw polls Major events
Iowa caucuses New Hampshire primary Nevada caucuses South Carolina primary Super Tuesday Caucuses primaries
Democratic Party
1912 1916 1920 1924 1928 1932 1936 1940 1944 1948 1952 1956 1960 1964 1968 1972 1976 1980 1984 1988 1992 1996 2000 2004 2008 2012 2016 2020 Republican Party
1912 1916 1920 1924 1928 1932 1936 1940 1944 1948 1952 1956 1960 1964 1968 1972 1976 1980 1984 1988 1992 1996 2000 2004 2008 2012 2016 2020 Libertarian Party Green Party Reform Party
1996 2000 2004 2008 2012 2016 2020 Constitution Party
Results breakdown
List of candidates by number of primary votes Democratic Party
2008 2016 2020 Republican Party
2008 2012 2016 2020 National
Reforms
(← 2008 ) 2012 United States presidential election (2016 → )
Democratic Party
Candidates
Incumbent nominee: Barack Obama
campaign endorsements positions Incumbent VP nominee: Joe Biden
Challengers
Bob Ely Keith Judd Warren Mosler Vermin Supreme Randall Terry John Wolfe
Republican Party
Candidates
Nominee: Mitt Romney
campaign endorsements positions VP nominee: Paul Ryan
Other candidates
Michele Bachmann
campaign Herman Cain
campaign positions Mark Callahan Jack Fellure Newt Gingrich
campaign positions Stewart Greenleaf Jon Huntsman
campaign Gary Johnson
campaign Fred Karger Andy Martin Thaddeus McCotter
campaign Jimmy McMillan Roy Moore Ron Paul
campaign positions Tim Pawlenty
campaign Rick Perry
campaign positions Buddy Roemer
campaign Rick Santorum
campaign
Libertarian Party
Candidates
Nominee: Gary Johnson
VP nominee: Jim Gray Other candidates
Carl Person Sam Sloan R. Lee Wrights
Green Party
Candidates
Nominee: Jill Stein
VP nominee: Cheri Honkala Other candidates: Stewart Alexander Roseanne Barr
Other third-party and independent candidates
American Independent Party
Nominee: Tom Hoefling Other candidates: Wiley Drake
Virgil Goode
Edward C. Noonan Laurie Roth American Third Position Party
Nominee: Merlin Miller VP nominee: Virginia Abernethy Constitution Party
Convention Nominee: Virgil Goode
VP nominee: Jim Clymer Other candidates: Laurie Roth Robby Wells Freedom Socialist Party Grassroots Party Justice Party
Nominee: Rocky Anderson VP nominee: Luis J. Rodriguez Socialism and Liberation Peace and Freedom Party
Nominee: Roseanne Barr VP nominee: Cindy Sheehan Other candidates: Stewart Alexander Rocky Anderson Peta Lindsay Prohibition Party
Nominee: Jack Fellure Other candidates: James Hedges Reform Party
Nominee: Andre Barnett Other candidates: Laurence Kotlikoff Buddy Roemer
Robby Wells Socialist Equality Party Socialist Workers Party Socialist Party
Nominee: Stewart Alexander
VP nominee: Alejandro Mendoza Independents and others
Objectivist Party
Tom Stevens Independents
Lee Abramson Randy Blythe Jeff Boss Robert Burck Terry Jones Joe Schriner Michael Bloomberg
attempt to draft
Other 2012 elections :House Senate Gubernatorial