2016 United States presidential election in Minnesota
| ||||||||||||||||||||||||||
| Turnout | 74.72%[1] | |||||||||||||||||||||||||
|---|---|---|---|---|---|---|---|---|---|---|---|---|---|---|---|---|---|---|---|---|---|---|---|---|---|---|
| ||||||||||||||||||||||||||
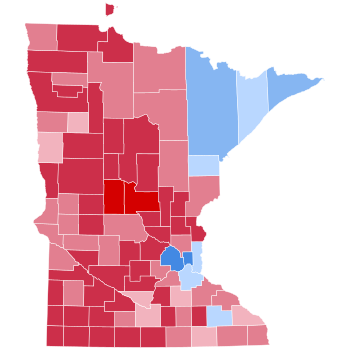 County Results
| ||||||||||||||||||||||||||
| ||||||||||||||||||||||||||

| Elections in Minnesota |
|---|
 |
|

The 2016 United States presidential election in Minnesota was held on Tuesday, November 8, 2016, as part of the 2016 United States presidential election in which all 50 states plus the District of Columbia participated. Minnesota voters chose electors to represent them in the Electoral College via a popular vote, pitting the Republican Party's nominee, businessman Donald Trump, and running mate Indiana Governor Mike Pence against Democratic Party nominee, former Secretary of State Hillary Clinton, and her running mate Virginia Senator Tim Kaine. Minnesota has ten electoral votes in the Electoral College.[2]
Minnesota was won with a plurality by Clinton and a 1.52% margin, the eleventh consecutive Democratic presidential win in the state, which has not voted for a Republican since Richard Nixon in 1972. However, this was the closest presidential election in Minnesota since 1984, when Walter Mondale carried the state by a 0.18% margin, and it became the only state that was not carried by Ronald Reagan that year. The state also voted more Republican than the national average for the first time since 1952, with Trump flipping nineteen counties to Republican. Minnesota had the highest voter turnout in the nation, with approximately 75 percent of the state's eligible voters participating in the general election.[1] Through her narrow victory, Clinton won all ten of Minnesota's electoral votes; one elector, Muhammud Abdurrahan, tried to vote for Senator Bernie Sanders of Vermont but was replaced with an elector that voted for Clinton.
Caucuses[]
Democratic caucuses[]
Bernie Sanders received the most votes and the most delegates in the precinct caucuses.[3] The 2016 turnout was slightly lower than the 2008 tally of 214,066, when Obama won with 142,109 votes, to Clinton's 68,994. Bernie Sanders won every congressional district in Minnesota.[4]
| Minnesota Democratic caucuses, March 1, 2016 | |||||
|---|---|---|---|---|---|
| Candidate | Popular vote | Estimated delegates | |||
| Count | Percentage | Pledged | Unpledged | Total | |
| Bernie Sanders | 126,229 | 61.69% | 46 | 1 | 47 |
| Hillary Clinton | 78,381 | 38.31% | 31 | 13 | 44 |
| Uncommitted | N/A | 0 | 2 | 2 | |
| Total | 204,610 | 100% | 77 | 16 | 93 |
| Source: The Green Papers | |||||
Republican caucuses[]
The 38 delegates from Minnesota were allocated in this way. If a candidate received more than 85% of the vote, they would get all of 38 delegates. Otherwise, 24 delegates would be allocated proportionally based on the votes per congressional district (3 votes per district). On top of that, there were 10 at-large delegates and 3 party leaders (the National Committee Man, the National Committee woman, and the chairman of the Minnesota Republican Party). All of the at-large delegates were allocated proportionally based on the popular vote with a mandatory threshold of 10% to receive any delegates; if no one got at least 10%, all candidates would be eligible to get delegates.[5]
| Candidate | Votes | Percentage | Actual delegate count | ||
|---|---|---|---|---|---|
| Bound | Unbound | Total | |||
| Marco Rubio | 41,397 | 36.24% | 17 | 0 | 17 |
| Ted Cruz | 33,181 | 29.04% | 13 | 0 | 13 |
| Donald Trump | 24,473 | 21.42% | 8 | 0 | 8 |
| Ben Carson | 8,422 | 7.37% | 0 | 0 | 0 |
| John Kasich | 6,565 | 5.75% | 0 | 0 | 0 |
| Write-ins | 207 | 0.18% | 0 | 0 | 0 |
| Jeb Bush (withdrawn) | 0 | 0 | 0 | ||
| Unprojected delegates: | 0 | 0 | 0 | ||
| Total: | 114,245 | 100.00% | 38 | 0 | 38 |
| Source: The Green Papers | |||||
Some media outlets recorded the votes by congressional district, rather than by county. Rubio won districts 1, 2, 3, 4 and 5 in the Minneapolis-Saint Paul area as well as the southern part of the state. Cruz won districts 6, 7 and 8 in the St. Cloud area and rural north.[4]
Green caucuses[]
The Green Party of Minnesota held caucuses on March 1 in Saint Paul, Minneapolis, Bemidji, White Bear Lake, Blaine, Grand Rapids, and Willmar.[6] Jill Stein won the caucuses with 84.3% of the vote. The delegates apportioned to each candidate will be decided at the state convention in St. Cloud, Minnesota in June.[7] The results of the caucuses are as follows:[8]
| Candidate | Votes | Percentage | National delegates |
|---|---|---|---|
| Jill Stein | - | 84.3% | 7 |
| Sedinam Moyowasifza-Curry | - | 5.9% | - |
| William Kreml | - | 4.8% | - |
| Darryl Cherney | - | 3.6% | - |
| Kent Mesplay | - | 1.2% | - |
| Total | - | 100.00% | 7 |
Libertarian caucuses[]
The Minnesota caucus was run on March 1, 2016, using ranked choice voting. Gary Johnson took over 75% of the 226 first-preference votes cast, with John McAfee a distant second on 11.5% and Austin Petersen third on 7.5%.[11]
| Candidate | Votes | Percentage |
|---|---|---|
| Gary Johnson | 171 | 75.66% |
| John McAfee | 26 | 11.50% |
| Austin Petersen | 17 | 7.52% |
| Darryl Perry | 4 | 1.77% |
| Cecil Ince | 2 | 0.88% |
| Steve Kerbel | 2 | 0.88% |
| None of the above | 2 | 0.88% |
| Marc Allan Feldman | 1 | 0.44% |
| Shawna Joy Sterling | 1 | 0.44% |
| Total | 226 | 100.00% |
General election[]
Predictions[]
| Source | Ranking | As of |
|---|---|---|
| Los Angeles Times[13] | Likely D | November 6, 2016 |
| CNN[14] | Safe D | November 4, 2016 |
| Cook Political Report[15] | Likely D | November 7, 2016 |
| Electoral-vote.com[16] | Lean D | November 8, 2016 |
| Rothenberg Political Report[17] | Likely D | November 7, 2016 |
| Sabato's Crystal Ball[18] | Likely D | November 7, 2016 |
| RealClearPolitics[19] | Lean D | November 8, 2016 |
| Fox News[20] | Lean D | November 7, 2016 |
Polling[]
Clinton won almost every pre-election poll in Minnesota by margins ranging from 5 to 11 points. Trump won one poll in November 2015, 45% to 42%, and one poll in September 2016 showed a tie. The average of the last two polls had Clinton up 50% to 41%.[21] The last poll had Clinton up 53% to 42%.
Candidates[]
The following had write-in status:[22]
|
|
Analysis[]
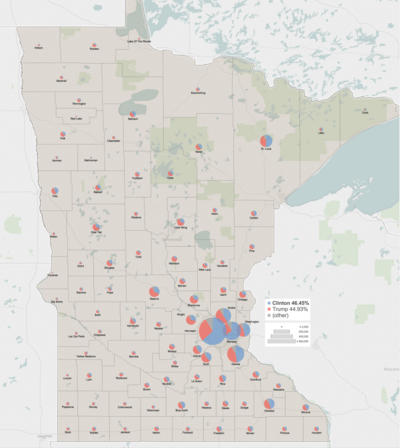
Minnesota voted 6.2 percent less Democratic from the 2012 presidential election, a much larger shift than the nation at large. Donald Trump only increased his vote tally compared to Mitt Romney in 2012 by 2,726 votes which resulted in a percentage of vote loss of 0.04%. The difference in Democratic voting was largely attributed to Independent or Write-In candidates. The most significant Independent gains went to Gary Johnson with 3.84 percent of the vote (+2.64% over 2012), Evan McMullin with 1.8 percent of the vote (he was not a candidate in 2012), and Jill Stein with 1.26 percent of the vote (+0.82% over 2012). These three candidates account for 5.26 percent of the swing. This election marked the first time since 1952 that the Democratic candidate performed worse in Minnesota than in the nation at large. Hillary Clinton won the national popular vote by 2.1 points but won Minnesota by just 1.5 points, or 44,765 votes. Minnesota has been a primarily Democratic state in national elections since 1932.
Due to Independent and Write-In gains throughout the state, Clinton was dependent on her wins in Hennepin (Minneapolis) and Ramsey (St. Paul) counties, the two most populous counties in the state, and the Arrowhead Region in the northeastern corner of the state.[23] Trump's votes came from less populated, rural counties. Two counties, Morrison and Todd, gave Trump over 70% of the vote, making this the first election since 1968 where either major party candidate won a county with over 70%, with Trump also being the first Republican since Dwight D. Eisenhower to do so since 1956.
Trump was also the first Republican to receive a majority of votes in Itasca County since Herbert Hoover in 1928,[24] the first to win Swift County since Dwight D. Eisenhower in 1952, and the first to win Mower County since Richard Nixon against John F. Kennedy in 1960. Due to the close margin of victory in the state, Republicans had targeted Minnesota as a potential swing state target for the 2020 United States presidential election.[25]
Results[]
| Candidate | Vice President | Popular vote | Percentage | Electors |
|---|---|---|---|---|
| Hillary Clinton | Tim Kaine | 1,367,825 | 46.44% | 10 |
| Donald Trump | Mike Pence | 1,323,232 | 44.93% | 0 |
| Gary Johnson | William Weld | 112,984 | 3.84% | 0 |
| Evan McMullin | Mindy Finn | 53,083 | 1.80% | 0 |
| Jill Stein | Howie Hawkins | 36,991 | 1.26% | 0 |
| Dan Vacek | Mark Elworth, Jr. | 11,292 | 0.38% | 0 |
| Darrell Castle | Scott Bradley | 9,457 | 0.32% | 0 |
| Alyson Kennedy | Osborne Hart | 1,672 | 0.06% | 0 |
| Rocky De La Fuente | Michael Steinberg | 1,431 | 0.05% | 0 |
| Mike Maturen (write-in) | - | 244 | 0.01% | 0 |
| Other Registered Write-in | 117 | <0.01% | 0 | |
| Unregistered Write-in | 26,905 | 0.91% | 0 | |
| Total | 2,945,233 | 100% | 10 |
Results by county[]
| County | Hillary Clinton[26] Democratic |
Donald Trump[26] Republican |
Gary Johnson[26] Libertarian |
Evan McMullin[26] Minnesota Independence |
Jill Stein[26] Green |
Various candidates[26] Other parties |
Various candidates[26] Write-ins |
Margin | Total votes cast | ||||||||
|---|---|---|---|---|---|---|---|---|---|---|---|---|---|---|---|---|---|
| # | % | # | % | # | % | # | % | # | % | # | % | # | % | # | % | ||
| Aitkin | 3,134 | 33.95% | 5,516 | 59.76% | 263 | 2.85% | 124 | 1.34% | 67 | 0.73% | 81 | 0.88% | 46 | 0.50% | -2,382 | -25.80% | 9,231 |
| Anoka | 75,499 | 40.64% | 93,341 | 50.25% | 7,726 | 4.16% | 3,685 | 1.98% | 2,123 | 1.14% | 1,710 | 0.92% | 1,675 | 0.90% | -17,842 | -9.60% | 185,759 |
| Becker | 5,208 | 30.24% | 10,880 | 63.18% | 580 | 3.37% | 171 | 0.99% | 130 | 0.75% | 121 | 0.70% | 131 | 0.76% | -5,672 | -32.94% | 17,221 |
| Beltrami | 8,688 | 40.29% | 10,783 | 50.00% | 780 | 3.62% | 444 | 2.06% | 420 | 1.95% | 201 | 0.93% | 248 | 1.15% | -2,095 | -9.72% | 21,564 |
| Benton | 5,640 | 28.12% | 12,872 | 64.17% | 683 | 3.41% | 325 | 1.62% | 245 | 1.22% | 146 | 0.73% | 147 | 0.73% | -7,232 | -36.06% | 20,058 |
| Big Stone | 921 | 33.44% | 1,607 | 58.35% | 94 | 3.41% | 59 | 2.14% | 20 | 0.73% | 28 | 1.02% | 25 | 0.91% | -686 | -24.91% | 2,754 |
| Blue Earth | 14,428 | 42.95% | 15,667 | 46.64% | 1,604 | 4.77% | 605 | 1.80% | 587 | 1.75% | 365 | 1.09% | 337 | 1.00% | -1,239 | -3.69% | 33,593 |
| Brown | 3,763 | 27.31% | 8,708 | 63.20% | 503 | 3.65% | 421 | 3.06% | 136 | 0.99% | 132 | 0.96% | 116 | 0.84% | -4,945 | -35.89% | 13,779 |
| Carlton | 8,460 | 46.46% | 8,160 | 44.81% | 703 | 3.86% | 308 | 1.69% | 233 | 1.28% | 195 | 1.07% | 152 | 0.83% | 300 | 1.65% | 18,211 |
| Carver | 21,508 | 38.62% | 29,057 | 52.17% | 2,461 | 4.42% | 1,210 | 2.17% | 488 | 0.88% | 378 | 0.68% | 595 | 1.07% | -7,549 | -13.55% | 55,697 |
| Cass | 4,949 | 30.93% | 9,982 | 62.39% | 414 | 2.59% | 196 | 1.23% | 212 | 1.33% | 132 | 0.83% | 114 | 0.71% | -5,033 | -31.46% | 15,999 |
| Chippewa | 1,978 | 31.79% | 3,764 | 60.50% | 209 | 3.36% | 104 | 1.67% | 70 | 1.13% | 57 | 0.92% | 40 | 0.64% | -1,786 | -28.70% | 6,222 |
| Chisago | 9,279 | 30.70% | 18,441 | 61.00% | 1,213 | 4.01% | 496 | 1.64% | 317 | 1.05% | 263 | 0.87% | 220 | 0.73% | -9,162 | -30.31% | 30,229 |
| Clay | 12,974 | 44.12% | 13,549 | 46.07% | 1,486 | 5.05% | 424 | 1.44% | 416 | 1.41% | 259 | 0.88% | 299 | 1.02% | -575 | -1.96% | 29,407 |
| Clearwater | 1,100 | 25.91% | 2,925 | 68.90% | 94 | 2.21% | 36 | 0.85% | 33 | 0.78% | 37 | 0.87% | 20 | 0.47% | -1,825 | -42.99% | 4,245 |
| Cook | 1,912 | 56.32% | 1,156 | 34.05% | 105 | 3.09% | 63 | 1.86% | 77 | 2.27% | 47 | 1.38% | 35 | 1.03% | 756 | 22.27% | 3,395 |
| Cottonwood | 1,678 | 29.33% | 3,679 | 64.31% | 150 | 2.62% | 86 | 1.50% | 41 | 0.72% | 63 | 1.10% | 24 | 0.42% | -2,001 | -34.98% | 5,721 |
| Crow Wing | 10,982 | 30.64% | 22,287 | 62.18% | 1,174 | 3.28% | 498 | 1.39% | 311 | 0.87% | 316 | 0.88% | 274 | 0.76% | -11,305 | -31.54% | 35,842 |
| Dakota | 110,251 | 48.31% | 99,624 | 43.65% | 9,867 | 4.32% | 1,501 | 0.66% | 2,678 | 1.17% | 1,741 | 0.76% | 2,574 | 1.13% | 10,627 | 4.66% | 228,236 |
| Dodge | 3,102 | 29.12% | 6,527 | 61.26% | 454 | 4.26% | 266 | 2.50% | 98 | 0.92% | 117 | 1.10% | 90 | 0.84% | -3,425 | -32.15% | 10,654 |
| Douglas | 6,227 | 28.58% | 13,966 | 64.11% | 781 | 3.59% | 324 | 1.49% | 167 | 0.77% | 158 | 0.73% | 162 | 0.74% | -7,739 | -35.52% | 21,785 |
| Faribault | 2,153 | 29.05% | 4,659 | 62.86% | 271 | 3.66% | 132 | 1.78% | 63 | 0.85% | 77 | 1.04% | 57 | 0.77% | -2,506 | -33.81% | 7,412 |
| Fillmore | 3,872 | 35.02% | 6,271 | 56.73% | 409 | 3.70% | 216 | 1.95% | 103 | 0.93% | 106 | 0.96% | 78 | 0.71% | -2,399 | -21.70% | 11,055 |
| Freeborn | 6,041 | 37.64% | 8,808 | 54.88% | 511 | 3.18% | 258 | 1.61% | 169 | 1.05% | 142 | 0.88% | 122 | 0.76% | -2,767 | -17.24% | 16,051 |
| Goodhue | 9,446 | 36.73% | 14,041 | 54.60% | 1,130 | 4.39% | 420 | 1.63% | 262 | 1.02% | 239 | 0.93% | 179 | 0.70% | -4,595 | -17.87% | 25,717 |
| Grant | 1,104 | 31.80% | 2,063 | 59.42% | 159 | 4.58% | 69 | 1.99% | 27 | 0.78% | 31 | 0.89% | 19 | 0.55% | -959 | -27.62% | 3,472 |
| Hennepin | 429,283 | 63.13% | 191,768 | 28.20% | 24,400 | 3.59% | 12,270 | 1.80% | 10,310 | 1.52% | 4,614 | 0.68% | 7,325 | 1.08% | 237,515 | 34.93% | 679,970 |
| Houston | 4,145 | 39.09% | 5,616 | 52.96% | 394 | 3.72% | 138 | 1.30% | 135 | 1.27% | 87 | 0.82% | 89 | 0.84% | -1,471 | -13.87% | 10,604 |
| Hubbard | 3,432 | 29.79% | 7,269 | 63.09% | 342 | 2.97% | 154 | 1.34% | 132 | 1.15% | 93 | 0.81% | 100 | 0.87% | -3,837 | -33.30% | 11,522 |
| Isanti | 5,656 | 26.91% | 13,635 | 64.88% | 765 | 3.64% | 418 | 1.99% | 219 | 1.04% | 182 | 0.87% | 140 | 0.67% | -7,979 | -37.97% | 21,015 |
| Itasca | 9,015 | 37.75% | 12,920 | 54.10% | 792 | 3.32% | 355 | 1.49% | 274 | 1.15% | 294 | 1.23% | 230 | 0.96% | -3,905 | -16.35% | 23,880 |
| Jackson | 1,492 | 27.21% | 3,609 | 65.81% | 181 | 3.30% | 81 | 1.48% | 49 | 0.89% | 41 | 0.75% | 31 | 0.57% | -2,117 | -38.60% | 5,484 |
| Kanabec | 2,327 | 28.46% | 5,230 | 63.96% | 298 | 3.64% | 115 | 1.41% | 81 | 0.99% | 74 | 0.90% | 52 | 0.64% | -2,903 | -35.50% | 8,177 |
| Kandiyohi | 7,266 | 33.37% | 12,785 | 58.72% | 927 | 4.26% | 347 | 1.59% | 164 | 0.75% | 159 | 0.73% | 124 | 0.57% | -5,519 | -25.35% | 21,772 |
| Kittson | 823 | 34.51% | 1,349 | 56.56% | 121 | 5.07% | 28 | 1.17% | 15 | 0.63% | 27 | 1.13% | 22 | 0.92% | -526 | -22.05% | 2,385 |
| Koochiching | 2,306 | 36.24% | 3,569 | 56.09% | 207 | 3.25% | 87 | 1.37% | 69 | 1.08% | 75 | 1.18% | 50 | 0.79% | -1,263 | -19.85% | 6,363 |
| Lac qui Parle | 1,301 | 33.73% | 2,294 | 59.48% | 106 | 2.75% | 61 | 1.58% | 33 | 0.86% | 41 | 1.06% | 21 | 0.54% | -993 | -25.75% | 3,857 |
| Lake | 3,077 | 47.19% | 2,932 | 44.96% | 215 | 3.30% | 93 | 1.43% | 93 | 1.43% | 62 | 0.95% | 49 | 0.75% | 145 | 2.22% | 6,521 |
| Lake of the Woods | 553 | 24.67% | 1,540 | 68.69% | 67 | 2.99% | 29 | 1.29% | 16 | 0.71% | 25 | 1.12% | 12 | 0.54% | -987 | -44.02% | 2,242 |
| Le Sueur | 4,623 | 30.88% | 9,182 | 61.33% | 514 | 3.43% | 265 | 1.77% | 146 | 0.98% | 137 | 0.92% | 104 | 0.69% | -4,559 | -30.45% | 14,971 |
| Lincoln | 860 | 28.50% | 1,930 | 63.95% | 112 | 3.71% | 59 | 1.95% | 18 | 0.60% | 23 | 0.76% | 16 | 0.53% | -1,070 | -35.45% | 3,018 |
| Lyon | 3,825 | 31.31% | 7,256 | 59.40% | 523 | 4.28% | 286 | 2.34% | 115 | 0.94% | 124 | 1.02% | 86 | 0.70% | -3,431 | -28.09% | 12,215 |
| Mahnomen | 930 | 42.33% | 991 | 45.11% | 54 | 2.46% | 30 | 1.37% | 34 | 1.55% | 35 | 1.59% | 14 | 5.60% | -61 | -2.78% | 2,197 |
| Marshall | 1,225 | 25.48% | 3,208 | 66.72% | 204 | 4.24% | 85 | 1.77% | 30 | 0.62% | 42 | 0.87% | 23 | 0.29% | -1,983 | -41.24% | 4,808 |
| Martin | 2,733 | 26.05% | 7,062 | 67.31% | 343 | 3.27% | 169 | 1.61% | 79 | 0.75% | 83 | 0.79% | 62 | 0.22% | -4,329 | -41.26% | 10,492 |
| McLeod | 4,978 | 26.55% | 12,155 | 64.84% | 857 | 4.57% | 372 | 1.98% | 135 | 0.72% | 187 | 1.00% | 123 | 0.33% | -7,177 | -38.29% | 18,746 |
| Meeker | 3,192 | 25.99% | 8,103 | 65.97% | 449 | 3.66% | 244 | 1.99% | 94 | 0.77% | 116 | 0.94% | 85 | 0.69% | -4,911 | -39.98% | 12,283 |
| Mille Lacs | 3,709 | 28.50% | 8,340 | 64.07% | 451 | 3.46% | 199 | 1.53% | 128 | 0.98% | 121 | 0.93% | 68 | 0.52% | -4,631 | -35.58% | 13,016 |
| Morrison | 3,637 | 20.65% | 12,925 | 73.38% | 442 | 2.51% | 246 | 1.40% | 146 | 0.83% | 138 | 0.78% | 80 | 0.45% | -9,288 | -52.73% | 17,614 |
| Mower | 7,444 | 42.00% | 8,826 | 49.79% | 620 | 3.50% | 316 | 1.78% | 191 | 1.08% | 189 | 1.07% | 139 | 0.78% | -1,382 | -7.80% | 17,725 |
| Murray | 1,295 | 27.74% | 2,974 | 63.71% | 203 | 4.35% | 106 | 2.27% | 22 | 0.47% | 42 | 0.90% | 26 | 0.56% | -1,679 | -35.97% | 4,668 |
| Nicollet | 7,886 | 43.58% | 8,436 | 46.62% | 831 | 4.59% | 336 | 1.86% | 250 | 1.38% | 175 | 0.97% | 182 | 1.01% | -550 | -3.04% | 18,096 |
| Nobles | 2,733 | 31.66% | 5,299 | 61.39% | 258 | 2.99% | 168 | 1.95% | 40 | 0.46% | 93 | 1.08% | 41 | 0.47% | -2,566 | -29.73% | 8,632 |
| Norman | 1,264 | 38.76% | 1,699 | 52.10% | 161 | 4.94% | 41 | 1.26% | 29 | 0.89% | 38 | 1.17% | 29 | 0.89% | -435 | -13.34% | 3,261 |
| Olmsted | 36,266 | 45.26% | 35,668 | 44.51% | 3,547 | 4.43% | 2,016 | 2.52% | 1,117 | 1.39% | 664 | 0.83% | 849 | 1.06% | 598 | 0.75% | 80,127 |
| Otter Tail | 9,339 | 28.74% | 20,939 | 64.43% | 1,000 | 3.08% | 531 | 1.63% | 245 | 0.75% | 230 | 0.71% | 215 | 0.66% | -11,600 | -35.69% | 32,499 |
| Pennington | 2,146 | 31.96% | 4,000 | 59.58% | 315 | 4.69% | 104 | 1.55% | 46 | 0.69% | 60 | 0.89% | 43 | 0.64% | -1,854 | -27.61% | 6,714 |
| Pine | 4,580 | 33.16% | 8,191 | 59.31% | 473 | 3.42% | 192 | 1.39% | 147 | 1.06% | 146 | 1.06% | 82 | 0.59% | -3,611 | -26.15% | 13,811 |
| Pipestone | 1,127 | 23.44% | 3,338 | 69.43% | 131 | 2.72% | 99 | 2.06% | 44 | 0.92% | 40 | 0.83% | 29 | 0.60% | -2,211 | -45.99% | 4,808 |
| Polk | 4,712 | 31.85% | 8,979 | 60.69% | 517 | 3.49% | 235 | 1.59% | 124 | 0.84% | 131 | 0.89% | 98 | 0.66% | -4,267 | -28.84% | 14,796 |
| Pope | 2,106 | 33.33% | 3,793 | 60.03% | 221 | 3.50% | 88 | 1.39% | 43 | 0.68% | 43 | 0.68% | 25 | 0.40% | -1,687 | -26.70% | 6,319 |
| Ramsey | 176,929 | 65.24% | 70,778 | 26.10% | 9,608 | 3.54% | 5,000 | 1.84% | 4,560 | 1.68% | 2,312 | 0.85% | 2,013 | 0.74% | 106,151 | 39.14% | 271,200 |
| Red Lake | 540 | 28.71% | 1,141 | 60.66% | 100 | 5.32% | 45 | 2.39% | 23 | 1.22% | 22 | 1.17% | 10 | 0.53% | -601 | -31.95% | 1,881 |
| Redwood | 1,887 | 24.79% | 5,137 | 67.49% | 242 | 3.18% | 147 | 1.93% | 77 | 1.01% | 76 | 1.00% | 45 | 0.59% | -3,250 | -42.70% | 7,611 |
| Renville | 2,117 | 27.83% | 4,890 | 64.29% | 244 | 3.21% | 148 | 1.95% | 66 | 0.87% | 98 | 1.29% | 43 | 0.57% | -2,773 | -36.46% | 7,606 |
| Rice | 14,437 | 44.50% | 15,429 | 47.56% | 1,230 | 3.79% | 498 | 1.53% | 386 | 1.19% | 237 | 0.73% | 226 | 0.70% | -992 | -3.06% | 32,443 |
| Rock | 1,373 | 28.37% | 3,091 | 63.88% | 155 | 3.20% | 97 | 2.00% | 40 | 0.83% | 51 | 1.05% | 32 | 0.66% | -1,718 | -35.50% | 4,839 |
| Roseau | 1,856 | 23.78% | 5,451 | 69.85% | 220 | 2.82% | 126 | 1.61% | 42 | 0.54% | 72 | 0.92% | 37 | 0.47% | -3,595 | -46.07% | 7,804 |
| Saint Louis | 57,769 | 51.39% | 44,631 | 39.70% | 4,366 | 3.88% | 1,528 | 1.36% | 1,878 | 1.67% | 1,087 | 0.97% | 1,162 | 1.03% | 13,138 | 11.69% | 112,421 |
| Scott | 28,502 | 37.53% | 39,948 | 52.59% | 3,400 | 4.48% | 1,296 | 1.71% | 740 | 0.97% | 906 | 1.19% | 1,162 | 1.53% | -11,446 | -15.07% | 75,954 |
| Sherburne | 13,299 | 27.32% | 31,049 | 63.79% | 1,927 | 3.96% | 850 | 1.75% | 457 | 0.94% | 455 | 0.93% | 640 | 1.31% | -17,750 | -36.46% | 48,677 |
| Sibley | 1,954 | 25.14% | 5,193 | 66.80% | 291 | 3.74% | 163 | 2.10% | 64 | 0.82% | 47 | 0.60% | 62 | 0.80% | -3,239 | -41.66% | 7,774 |
| Stearns | 25,575 | 32.13% | 47,618 | 59.83% | 2,972 | 3.73% | 1,281 | 1.61% | 954 | 1.20% | 585 | 0.73% | 607 | 0.76% | -22,043 | -27.69% | 79,592 |
| Steele | 6,239 | 32.53% | 11,198 | 58.39% | 808 | 4.21% | 396 | 2.06% | 208 | 1.08% | 191 | 1.00% | 137 | 0.71% | -4,959 | -25.86% | 19,177 |
| Stevens | 2,116 | 39.19% | 2,800 | 51.86% | 205 | 3.80% | 112 | 2.07% | 69 | 1.28% | 48 | 0.89% | 49 | 0.91% | -684 | -12.67% | 5,399 |
| Swift | 1,679 | 33.61% | 2,962 | 59.29% | 153 | 3.06% | 80 | 1.60% | 33 | 0.66% | 61 | 1.22% | 28 | 0.56% | -1,283 | -25.68% | 4,996 |
| Todd | 2,783 | 23.21% | 8,485 | 70.75% | 287 | 2.39% | 194 | 1.62% | 96 | 0.80% | 99 | 0.83% | 49 | 0.41% | -5,702 | -47.54% | 11,993 |
| Traverse | 631 | 35.04% | 1,050 | 58.30% | 41 | 2.28% | 31 | 1.72% | 16 | 0.89% | 22 | 1.22% | 10 | 0.56% | -419 | -23.26% | 1,801 |
| Wabasha | 3,866 | 32.67% | 6,989 | 59.07% | 467 | 3.95% | 218 | 1.84% | 127 | 1.07% | 97 | 0.82% | 68 | 0.57% | -3,123 | -26.39% | 11,832 |
| Wadena | 1,684 | 24.29% | 4,837 | 69.76% | 164 | 2.37% | 106 | 1.53% | 58 | 0.84% | 45 | 0.65% | 40 | 0.58% | -3,153 | -45.47% | 6,934 |
| Waseca | 2,838 | 29.40% | 5,967 | 61.81% | 387 | 4.01% | 184 | 1.91% | 106 | 1.10% | 97 | 1.00% | 74 | 0.77% | -3,129 | -32.41% | 9,653 |
| Washington | 67,086 | 46.51% | 64,429 | 44.67% | 6,180 | 4.28% | 2,718 | 1.88% | 1,478 | 1.02% | 952 | 0.66% | 1,393 | 0.97% | 2,657 | 1.84% | 144,236 |
| Watonwan | 1,814 | 36.29% | 2,768 | 55.38% | 156 | 3.12% | 107 | 2.14% | 52 | 1.04% | 74 | 1.48% | 27 | 0.54% | -954 | -19.09% | 4,998 |
| Wilkin | 893 | 27.04% | 2,129 | 64.48% | 146 | 4.42% | 48 | 1.45% | 34 | 1.03% | 29 | 0.88% | 23 | 0.70% | -1,236 | -37.43% | 3,302 |
| Winona | 11,366 | 43.59% | 12,122 | 46.49% | 1,165 | 4.47% | 414 | 1.59% | 531 | 2.04% | 254 | 0.97% | 222 | 0.85% | -756 | -2.90% | 26,074 |
| Wright | 20,336 | 29.21% | 43,274 | 62.16% | 3,002 | 4.31% | 1,392 | 2.00% | 547 | 0.79% | 603 | 0.87% | 466 | 0.67% | -22,938 | -32.95% | 69,620 |
| Yellow Medicine | 1,524 | 28.89% | 3,382 | 64.10% | 163 | 3.09% | 93 | 1.76% | 37 | 0.70% | 54 | 1.02% | 23 | 0.44% | -1,858 | -35.22% | 5,276 |
| Totals | 1,367,825 | 46.44% | 1,323,232 | 44.93% | 112,984 | 3.84% | 53,083 | 1.80% | 36,991 | 1.26% | 23,852 | 0.81% | 27,266 | 0.93% | 44,593 | 1.51% | 2,945,233 |
Counties that flipped from Democratic to Republican[]
- Beltrami (largest city: Bemidji)
- Blue Earth (largest city: Mankato)
- Chippewa (largest city: Montevideo)
- Clay (largest city: Moorhead)
- Fillmore (largest city: Spring Valley)
- Freeborn (largest city: Albert Lea)
- Houston (largest city: La Crescent)
- Itasca (largest city: Grand Rapids)
- Kittson (largest city: Hallock)
- Koochiching (largest city: International Falls)
- Lac qui Parle (largest city: Madison)
- Mahnomen (largest city: Mahnomen)
- Mower (largest city: Austin)
- Nicollet (largest city: North Mankato)
- Norman (largest city: Ada)
- Rice (largest city: Faribault)
- Swift (largest city: Benson)
- Traverse (largest city: Wheaton)
- Winona (largest city: Winona)
Results by congressional district[]
Trump won five of eight congressional districts.[28]
| District | Clinton | Trump | Representative |
|---|---|---|---|
| 1st | 38% | 53% | Tim Walz |
| 2nd | 45% | 46% | Jason Lewis |
| 3rd | 50% | 41% | Erik Paulsen |
| 4th | 61% | 30% | Betty McCollum |
| 5th | 73% | 18% | Keith Ellison |
| 6th | 33% | 59% | Tom Emmer |
| 7th | 31% | 61% | Collin Peterson |
| 8th | 38% | 54% | Rick Nolan |
Source:[29]
See also[]
- United States presidential elections in Minnesota
- 2016 Democratic Party presidential debates and forums
- 2016 Democratic Party presidential primaries
- 2016 Republican Party presidential debates and forums
- 2016 Republican Party presidential primaries
References[]
- ^ a b "Office of the State Of Minnesota Secretary of State". www.sos.state.mn.us. Retrieved 2017-07-22.
- ^ "Distribution of Electoral Votes". National Archives and Records Administration. 19 September 2019. Retrieved November 26, 2020.
- ^ "Statement from Chairman Ken Martin on Precinct Caucuses". Minnesota Democratic–Farmer–Labor Party. March 3, 2016. Archived from the original on December 7, 2017. Retrieved March 4, 2016.
- ^ a b "Results from the Minnesota caucuses". graphics.latimes.com. Retrieved 2016-04-26.
- ^ "Minnesota Republican Delegation 2016". www.thegreenpapers.com. Retrieved 2017-02-24.
- ^ "Green Party Minnesota Sunflower Seed - February 2016". Minnesota Green Party. 2016-02-19. Retrieved 2016-02-20.[permanent dead link]
- ^ "Jill Stein Wins GPMN Presidential Straw Poll". 2016-03-02. Retrieved 2016-03-02.[permanent dead link]
- ^ "Stein wins 84.3% in Minnesota Green presidential caucuses". 2016-03-02. Retrieved 2016-03-02.
- ^ "Stein wins in Boston and Worcester". Green Party Watch. 2 March 2016. Retrieved 5 March 2016.
- ^ "Unofficial results show Stein easily winning Massachusetts Green-Rainbow Party presidential primary". Green Party Watch. 2 March 2015. Retrieved 5 March 2016.
- ^ "2016 LPMN Caucus Results of presidential preference poll". Libertarian Party of Minnesota. 1 March 2016. Retrieved 20 March 2016.
- ^ "2016 LPMN Caucus Results of presidential preference poll". Libertarian Party of Minnesota. March 2016. Retrieved 2016-06-19.
- ^ "Our final map has Clinton winning with 352 electoral votes. Compare your picks with ours". Los Angeles Times. 2016-11-06. Retrieved 2016-11-13.
- ^ Chalian, David (November 4, 2016). "Road to 270: CNN's new election map". CNN. Retrieved March 3, 2019.
- ^ "2016 Electoral Scorecard". The Cook Political Report. November 7, 2016. Retrieved March 3, 2019.
- ^ "2016 Electoral Map Prediction". Electoral-vote.com. November 8, 2016. Retrieved March 3, 2019.
- ^ "Presidential Ratings". The Rothenberg Political Report. Retrieved August 16, 2021.
- ^ Sabato, Larry J. (November 7, 2016). "2016 President". University of Virginia Center for Politics. Retrieved March 3, 2019.
- ^ "2016 Election Maps - Battle for White House". RealClearPolitics. Retrieved 2016-11-13.
- ^ "Electoral Scorecard: Map shifts again in Trump's favor, as Clinton holds edge". Fox News. 2016-11-07. Retrieved 2016-11-13.
- ^ "RealClearPolitics - Election 2016 - Minnesota: Trump vs. Clinton".
- ^ http://www.sos.state.mn.us/media/2741/2016-minnesota-registered-write-ins-federal-offices-complete-and-final-list.pdf[bare URL PDF]
- ^ "Dave Leip's Atlas of U.S. Presidential Elections".
- ^ "Why one Minnesota county voted Republican for the first time since 1928". MPR News. 2016-11-14. Retrieved 2019-03-24.
- ^ Keen, Judy (2018-11-17). "Will Minnesota be a tossup state in 2020 elections?". Star Tribune. Retrieved 2019-03-17.
- ^ a b c d e f g Our Campaigns; Our Campaigns: MN US President, November 08, 2016
- ^ Bump, Philip. "The counties that flipped parties to swing the 2016 election". The Washington Post. ISSN 0190-8286. Retrieved 2020-09-01.
- ^ "Introducing the 2017 Cook Political Report Partisan Voter Index".
- ^ Simon, Steve (29 November 2016). "State of Minnesota Canvassing Report" (PDF). Minnesota Secretary of State. State of Minnesota. Retrieved 2 December 2016.
Further reading[]
- David Weigel; Lauren Tierney (September 13, 2020). "The five political states of Minnesota". The Washington Post. Archived from the original on October 4, 2020.
External links[]
- RNC 2016 Republican Nominating Process Archived 2016-11-08 at the Wayback Machine
- Green papers for 2016 primaries, caucuses, and conventions
- Decision Desk Headquarter Results for Minnesota
- [1]
State and district results of the 2016 United States presidential election | ||
|---|---|---|
|  | |
- 2016 United States presidential election by state
- United States presidential elections in Minnesota
- 2016 Minnesota elections