Election in Kentucky
Main article: 2016 United States presidential election
2016 United States presidential election in Kentucky Turnout 59.10%[1]
Nominee
Donald Trump Hillary Clinton
Party
Republican
Democratic
Home state
New York
New York
Running mate
Mike Pence Tim Kaine
Electoral vote
8
0
Popular vote
1,202,971
628,854
Percentage
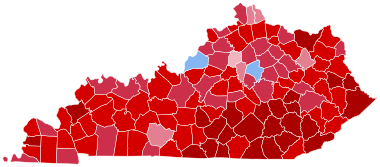
County Results
Trump
40–50%
50–60%
60–70%
70–80%
80–90%
Clinton
50–60%
President before election Barack Obama Democratic
Elected President Donald Trump Republican
Treemap of the popular vote by county.
The 2016 United States presidential election in Kentucky was held on Tuesday, November 8, 2016, as part of the 2016 United States presidential election in which all 50 states plus the District of Columbia participated. Kentucky voters chose electors to represent them in the Electoral College via a popular vote, pitting the Republican Party 's nominee, businessman Donald Trump , and running mate Indiana Governor Mike Pence against Democratic Party nominee, former Secretary of State Hillary Clinton , and her running mate Virginia Senator Tim Kaine . Kentucky has eight electoral votes in the Electoral College.[2]
Although Kentucky was won twice by southern Democrat Bill Clinton in 1992 and 1996 , Trump easily carried the state with 62.52% of the vote to Hillary Clinton's 32.68%, a margin of 29.84%. Trump won Kentucky by the largest margin of any Republican in history, and he swept counties across the state.[3] Jefferson County , home to Louisville ; and Fayette County , home to Lexington , both of which traditionally vote Democratic. The Bluegrass State was also one of eleven states to have twice voted for Bill Clinton but against his wife Hillary in 2016.
Trump's victory in Kentucky made it his fifth-strongest state in the 2016 election after West Virginia , Wyoming , Oklahoma , and North Dakota .[4] Elliott County 's nearly 150-year tradition of voting Democratic in every presidential election, winning with 2,000 votes to Clinton's 740, or 70%–26%.[a] Warren G. Harding in 1920 to win the White House without carrying Fayette County.
Primary elections [ ] Republican caucus [ ]
Republican primary results by county.
Donald Trump
Ted Cruz
In order to avoid a local law forbidding one candidate to run for two offices in the same primary, Rand Paul paid to have a presidential caucus, which took place on March 5. Paul dropped out prior to this.[5]
Kentucky Republican caucuses, March 2016
Candidate
Votes
Percentage
Actual delegate count
Bound
Unbound
Total
Donald Trump 82,493
35.92%
17
0
17
Ted Cruz
72,503
31.57%
15
0
15
Marco Rubio
37,579
16.36%
7
0
7
John Kasich
33,134
14.43%
7
0
7
Ben Carson (withdrawn)
1,951
0.85%
0
0
0
Rand Paul (withdrawn)
872
0.38%
0
0
0
Uncommitted
496
0.22%
0
0
0
Jeb Bush (withdrawn)
305
0.13%
0
0
0
Mike Huckabee (withdrawn)
174
0.08%
0
0
0
Chris Christie (withdrawn)
65
0.03%
0
0
0
Carly Fiorina (withdrawn)
64
0.03%
0
0
0
Rick Santorum (withdrawn)
31
0.03%
0
0
0
Total:
229,667
100.00%
40
0
40
Source: The Green Papers Republican Party of Kentucky
Democratic primary [ ] Main article: 2016 Kentucky Democratic primary
Four candidates appeared on the Democratic presidential primary ballot:
Polling [ ] See also: Statewide opinion polling for the 2016 United States presidential election § Kentucky
Predictions [ ] The following are final 2016 predictions from various organizations for Kentucky as of Election Day.
Results [ ] By county [ ]
County
Clinton%
Clinton#
Trump%
Trump#
Johnson%
Johnson#
McMullin%
McMullin#
Stein%
Stein#
Others%
Others#
Totals#
Adair 16.07%
1,323
80.61%
6,637
1.71%
141
1.12%
92
0.43%
35
0.06%
5
8,233
Allen 16.66%
1,349
79.87%
6,466
1.99%
161
0.78%
63
0.57%
46
0.14%
11
8,096
Anderson 23.06%
2,634
72.16%
8,242
2.79%
319
1.44%
165
0.47%
54
0.07%
8
11,422
Ballard 19.90%
816
77.08%
3,161
1.88%
77
0.56%
23
0.49%
20
0.10%
4
4,101
Barren 23.12%
4,275
72.93%
13,483
2.46%
455
0.90%
167
0.50%
93
0.08%
15
18,488
Bath 29.67%
1,361
67.19%
3,082
1.64%
75
0.76%
35
0.52%
24
0.22%
10
4,587
Bell 17.70%
1,720
79.89%
7,764
1.48%
144
0.45%
44
0.43%
42
0.04%
4
9,718
Boone 26.08%
15,026
67.83%
39,082
3.99%
2,299
1.32%
763
0.66%
380
0.12%
68
57,618
Bourbon 31.71%
2,791
63.26%
5,569
3.21%
283
1.09%
96
0.59%
52
0.14%
12
8,803
Boyd 29.44%
6,021
66.45%
13,591
2.42%
496
0.82%
168
0.82%
167
0.05%
11
20,454
Boyle 33.07%
4,281
62.10%
8,040
2.82%
365
1.31%
169
0.56%
73
0.14%
18
12,946
Bracken 19.99%
705
76.86%
2,711
1.45%
51
0.99%
35
0.57%
20
0.14%
5
3,527
Breathitt 26.79%
1,537
69.55%
3,991
2.04%
117
0.84%
48
0.61%
35
0.17%
10
5,738
Breckinridge 22.34%
1,960
73.90%
6,484
2.21%
194
0.91%
80
0.54%
47
0.10%
9
8,774
Bullitt 22.89%
8,255
72.67%
26,210
2.67%
964
0.98%
354
0.70%
253
0.09%
33
36,069
Butler 16.98%
947
79.41%
4,428
2.44%
136
0.95%
53
0.00%
0
0.22%
12
5,576
Caldwell 21.09%
1,260
75.43%
4,507
1.97%
118
0.92%
55
0.54%
32
0.05%
3
5,975
Calloway 29.59%
4,749
64.60%
10,367
3.07%
492
1.75%
281
0.93%
150
0.06%
10
16,049
Campbell 34.48%
14,658
58.93%
25,050
4.21%
1,789
1.30%
552
0.99%
422
0.09%
39
42,510
Carlisle 16.61%
432
80.51%
2,094
1.61%
42
0.73%
19
0.46%
12
0.08%
2
2,601
Carroll 28.69%
1,106
67.13%
2,588
2.59%
100
0.86%
33
0.62%
24
0.10%
4
3,855
Carter 22.14%
2,276
73.82%
7,587
2.31%
237
1.06%
109
0.56%
58
0.11%
11
10,278
Casey 11.91%
767
85.14%
5,482
1.88%
121
0.62%
40
0.43%
28
0.02%
1
6,439
Christian 32.55%
7,188
63.89%
14,108
2.15%
474
0.81%
179
0.54%
120
0.06%
14
22,083
Clark 29.04%
4,706
66.09%
10,710
2.80%
453
1.25%
203
0.75%
121
0.07%
12
16,205
Clay 11.11%
752
86.61%
5,861
1.23%
83
0.59%
40
0.38%
26
0.07%
5
6,767
Clinton 12.26%
547
85.37%
3,809
1.34%
60
0.52%
23
0.34%
15
0.18%
8
4,462
Crittenden 15.28%
617
81.50%
3,290
1.88%
76
0.89%
36
0.42%
17
0.02%
1
4,037
Cumberland 14.97%
459
81.60%
2,502
2.19%
67
0.72%
22
0.36%
11
0.16%
5
3,066
Daviess 30.92%
14,163
63.11%
28,907
3.25%
1,488
1.62%
741
0.99%
453
0.12%
55
45,807
Edmonson 18.67%
979
78.85%
4,135
1.47%
77
0.53%
28
0.38%
20
0.10%
5
5,244
Elliott 25.92%
740
70.05%
2,000
2.35%
67
0.74%
21
0.67%
19
0.28%
8
2,855
Estill 19.98%
1,108
76.39%
4,236
2.33%
129
0.63%
35
0.54%
30
0.13%
7
5,545
Fayette 51.19%
69,778
41.74%
56,894
3.84%
5,230
1.93%
2,636
1.16%
1,580
0.14%
197
136,315
Fleming 21.53%
1,348
75.43%
4,722
1.74%
109
0.81%
51
0.32%
20
0.16%
10
6,260
Floyd 24.27%
4,015
72.51%
11,993
2.16%
357
0.60%
100
0.34%
56
0.11%
19
16,540
Franklin 44.91%
10,717
49.52%
11,819
3.04%
725
1.44%
343
0.99%
236
0.10%
25
23,865
Fulton 32.49%
774
65.03%
1,549
1.47%
35
0.67%
16
0.29%
7
0.04%
1
2,382
Gallatin 22.44%
749
73.19%
2,443
3.00%
100
0.72%
24
0.54%
18
0.12%
4
3,338
Garrard 19.06%
1,453
77.45%
5,904
2.06%
157
0.87%
66
0.43%
33
0.13%
10
7,623
Grant 19.98%
1,910
76.03%
7,268
2.36%
226
0.80%
76
0.74%
71
0.08%
8
9,559
Graves 19.92%
3,308
76.30%
12,671
2.48%
411
0.67%
112
0.48%
80
0.14%
24
16,606
Grayson 18.52%
1,959
77.71%
8,219
2.45%
259
0.77%
81
0.43%
46
0.11%
12
10,576
Green 15.60%
832
81.98%
4,372
1.58%
84
0.36%
19
0.45%
24
0.04%
2
5,333
Greenup 25.47%
4,146
70.93%
11,546
1.96%
319
0.89%
145
0.67%
109
0.07%
12
16,277
Hancock 28.96%
1,244
64.91%
2,788
3.00%
129
2.03%
87
1.02%
44
0.07%
3
4,295
Hardin 32.31%
13,944
62.50%
26,971
3.27%
1,413
1.02%
440
0.80%
346
0.10%
42
43,156
Harlan 12.75%
1,372
84.87%
9,129
1.45%
156
0.45%
48
0.36%
39
0.12%
13
10,757
Harrison 26.10%
2,031
69.85%
5,435
2.36%
184
1.00%
78
0.59%
46
0.09%
7
7,781
Hart 23.82%
1,730
73.24%
5,320
1.93%
140
0.44%
32
0.54%
39
0.04%
3
7,264
Henderson 34.03%
6,707
61.69%
12,159
2.57%
507
0.90%
177
0.72%
142
0.09%
18
19,710
Henry 25.57%
1,828
69.16%
4,944
3.13%
224
1.23%
88
0.81%
58
0.10%
7
7,149
Hickman 20.82%
449
76.82%
1,657
1.21%
26
0.88%
19
0.28%
6
0.00%
0
2,157
Hopkins 21.18%
4,310
75.09%
15,277
2.35%
478
0.80%
163
0.48%
97
0.10%
20
20,345
Jackson 8.76%
482
88.87%
4,889
1.44%
79
0.49%
27
0.36%
20
0.07%
4
5,501
Jefferson 54.05%
190,836
40.72%
143,768
2.89%
10,188
1.36%
4,785
0.91%
3,224
0.08%
298
353,099
Jessamine 26.34%
6,144
66.34%
15,474
3.55%
829
2.89%
675
0.73%
170
0.15%
34
23,326
Johnson 13.06%
1,250
84.03%
8,043
1.70%
163
0.46%
44
0.63%
60
0.13%
12
9,572
Kenton 33.63%
24,214
59.67%
42,958
4.30%
3,093
1.30%
938
0.98%
703
0.13%
92
71,998
Knott 21.60%
1,245
75.60%
4,357
1.77%
102
0.68%
39
0.00%
0
0.35%
20
5,763
Knox 14.66%
1,761
82.29%
9,885
1.57%
189
0.85%
102
0.53%
64
0.09%
11
12,012
LaRue 20.07%
1,278
75.37%
4,799
2.73%
174
1.26%
80
0.44%
28
0.13%
8
6,367
Laurel 13.85%
3,440
82.92%
20,592
1.90%
473
0.77%
192
0.46%
114
0.09%
22
24,833
Lawrence 17.30%
1,045
79.71%
4,816
1.77%
107
0.61%
37
0.53%
32
0.08%
5
6,042
Lee 16.65%
444
80.65%
2,151
1.57%
42
0.71%
19
0.26%
7
0.15%
4
2,667
Leslie 8.90%
400
89.38%
4,015
0.87%
39
0.40%
18
0.33%
15
0.11%
5
4,492
Letcher 16.88%
1,542
79.84%
7,293
2.30%
210
0.54%
49
0.41%
37
0.03%
3
9,134
Lewis 14.82%
785
82.35%
4,363
1.79%
95
0.64%
34
0.30%
16
0.09%
5
5,298
Lincoln 19.51%
1,865
76.75%
7,338
2.36%
226
0.86%
82
0.46%
44
0.06%
6
9,561
Livingston 19.10%
887
76.86%
3,570
2.48%
115
0.99%
46
0.52%
24
0.06%
3
4,645
Logan 25.28%
2,755
71.36%
7,778
2.10%
229
0.83%
91
0.39%
43
0.03%
3
10,899
Lyon 26.38%
1,045
70.39%
2,789
1.87%
74
0.91%
36
0.38%
15
0.08%
3
3,962
Madison 31.56%
11,793
62.70%
23,431
3.18%
1,189
1.48%
552
0.94%
353
0.14%
53
37,371
Magoffin 22.91%
1,172
74.75%
3,824
1.29%
66
0.66%
34
0.33%
17
0.06%
3
5,116
Marion 33.03%
2,679
63.15%
5,122
2.65%
215
0.73%
59
0.41%
33
0.04%
3
8,111
Marshall 21.99%
3,672
73.79%
12,322
2.55%
426
1.04%
174
0.50%
84
0.12%
20
16,698
Martin 9.18%
363
88.62%
3,503
1.32%
52
0.51%
20
0.33%
13
0.05%
2
3,953
Mason 27.29%
1,970
68.49%
4,944
2.40%
173
1.21%
87
0.53%
38
0.10%
7
7,219
McCracken 29.18%
9,134
66.36%
20,774
2.68%
839
1.02%
320
0.69%
217
0.07%
23
31,307
McCreary 11.50%
664
86.77%
5,012
1.02%
59
0.33%
19
0.31%
18
0.07%
4
5,776
McLean 21.64%
988
74.05%
3,381
3.00%
137
0.96%
44
0.33%
15
0.02%
1
4,566
Meade 24.74%
3,026
70.80%
8,660
2.72%
333
0.87%
107
0.79%
97
0.07%
8
12,231
Menifee 25.19%
700
72.33%
2,010
1.55%
43
0.50%
14
0.40%
11
0.04%
1
2,779
Mercer 22.63%
2,395
73.12%
7,740
2.60%
275
0.95%
101
0.64%
68
0.06%
6
10,585
Metcalfe 21.13%
976
75.56%
3,491
1.86%
86
0.89%
41
0.48%
22
0.09%
4
4,620
Monroe 12.04%
601
85.71%
4,278
1.52%
76
0.46%
23
0.26%
13
0.00%
0
4,991
Montgomery 27.58%
3,158
68.60%
7,856
2.31%
264
0.79%
91
0.59%
68
0.13%
15
11,452
Morgan 21.07%
1,006
75.98%
3,628
1.32%
63
0.90%
43
0.54%
26
0.19%
9
4,775
Muhlenberg 25.05%
3,272
71.92%
9,393
1.76%
230
0.82%
107
0.34%
44
0.11%
14
13,060
Nelson 30.93%
6,434
64.57%
13,431
2.72%
565
0.97%
201
0.63%
131
0.19%
40
20,802
Nicholas 27.70%
787
68.88%
1,957
2.29%
65
0.67%
19
0.32%
9
0.14%
4
2,841
Ohio 20.00%
2,080
76.38%
7,942
1.99%
207
1.01%
105
0.62%
64
0.00%
0
10,398
Oldham 31.25%
10,268
62.30%
20,469
3.74%
1,229
1.80%
590
0.86%
282
0.05%
15
32,853
Owen 21.24%
1,062
74.89%
3,745
2.44%
122
0.86%
43
0.50%
25
0.08%
4
5,001
Owsley 14.55%
256
83.80%
1,474
1.36%
24
0.00%
0
0.00%
0
0.28%
5
1,759
Pendleton 19.38%
1,164
76.64%
4,604
2.41%
145
1.10%
66
0.45%
27
0.02%
1
6,007
Perry 20.20%
2,136
77.17%
8,158
1.59%
168
0.54%
57
0.44%
47
0.06%
6
10,572
Pike 17.35%
4,280
80.06%
19,747
1.67%
413
0.50%
124
0.35%
86
0.06%
15
24,665
Powell 25.66%
1,272
70.87%
3,513
2.38%
118
0.44%
22
0.54%
27
0.10%
5
4,957
Pulaski 15.01%
4,208
81.67%
22,902
2.00%
562
0.78%
218
0.45%
127
0.09%
24
28,041
Robertson 21.92%
222
74.93%
759
1.88%
19
0.79%
8
0.49%
5
0.00%
0
1,013
Rockcastle 13.68%
915
83.83%
5,609
1.30%
87
0.75%
50
0.37%
25
0.07%
5
6,691
Rowan 37.24%
3,295
58.48%
5,174
2.34%
207
0.77%
68
0.96%
85
0.21%
19
8,848
Russell 13.37%
1,093
83.96%
6,863
1.87%
153
0.59%
48
0.00%
0
0.21%
17
8,174
Scott 31.88%
7,715
62.20%
15,052
3.52%
853
1.66%
402
0.57%
139
0.16%
39
24,200
Shelby 30.50%
6,276
64.12%
13,196
3.06%
629
1.57%
324
0.67%
138
0.08%
17
20,580
Simpson 28.47%
2,144
67.41%
5,077
2.66%
200
0.86%
65
0.50%
38
0.09%
7
7,531
Spencer 20.19%
1,921
75.63%
7,196
2.49%
237
1.17%
111
0.46%
44
0.06%
6
9,515
Taylor 22.58%
2,553
73.59%
8,320
2.06%
233
1.26%
142
0.47%
53
0.04%
5
11,306
Todd 21.80%
1,042
75.58%
3,612
1.34%
64
0.56%
27
0.54%
26
0.17%
8
4,779
Trigg 23.51%
1,587
73.04%
4,931
1.79%
121
0.87%
59
0.67%
45
0.12%
8
6,751
Trimble 23.14%
879
72.96%
2,771
2.32%
88
0.74%
28
0.53%
20
0.31%
12
3,798
Union 21.43%
1,331
75.69%
4,701
1.85%
115
0.53%
33
0.47%
29
0.03%
2
6,211
Warren 35.01%
16,966
59.18%
28,673
3.31%
1,605
1.56%
757
0.86%
415
0.08%
38
48,454
Washington 25.20%
1,420
71.20%
4,013
1.97%
111
1.06%
60
0.30%
17
0.27%
15
5,636
Wayne 17.91%
1,431
79.72%
6,371
1.45%
116
0.51%
41
0.38%
30
0.04%
3
7,992
Webster 21.36%
1,240
75.75%
4,397
1.91%
111
0.59%
34
0.38%
22
0.02%
1
5,805
Whitley 15.01%
2,067
82.13%
11,312
1.76%
242
0.75%
103
0.30%
41
0.07%
9
13,774
Wolfe 28.58%
753
68.46%
1,804
1.59%
42
0.99%
26
0.34%
9
0.04%
1
2,635
Woodford 36.56%
4,958
56.75%
7,697
3.90%
529
1.81%
246
0.86%
117
0.12%
16
13,563
Totals 32.68% 628,854 62.52% 1,202,971 2.79% 53,752 1.18% 22,780 0.72% 13,913 0.10% 1,879 1,924,149
Counties that flipped from Democratic to Republican [ ] Elliot (largest city: Sandy Hook )Franklin (largest city: Frankfort )By congressional district [ ] Trump won 5 of 6 congressional districts.
District
Trump
Clinton
Representative
1st 72%
24%
Ed Whitfield
James Comer
2nd 68%
28%
Brett Guthrie
3rd 40%
55%
John Yarmuth
4th 65%
29%
Thomas Massie
5th 80%
18%
Hal Rogers
6th 55%
39%
Andy Barr
See also [ ] Democratic Party presidential debates, 2016 Democratic Party presidential primaries, 2016 Republican Party presidential debates, 2016 Republican Party presidential primaries, 2016 Notes [ ]
^ This is the only election in which Elliot County voted the same way as Riley County in Kansas , as in the following election , Riley County would vote Democratic for the first time in its entire history.
References [ ] External links [ ]
U.S.
Alabama Alaska Arizona Arkansas California Colorado Connecticut Delaware District of Columbia Florida Georgia Hawaii Idaho Illinois Indiana Iowa Kansas Kentucky Louisiana Maine Maryland Massachusetts Michigan Minnesota Mississippi Missouri Montana Nebraska Nevada New Hampshire New Jersey New Mexico New York North Carolina North Dakota Ohio Oklahoma Oregon Pennsylvania Rhode Island South Carolina South Dakota Tennessee Texas Utah Vermont Virginia Washington West Virginia Wisconsin Wyoming Guam (straw poll) U.S.
Alabama Alaska Arizona Arkansas California Colorado Connecticut Florida Georgia Hawaii Idaho Illinois Indiana Iowa Kansas Kentucky Louisiana Maryland Missouri Nevada New Hampshire New York North Carolina North Dakota Ohio Oklahoma Oregon Pennsylvania South Carolina South Dakota Utah Vermont Washington Wisconsin U.S. (Election ) Governors Attorneys
Indiana Missouri Montana North Carolina Oregon Pennsylvania Utah Vermont Washington West Virginia State Mayors
Bakersfield, CA Baltimore, MD Baton Rouge, LA Corpus Christi, TX Columbia, MO Fresno, CA Gainesville, FL Glendale, AZ Hampton, VA Honolulu, HI Irvine, CA Lubbock, TX Miami-Dade County, FL Milwaukee, WI Norfolk, VA Portland, OR Richmond, VA Riverside, CA Sacramento, CA Salt Lake County, UT San Diego, CA San Juan, PR Stockton, CA Tulsa, OK Wilmington, DE Winston-Salem, NC Local
Cook County, IL Los Angeles County, CA San Diego, CA State-wide
(← 2012 ) 2016 United States presidential election (2020 → )
Republican Party ▌ AIP · ▌ CPNY · ▌ RTLP
Debates and forums Endorsements Primaries Polls (national · statewide · straw )
Results Convention VP candidate selection Candidates
Nominee
Donald Trump campaign endorsements
primary positions protests GOP opposition VP nominee: Mike Pence Other candidates
Jeb Bush
campaign positions Ben Carson
campaign Chris Christie
campaign Ted Cruz
campaign endorsements positions Mark Everson Carly Fiorina
campaign Jim Gilmore
campaign Lindsey Graham
campaign Mike Huckabee
campaign positions Bobby Jindal
campaign John Kasich
campaign endorsements Jimmy McMillan George Pataki
campaign Rand Paul
campaign positions Rick Perry
campaign positions Marco Rubio
campaign positions Rick Santorum
campaign Scott Walker
campaign
Democratic Party ▌ WEP · ▌ WFP
Political positions Endorsements Debates and forums Primaries Polls
Results Convention
VP candidate selection Candidates
Nominee
Hillary Clinton campaign endorsements
political non-political celebrities performers
positions Democratic opposition VP nominee: Tim Kaine Other candidates
Lincoln Chafee
campaign Rocky De La Fuente
campaign Paul T. Farrell Jr. Lawrence Lessig
campaign Martin O'Malley
campaign Bernie Sanders
campaign endorsements positions Jim Webb
campaign Willie Wilson
Libertarian Party ▌ IPNY
Debates and forums Primaries Convention Candidates
Nominee
Gary Johnson campaign endorsements positions VP nominee: Bill Weld Other candidates
John McAfee Austin Petersen Vermin Supreme
Green Party
Debates and forums Primaries Convention Candidates
Nominee
Jill Stein campaign endorsements VP nominee: Ajamu Baraka Other candidates
Darryl Cherney
Independents ▌ IPMN
Better for America Candidate: Evan McMullin
Running mate: Mindy Finn
Other third-party and independent candidates
American Delta Party ▌ Reform American Party (South Carolina) American Solidarity Party America's Party Constitution Party
Nominee
Darrell Castle
campaign VP nominee: Scott Bradley Other candidates
Tom Hoefling Nutrition Party Peace and Freedom Party ▌ PSL
Nominee: Gloria La Riva VP nominee: Dennis Banks PSL VP nominee: Eugene Puryear *Other candidates: Monica Moorehead Jill Stein Prohibition Party Socialist Action Socialist Equality Party Socialist Party USA
Nominee: Mimi Soltysik
VP nominee: Angela Nicole Walker Socialist Workers Party
Nominee: Alyson Kennedy VP nominee: Osborne Hart Pacifist Party Workers World Party
Nominee: Monica Moorehead Other Independent candidates * : These candidates were constitutionally ineligible to serve as President or Vice President.
State and district results of the 2016 United States presidential election
Alabama Alaska Arizona Arkansas California Colorado Connecticut Delaware District of Columbia Florida Georgia Hawaii Idaho Illinois Indiana Iowa Kansas Kentucky Louisiana Maine Maryland Massachusetts Michigan Minnesota Mississippi Missouri Montana Nebraska Nevada New Hampshire New Jersey New Mexico New York North Carolina North Dakota Ohio Oklahoma Oregon Pennsylvania Rhode Island South Carolina South Dakota Tennessee Texas Utah Vermont Virginia Washington West Virginia Wisconsin Wyoming
United States presidential primaries and caucuses
Election timelines National polling
Democratic Party
2008 2016 2020 Republican Party
2008 2012 2016 2020 State polling
Democratic Party
2004 2008 2016 2020 Republican Party
2008 2012 2016 2020 Fundraising Debates and forums
Democratic Party 2004 2008 2016 2020
debates forums Republican Party 2008 2012 2016 2020 Libertarian Party
2016 Green Party
2016 Straw polls Major events
Iowa caucuses New Hampshire primary Nevada caucuses South Carolina primary Super Tuesday Caucuses primaries
Democratic Party
1912 1916 1920 1924 1928 1932 1936 1940 1944 1948 1952 1956 1960 1964 1968 1972 1976 1980 1984 1988 1992 1996 2000 2004 2008 2012 2016 2020 Republican Party
1912 1916 1920 1924 1928 1932 1936 1940 1944 1948 1952 1956 1960 1964 1968 1972 1976 1980 1984 1988 1992 1996 2000 2004 2008 2012 2016 2020 Libertarian Party Green Party Reform Party
1996 2000 2004 2008 2012 2016 2020 Constitution Party
Results breakdown
List of candidates by number of primary votes Democratic Party
2008 2016 2020 Republican Party
2008 2012 2016 2020 National
Reforms