2016 United States presidential election in Georgia
| ||||||||||||||||||||||||||
| Turnout | 60.1%[1] | |||||||||||||||||||||||||
|---|---|---|---|---|---|---|---|---|---|---|---|---|---|---|---|---|---|---|---|---|---|---|---|---|---|---|
| ||||||||||||||||||||||||||
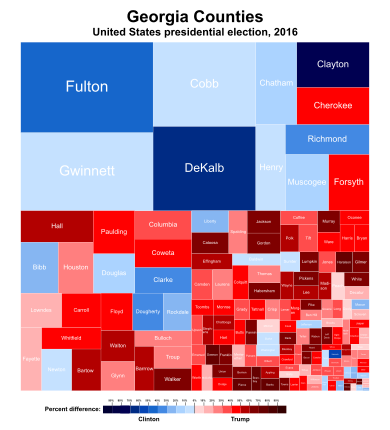
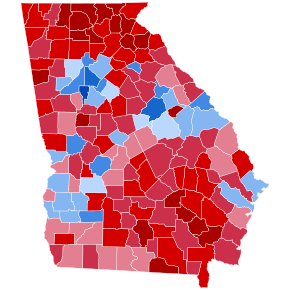 County Results
| ||||||||||||||||||||||||||
| ||||||||||||||||||||||||||

The 2016 United States presidential election in Georgia was held on Tuesday, November 8, 2016, as part of the 2016 United States presidential election in which all 50 states plus the District of Columbia participated. Georgia voters chose electors to represent them in the Electoral College via a popular vote, pitting the Republican Party's nominee, businessman Donald Trump, and running mate Indiana Governor Mike Pence against Democratic Party nominee, former Secretary of State Hillary Clinton, and her running mate Virginia Senator Tim Kaine. Georgia has 16 electoral votes in the Electoral College.[2]
Trump won Georgia by 5.09%, a lower margin compared to Mitt Romney's 7.82% in 2012 and even John McCain's 5.20% in 2008. Clinton received 45.64% of the vote, making this one of the few states where she outperformed Barack Obama in 2012, when he received just 45.51% of the vote.[3] This, combined with Trump's reduced margin of victory, made Georgia one of eleven states (plus the District of Columbia) to vote more Democratic in 2016 than in 2012.[4] The Atlanta metropolitan area in particular shifted strongly Democratic compared to 2012, with Clinton becoming the first Democrat to win Henry County since Georgia native Jimmy Carter in 1980, and the first Democrat to win Gwinnett County and Cobb County since 1976, when Carter won all of the state's counties.
Background[]
The incumbent President of the United States, Barack Obama, a Democrat and former U.S. Senator from Illinois, was first elected president in the 2008 election, running with former Senator Joe Biden of Delaware. Defeating the Republican nominee, Senator John McCain of Arizona, with 52.9% of the popular vote and 68% of the electoral vote,[5][6] Obama succeeded two-term Republican President George W. Bush, the former Governor of Texas. Obama and Biden were reelected in the 2012 presidential election, defeating former Massachusetts Governor Mitt Romney with 51.1% of the popular vote and 61.7% of electoral votes.[7] Although Barack Obama's approval rating in the RealClearPolitics poll tracking average remained between 40 and 50% for most of his second term, it has experienced a surge in early 2016 and reached its highest point since 2012 during June of that year.[8][9] Analyst Nate Cohn has noted that a strong approval rating for Barack Obama would equate to a strong performance for the Democratic candidate, and vice versa.[10]
Following his second term, President Obama was not eligible for another reelection. In October 2015, Obama's running-mate and two-term Vice President Biden decided not to enter the race for the Democratic presidential nomination either.[11] With Obama and Biden's terms expiring on January 20, 2017, the electorate was asked to elect a new president, the 45th president and 48th vice president of the United States, respectively.
Primary elections[]
Democratic primary[]
Four candidates appeared on the ballot:
- Bernie Sanders
- Hillary Clinton
- Martin O'Malley (withdrew)
- Michael Steinberg
This section should include a summary of 2016 Georgia Democratic primary. (July 2016) |
| Candidate | Popular vote | Estimated delegates | |||
|---|---|---|---|---|---|
| Count | Percentage | Pledged | Unpledged | Total | |
| Hillary Clinton | 545,674 | 71.30% | 73 | 11 | 84 |
| Bernie Sanders | 215,797 | 28.20% | 29 | 0 | 29 |
| Martin O'Malley (withdrawn) | 2,129 | 0.28% | |||
| Michael Steinberg | 1,766 | 0.23% | |||
| Uncommitted | N/A | 0 | 4 | 4 | |
| Total | 765,366 | 100% | 102 | 15 | 117 |
| Source: The Green Papers | |||||
Republican primary[]
| |||||||||||||||||||||||||||||||||
| |||||||||||||||||||||||||||||||||
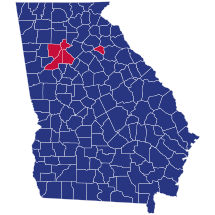 Georgia results by county Donald Trump Marco Rubio | |||||||||||||||||||||||||||||||||


The 76 Republican delegates from Georgia were allocated in this way. There were 42 delegates allocated by congressional district; if a candidate received a majority of votes or they were the only candidate to receive at least 20% of the vote in a congressional district, they would receive the districts 3 delegates. If not, the candidate who won the plurality of the vote in a congressional district would receive 2 delegates and the second-place finisher in the district would receive 1 delegate. There were also 34 at-large delegates; if a candidate got a majority of the vote or they were the only candidate to get the mandatory threshold to receive any delegates (begins at 20%, if no one gets at least 20%, then 15%, if no one gets 15%, then 10%), they would get all of the state's at-large delegates. If not, the delegates would be allocated proportionally among the candidates receiving at least the mandatory threshold.[12]
| Candidate | Votes | Percentage | Actual delegate count | ||
|---|---|---|---|---|---|
| Bound | Unbound | Total | |||
| Donald Trump | 502,994 | 38.81% | 42 | 0 | 42 |
| Marco Rubio | 316,836 | 24.45% | 16 | 0 | 16 |
| Ted Cruz | 305,847 | 23.60% | 18 | 0 | 18 |
| Ben Carson | 80,723 | 6.23% | 0 | 0 | 0 |
| John Kasich | 72,508 | 5.59% | 0 | 0 | 0 |
| Jeb Bush (withdrawn) | 7,686 | 0.59% | 0 | 0 | 0 |
| Rand Paul (withdrawn) | 2,910 | 0.22% | 0 | 0 | 0 |
| Mike Huckabee (withdrawn) | 2,625 | 0.20% | 0 | 0 | 0 |
| Chris Christie (withdrawn) | 1,486 | 0.11% | 0 | 0 | 0 |
| Carly Fiorina (withdrawn) | 1,146 | 0.09% | 0 | 0 | 0 |
| Rick Santorum (withdrawn) | 539 | 0.04% | 0 | 0 | 0 |
| Lindsey Graham (withdrawn) | 428 | 0.03% | 0 | 0 | 0 |
| George Pataki (withdrawn) | 236 | 0.02% | 0 | 0 | 0 |
| Unprojected delegates: | 0 | 0 | 0 | ||
| Total: | 1,295,964 | 100.00% | 76 | 0 | 76 |
| Source: The Green Papers | |||||
Green convention[]
On June 4, the Georgia Green Party held its state convention and presidential preference vote.[13]
| Candidate | Votes | Percentage | National delegates |
|---|---|---|---|
| Jill Stein | - | - | 3 |
| William Kreml | - | - | 1 |
| Sedinam Kinamo Christin Moyowasifza Curry | - | - | - |
| Kent Mesplay | - | - | - |
| Darryl Cherney | - | - | - |
| Total | - | - | 4 |
General election[]
Predictions[]
| Source | Ranking | As of |
|---|---|---|
| ABC News[14] | Tossup | November 7, 2016 |
| CNN[15] | Lean R | November 4, 2016 |
| Cook Political Report[16] | Lean R | November 7, 2016 |
| Electoral-vote.com[17] | Lean R | November 7, 2016 |
| Los Angeles Times[18] | Lean R | November 6, 2016 |
| NBC[19] | Tossup | November 7, 2016 |
| RealClearPolitics[20] | Tossup | November 7, 2016 |
| Rothenberg Political Report[21] | Lean R | November 7, 2016 |
| Sabato's Crystal Ball[22] | Likely R | November 7, 2016 |
Polling[]
Throughout the campaign, Republican Donald Trump won the vast majority of pre-election polls. The average of the last three polls showed Donald Trump leading Hillary Clinton 50% to 46%, which was accurate compared to the results.[23]
Statewide results[]
The voting age population was 7,168,068, of which 5,443,046, were registered to vote. Turnout for the presidential election was 4,146,825, which is 57.85% of the voting age population and 76.19% of registered voters.
Seventeen candidates received write-in votes, of which the large plurality (13,017) went to Evan McMullin.
| Party | Candidate | Running mate | Votes | Percentage | Electoral votes | |
|---|---|---|---|---|---|---|
| Republican | Donald Trump | Mike Pence | 2,089,104 | 50.38% | 16 | |
| Democratic | Hillary Clinton | Tim Kaine | 1,877,963 | 45.29% | 0 | |
| Libertarian | Gary Johnson | William Weld | 125,306 | 3.02% | 0 | |
| Independent | Evan McMullin (write-in) | Nathan Johnson | 13,138 | 0.32% | 0 | |
| Green | Jill Stein (write-in) | Ajamu Baraka | 7,736 | 0.19% | 0 | |
| Constitution | Darrell Castle (write-in) | Scott Bradley | 1,126 | 0.03% | 0 | |
| Others / Write-In Votes | 32,452 | 0.78% | 0 | |||
| Totals | 4,146,825 | 100.00% | 16 | |||
| Source: David Leip's Atlas of U.S. Presidential Elections | ||||||
By county[]
| County | Clinton% | Clinton# | Trump% | Trump# | Others% | Others# | Total |
|---|---|---|---|---|---|---|---|
| Appling | 20.47% | 1,434 | 78.43% | 5,494 | 1.10% | 77 | 7,005 |
| Atkinson | 26.70% | 697 | 71.95% | 1,878 | 1.34% | 35 | 2,610 |
| Bacon | 15.13% | 608 | 83.70% | 3,364 | 1.17% | 47 | 4,019 |
| Baker | 45.14% | 650 | 53.82% | 775 | 1.04% | 15 | 1,440 |
| Baldwin | 49.55% | 7,970 | 47.85% | 7,697 | 2.60% | 419 | 16,086 |
| Banks | 9.84% | 684 | 88.26% | 6,134 | 1.90% | 132 | 6,950 |
| Barrow | 22.82% | 6,580 | 73.21% | 21,108 | 3.96% | 1,143 | 28,831 |
| Bartow | 20.89% | 8,212 | 76.10% | 29,911 | 3.01% | 1,183 | 39,306 |
| Ben Hill | 35.42% | 2,101 | 63.04% | 3,739 | 1.53% | 91 | 5,931 |
| Berrien | 15.90% | 1,047 | 82.35% | 5,422 | 1.75% | 115 | 6,584 |
| Bibb | 59.07% | 36,787 | 38.61% | 24,043 | 2.32% | 1,447 | 62,277 |
| Bleckley | 22.27% | 1,101 | 75.24% | 3,719 | 2.49% | 123 | 4,943 |
| Brantley | 9.84% | 619 | 88.48% | 5,567 | 1.68% | 106 | 6,292 |
| Brooks | 40.01% | 2,528 | 58.58% | 3,701 | 1.41% | 89 | 6,318 |
| Bryan | 26.61% | 4,014 | 69.80% | 10,529 | 3.59% | 542 | 15,085 |
| Bulloch | 36.68% | 9,261 | 59.79% | 15,097 | 3.53% | 890 | 25,248 |
| Burke | 50.59% | 4,731 | 48.03% | 4,491 | 1.38% | 129 | 9,351 |
| Butts | 27.08% | 2,566 | 70.88% | 6,717 | 2.05% | 194 | 9,477 |
| Calhoun | 58.22% | 1,179 | 40.99% | 830 | 0.79% | 16 | 2,025 |
| Camden | 31.43% | 5,930 | 65.24% | 12,310 | 3.33% | 629 | 18,869 |
| Candler | 27.27% | 1,026 | 70.79% | 2,664 | 1.94% | 73 | 3,763 |
| Carroll | 28.43% | 12,464 | 68.50% | 30,029 | 3.07% | 1,346 | 43,839 |
| Catoosa | 17.98% | 4,771 | 78.69% | 20,876 | 3.32% | 881 | 26,528 |
| Charlton | 25.04% | 1,004 | 73.61% | 2,951 | 1.35% | 54 | 4,009 |
| Chatham | 55.87% | 62,290 | 40.98% | 45,688 | 3.14% | 3,503 | 111,481 |
| Chattahoochee | 42.73% | 594 | 54.03% | 751 | 3.24% | 45 | 1,390 |
| Chattooga | 19.55% | 1,613 | 78.31% | 6,462 | 2.14% | 177 | 8,252 |
| Cherokee | 22.75% | 25,231 | 72.73% | 80,649 | 4.52% | 5,015 | 110,895 |
| Clarke | 66.77% | 29,603 | 28.68% | 12,717 | 4.55% | 2,019 | 44,339 |
| Clay | 54.84% | 697 | 44.53% | 566 | 0.63% | 8 | 1,271 |
| Clayton | 84.55% | 78,220 | 13.67% | 12,645 | 1.78% | 1,647 | 92,512 |
| Clinch | 28.03% | 686 | 70.58% | 1,727 | 1.39% | 34 | 2,447 |
| Cobb | 48.89% | 160,121 | 46.69% | 152,912 | 4.42% | 14,466 | 327,499 |
| Coffee | 29.42% | 4,094 | 68.90% | 9,588 | 1.67% | 233 | 13,915 |
| Colquitt | 25.46% | 3,463 | 72.77% | 9,898 | 1.76% | 240 | 13,601 |
| Columbia | 29.40% | 18,887 | 67.07% | 43,085 | 3.53% | 2,270 | 64,242 |
| Cook | 29.02% | 1,753 | 69.13% | 4,176 | 1.85% | 112 | 6,041 |
| Coweta | 27.03% | 16,583 | 69.33% | 42,533 | 3.64% | 2,235 | 61,351 |
| Crawford | 27.53% | 1,421 | 70.42% | 3,635 | 2.05% | 106 | 5,162 |
| Crisp | 37.77% | 2,837 | 60.56% | 4,549 | 1.68% | 126 | 7,512 |
| Dade | 15.46% | 965 | 80.92% | 5,051 | 3.62% | 226 | 6,242 |
| Dawson | 12.37% | 1,448 | 84.59% | 9,900 | 3.04% | 356 | 11,704 |
| Decatur | 40.16% | 4,124 | 58.62% | 6,020 | 1.23% | 126 | 10,270 |
| DeKalb | 80.44% | 251,370 | 16.47% | 51,468 | 3.09% | 9,666 | 312,504 |
| Dodge | 26.28% | 1,839 | 71.75% | 5,021 | 1.97% | 138 | 6,998 |
| Dooly | 48.51% | 1,872 | 50.56% | 1,951 | 0.93% | 36 | 3,859 |
| Dougherty | 68.53% | 23,311 | 30.08% | 10,232 | 1.40% | 475 | 34,018 |
| Douglas | 54.00% | 31,005 | 43.22% | 24,817 | 2.78% | 1,594 | 57,416 |
| Early | 45.31% | 2,168 | 53.33% | 2,552 | 1.36% | 65 | 4,785 |
| Echols | 13.27% | 156 | 85.63% | 1,007 | 1.11% | 13 | 1,176 |
| Effingham | 20.73% | 4,853 | 76.37% | 17,874 | 2.90% | 679 | 23,406 |
| Elbert | 31.86% | 2,539 | 66.40% | 5,292 | 1.74% | 139 | 7,970 |
| Emanuel | 31.04% | 2,435 | 68.01% | 5,335 | 0.96% | 75 | 7,845 |
| Evans | 31.37% | 1,130 | 66.74% | 2,404 | 1.89% | 68 | 3,602 |
| Fannin | 16.33% | 1,923 | 81.79% | 9,632 | 1.89% | 222 | 11,777 |
| Fayette | 38.53% | 23,284 | 57.99% | 35,048 | 3.48% | 2,103 | 60,435 |
| Floyd | 26.66% | 9,159 | 70.19% | 24,114 | 3.16% | 1,084 | 34,357 |
| Forsyth | 24.09% | 23,462 | 71.71% | 69,851 | 4.20% | 4,091 | 97,404 |
| Franklin | 14.67% | 1,243 | 83.24% | 7,054 | 2.09% | 177 | 8,474 |
| Fulton | 68.99% | 297,051 | 27.35% | 117,783 | 3.66% | 15,765 | 430,599 |
| Gilmer | 15.43% | 1,965 | 82.27% | 10,477 | 2.30% | 293 | 12,735 |
| Glascock | 9.93% | 138 | 88.85% | 1,235 | 1.22% | 17 | 1,390 |
| Glynn | 34.52% | 11,775 | 63.06% | 21,512 | 2.42% | 825 | 34,112 |
| Gordon | 16.85% | 3,181 | 80.47% | 15,191 | 2.69% | 507 | 18,879 |
| Grady | 32.75% | 3,013 | 65.79% | 6,053 | 1.47% | 135 | 9,201 |
| Greene | 36.19% | 3,199 | 62.10% | 5,490 | 1.71% | 151 | 8,840 |
| Gwinnett | 51.02% | 166,153 | 45.14% | 146,989 | 3.84% | 12,494 | 325,636 |
| Habersham | 15.39% | 2,483 | 81.75% | 13,190 | 2.86% | 461 | 16,134 |
| Hall | 23.04% | 16,180 | 73.67% | 51,733 | 3.29% | 2,307 | 70,220 |
| Hancock | 75.45% | 2,701 | 23.55% | 843 | 1.01% | 36 | 3,580 |
| Haralson | 13.03% | 1,475 | 84.64% | 9,585 | 2.33% | 264 | 11,324 |
| Harris | 24.91% | 4,086 | 72.78% | 11,936 | 2.31% | 379 | 16,401 |
| Hart | 25.64% | 2,585 | 72.28% | 7,286 | 2.07% | 209 | 10,080 |
| Heard | 17.67% | 743 | 80.12% | 3,370 | 2.21% | 93 | 4,206 |
| Henry | 50.93% | 50,057 | 46.52% | 45,724 | 2.55% | 2,505 | 98,286 |
| Houston | 37.75% | 22,553 | 59.30% | 35,430 | 2.95% | 1,761 | 59,744 |
| Irwin | 24.31% | 891 | 74.11% | 2,716 | 1.58% | 58 | 3,665 |
| Jackson | 16.57% | 4,491 | 80.36% | 21,784 | 3.08% | 834 | 27,109 |
| Jasper | 25.64% | 1,544 | 72.39% | 4,360 | 1.98% | 119 | 6,023 |
| Jeff Davis | 17.70% | 901 | 80.61% | 4,104 | 1.69% | 86 | 5,091 |
| Jefferson | 54.95% | 3,821 | 44.05% | 3,063 | 1.01% | 70 | 6,954 |
| Jenkins | 36.80% | 1,123 | 62.09% | 1,895 | 1.11% | 34 | 3,052 |
| Johnson | 30.85% | 1,136 | 68.41% | 2,519 | 0.73% | 27 | 3,682 |
| Jones | 31.62% | 3,961 | 66.30% | 8,305 | 2.08% | 260 | 12,526 |
| Lamar | 29.92% | 2,270 | 68.42% | 5,190 | 1.66% | 126 | 7,586 |
| Lanier | 28.15% | 806 | 69.30% | 1,984 | 2.55% | 73 | 2,863 |
| Laurens | 34.67% | 6,752 | 63.72% | 12,411 | 1.61% | 313 | 19,476 |
| Lee | 22.46% | 3,170 | 75.42% | 10,646 | 2.12% | 299 | 14,115 |
| Liberty | 59.29% | 9,556 | 38.06% | 6,134 | 2.65% | 427 | 16,117 |
| Lincoln | 31.03% | 1,273 | 67.26% | 2,759 | 1.71% | 70 | 4,102 |
| Long | 33.03% | 1,360 | 63.78% | 2,626 | 3.18% | 131 | 4,117 |
| Lowndes | 40.03% | 15,064 | 57.50% | 21,635 | 2.47% | 929 | 37,628 |
| Lumpkin | 18.00% | 2,220 | 77.99% | 9,619 | 4.01% | 495 | 12,334 |
| Macon | 63.10% | 2,705 | 35.92% | 1,540 | 0.98% | 42 | 4,287 |
| Madison | 20.29% | 2,425 | 76.97% | 9,201 | 2.74% | 328 | 11,954 |
| Marion | 38.11% | 1,213 | 60.35% | 1,921 | 1.54% | 49 | 3,183 |
| McDuffie | 39.91% | 3,699 | 58.61% | 5,432 | 1.48% | 137 | 9,268 |
| McIntosh | 39.01% | 2,303 | 59.07% | 3,487 | 1.91% | 113 | 5,903 |
| Meriwether | 41.39% | 3,804 | 56.82% | 5,222 | 1.80% | 165 | 9,191 |
| Miller | 24.49% | 623 | 74.33% | 1,891 | 1.18% | 30 | 2,544 |
| Mitchell | 44.41% | 3,493 | 54.41% | 4,279 | 1.18% | 93 | 7,865 |
| Monroe | 28.15% | 3,571 | 69.61% | 8,832 | 2.24% | 284 | 12,687 |
| Montgomery | 23.78% | 847 | 74.96% | 2,670 | 1.26% | 45 | 3,562 |
| Morgan | 28.21% | 2,663 | 69.48% | 6,559 | 2.31% | 218 | 9,440 |
| Murray | 14.49% | 1,800 | 83.23% | 10,341 | 2.28% | 283 | 12,424 |
| Muscogee | 58.04% | 39,851 | 39.29% | 26,976 | 2.67% | 1,831 | 68,658 |
| Newton | 50.09% | 21,943 | 47.74% | 20,913 | 2.16% | 947 | 43,803 |
| Oconee | 28.00% | 5,581 | 67.36% | 13,425 | 4.64% | 925 | 19,931 |
| Oglethorpe | 27.51% | 1,831 | 69.50% | 4,625 | 2.99% | 199 | 6,655 |
| Paulding | 27.88% | 18,025 | 69.09% | 44,662 | 3.02% | 1,954 | 64,641 |
| Peach | 47.56% | 5,100 | 50.48% | 5,413 | 1.97% | 211 | 10,724 |
| Pickens | 14.15% | 1,979 | 83.32% | 11,651 | 2.53% | 354 | 13,984 |
| Pierce | 12.37% | 903 | 86.35% | 6,302 | 1.27% | 93 | 7,298 |
| Pike | 14.28% | 1,240 | 83.84% | 7,278 | 1.88% | 163 | 8,681 |
| Polk | 20.23% | 2,867 | 77.73% | 11,014 | 2.04% | 289 | 14,170 |
| Pulaski | 30.68% | 1,104 | 67.71% | 2,437 | 1.61% | 58 | 3,599 |
| Putnam | 29.12% | 2,758 | 69.09% | 6,544 | 1.79% | 170 | 9,472 |
| Quitman | 44.16% | 461 | 55.08% | 575 | 0.77% | 8 | 1,044 |
| Rabun | 18.16% | 1,444 | 79.08% | 6,287 | 2.75% | 219 | 7,950 |
| Randolph | 55.16% | 1,598 | 43.87% | 1,271 | 0.97% | 28 | 2,897 |
| Richmond | 65.01% | 48,814 | 32.58% | 24,461 | 2.41% | 1,811 | 75,086 |
| Rockdale | 61.76% | 23,255 | 35.79% | 13,478 | 2.45% | 923 | 37,656 |
| Schley | 21.01% | 401 | 77.11% | 1,472 | 1.89% | 36 | 1,909 |
| Screven | 40.36% | 2,300 | 57.99% | 3,305 | 1.65% | 94 | 5,699 |
| Seminole | 33.19% | 1,189 | 65.47% | 2,345 | 1.34% | 48 | 3,582 |
| Spalding | 36.55% | 9,357 | 61.12% | 15,646 | 2.33% | 597 | 25,600 |
| Stephens | 18.81% | 1,837 | 78.70% | 7,686 | 2.49% | 243 | 9,766 |
| Stewart | 59.46% | 1,222 | 39.17% | 805 | 1.36% | 28 | 2,055 |
| Sumter | 50.30% | 5,520 | 48.08% | 5,276 | 1.62% | 178 | 10,974 |
| Talbot | 61.71% | 2,002 | 36.87% | 1,196 | 1.42% | 46 | 3,244 |
| Taliaferro | 60.76% | 545 | 38.91% | 349 | 0.33% | 3 | 897 |
| Tattnall | 24.41% | 1,681 | 74.01% | 5,096 | 1.58% | 109 | 6,886 |
| Taylor | 38.06% | 1,296 | 60.62% | 2,064 | 1.32% | 45 | 3,405 |
| Telfair | 34.60% | 1,313 | 64.56% | 2,450 | 0.84% | 32 | 3,795 |
| Terrell | 54.22% | 2,267 | 44.82% | 1,874 | 0.96% | 40 | 4,181 |
| Thomas | 38.12% | 7,142 | 59.92% | 11,228 | 1.96% | 368 | 18,738 |
| Tift | 30.67% | 4,347 | 67.61% | 9,584 | 1.72% | 244 | 14,175 |
| Toombs | 25.66% | 2,338 | 72.60% | 6,615 | 1.73% | 158 | 9,111 |
| Towns | 17.96% | 1,210 | 79.88% | 5,383 | 2.17% | 146 | 6,739 |
| Treutlen | 31.89% | 862 | 66.93% | 1,809 | 1.18% | 32 | 2,703 |
| Troup | 37.32% | 9,713 | 60.52% | 15,750 | 2.16% | 561 | 26,024 |
| Turner | 36.71% | 1,246 | 61.73% | 2,095 | 1.56% | 53 | 3,394 |
| Twiggs | 48.59% | 1,971 | 50.17% | 2,035 | 1.23% | 50 | 4,056 |
| Union | 16.30% | 1,963 | 81.80% | 9,852 | 1.90% | 229 | 12,044 |
| Upson | 31.78% | 3,475 | 66.69% | 7,292 | 1.53% | 167 | 10,934 |
| Walker | 17.59% | 4,215 | 79.10% | 18,950 | 3.30% | 791 | 23,956 |
| Walton | 20.49% | 8,292 | 76.91% | 31,125 | 2.61% | 1,055 | 40,472 |
| Ware | 28.29% | 3,440 | 70.01% | 8,513 | 1.69% | 206 | 12,159 |
| Warren | 56.32% | 1,314 | 42.48% | 991 | 1.20% | 28 | 2,333 |
| Washington | 49.72% | 4,200 | 49.12% | 4,149 | 1.16% | 98 | 8,447 |
| Wayne | 19.65% | 2,041 | 78.50% | 8,153 | 1.85% | 192 | 10,386 |
| Webster | 42.38% | 473 | 56.45% | 630 | 1.16% | 13 | 1,116 |
| Wheeler | 30.73% | 646 | 67.60% | 1,421 | 1.67% | 35 | 2,102 |
| White | 14.21% | 1,674 | 82.84% | 9,761 | 2.95% | 348 | 11,783 |
| Whitfield | 26.11% | 7,937 | 70.85% | 21,537 | 3.04% | 924 | 30,398 |
| Wilcox | 28.66% | 852 | 70.50% | 2,096 | 0.84% | 25 | 2,973 |
| Wilkes | 41.28% | 1,848 | 57.45% | 2,572 | 1.27% | 57 | 4,477 |
| Wilkinson | 44.27% | 1,894 | 54.53% | 2,333 | 1.19% | 51 | 4,278 |
| Worth | 24.40% | 2,020 | 74.30% | 6,152 | 1.30% | 108 | 8,280 |
Counties that flipped from Democratic to Republican[]
- Baker (largest city: Newton)
- Dooly (largest city: Vienna)
- Early (largest city: Blakely)
- Peach (largest city: Fort Valley)
- Quitman (largest city: Georgetown)
- Twiggs (largest city: Jeffersonville)
Counties that flipped from Republican to Democratic[]
- Cobb (largest city: Marietta)
- Gwinnett (largest city: Peachtree Corners)
- Henry (largest city: Stockbridge)
By congressional district[]
Trump won 10 of 14 congressional districts.[24]
| District | Trump | Clinton | Representative |
|---|---|---|---|
| 1st | 56% | 41% | Buddy Carter |
| 2nd | 43% | 55% | Sanford Bishop |
| 3rd | 64% | 33% | Lynn Westmoreland |
| Drew Ferguson | |||
| 4th | 22% | 75% | Hank Johnson |
| 5th | 12% | 85% | John Lewis |
| 6th | 48% | 47% | Tom Price |
| 7th | 51% | 45% | Rob Woodall |
| 8th | 63% | 34% | Austin Scott |
| 9th | 78% | 19% | Doug Collins |
| 10th | 61% | 36% | Jody Hice |
| 11th | 60% | 35% | Barry Loudermilk |
| 12th | 57% | 41% | Rick W. Allen |
| 13th | 27% | 71% | David Scott |
| 14th | 75% | 22% | Tom Graves |
See also[]
| Elections in Georgia |
|---|
 |
|
|
|
|
|
|
|
|
|
|
- 2016 Democratic Party presidential debates and forums
- 2016 Democratic Party presidential primaries
- 2016 Republican Party presidential debates and forums
- 2016 Republican Party presidential primaries
References[]
- ^ ("Official 2016 Presidential General Election Results" (PDF). Federal Election Commission. December 2017. Retrieved December 19, 2020.) ("Voting and Registration in the Election of November 2016". United States Census Bureau. May 2017. Retrieved May 3, 2021.)
- ^ "Distribution of Electoral Votes". National Archives and Records Administration. 19 September 2019. Retrieved November 25, 2020.
- ^ "Georgia Election Results 2016 – The New York Times". Retrieved November 10, 2016.
- ^ "2016 Presidential General Election Data - National". Dave Leip's Atlas of U.S. Elections. Retrieved May 11, 2019.
- ^ "United States House of Representatives floor summary for Jan 8, 2009". Clerk.house.gov. Archived from the original on 2012-04-02. Retrieved January 30, 2009.
- ^ "Federal elections 2008" (PDF). Federal Election Commission. Retrieved May 11, 2015.
- ^ "President Map". The New York Times. November 29, 2012. Retrieved May 11, 2015.
- ^ "Election Other – President Obama Job Approval". RealClearPolitics. Retrieved December 24, 2015.
- ^ Byrnes, Jesse (2016-06-15). "Poll: Obama approval rating highest since 2012". TheHill. Retrieved 2016-06-19.
- ^ Cohn, Nate (2015-01-19). "What a Rise in Obama's Approval Rating Means for 2016". The New York Times. ISSN 0362-4331. Retrieved 2016-06-19.
- ^ "Joe Biden Decides Not to Enter Presidential Race". The Wall Street Journal. Retrieved October 21, 2015.
- ^ "Georgia Republican Delegation 2016". www.thegreenpapers.com. Retrieved 2017-02-25.
- ^ "An Open Letter to Greens in Georgia: Ballot Access can be had in 2016". Georgia Green Party. April 16, 2016. Retrieved April 26, 2016.[permanent dead link]
- ^ "The Final 15: The Latest Polls in the Swing States That Will Decide the Election". ABC News. November 7, 2016. Retrieved February 9, 2019.
- ^ Chalian, David (November 4, 2016). "Road to 270: CNN's new election map". CNN. Retrieved February 9, 2019.
- ^ "2016 Electoral Scorecard". The Cook Political Report. November 7, 2016. Retrieved February 9, 2019.
- ^ "2016 Predicted Electoral Map". Electoral-vote.com. Retrieved February 9, 2019.
- ^ "Our final map has Clinton winning with 352 electoral votes. Compare your picks with ours". Los Angeles Times. November 6, 2016. Retrieved February 9, 2019.
- ^ Todd, Chuck (November 7, 2016). "NBC's final battleground map shows a lead for Clinton". NBC News. Retrieved February 9, 2019.
- ^ "2016 Election Maps - Battle for White House". RealClearPolitics. Retrieved February 9, 2019.
- ^ "Presidential Ratings". The Rothenberg Political Report. Retrieved August 16, 2021.
- ^ Sabato, Larry (November 7, 2016). "The Crystal Ball's 2016 Electoral College ratings". University of Virginia Center for Politics. Retrieved February 9, 2019.
- ^ "RealClearPolitics - Election 2016 - Georgia: Trump vs. Clinton".
- ^ "Presidential Results by Congressional District, 2000-2008 – Swing State Project". www.swingstateproject.com. Retrieved April 6, 2018.
External links[]
- RNC 2016 Republican Nominating Process Archived 2016-11-08 at the Wayback Machine
- Green papers for 2016 primaries, caucuses, and conventions
- Decision Desk Headquarter Results for Georgia
State and district results of the 2016 United States presidential election | ||
|---|---|---|
|  | |
- 2016 United States presidential election by state
- United States presidential elections in Georgia (U.S. state)
- 2016 Georgia (U.S. state) elections