2016 United States presidential election in Oregon
| ||||||||||||||||||||||||||
| Turnout | 70.26% (eligible voters) | |||||||||||||||||||||||||
|---|---|---|---|---|---|---|---|---|---|---|---|---|---|---|---|---|---|---|---|---|---|---|---|---|---|---|
| ||||||||||||||||||||||||||
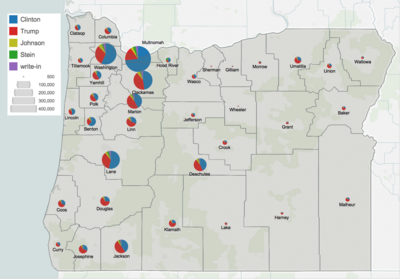
 County Results
| ||||||||||||||||||||||||||
| ||||||||||||||||||||||||||

| Elections in Oregon |
|---|
 |
|
|
|
|
|
|
|
|
The 2016 United States presidential election in Oregon was held on Tuesday, November 8, 2016, as part of the 2016 United States presidential election in which all 50 states plus the District of Columbia participated. Oregon voters chose electors to represent them in the Electoral College via a popular vote, pitting the Republican Party's nominee, businessman Donald Trump, and running mate Indiana Governor Mike Pence against Democratic Party nominee, former Secretary of State Hillary Clinton, and her running mate Virginia Senator Tim Kaine. Oregon has seven electoral votes in the Electoral College.[3]
The Democratic presidential candidate has won Oregon in every election since 1988. Clinton continued this tradition, carrying the state with 50% of the vote, a slightly reduced margin from Barack Obama in 2012, but with a slightly higher raw vote total, becoming only the second presidential candidate to win more than a million votes in the process. Trump received 39% of the vote, a smaller proportion of the vote compared to that of Mitt Romney in 2012. However, he did achieve a notable feat in carrying Columbia County, becoming the first Republican to do so since Herbert Hoover in 1928.[4] In addition, this was also the first presidential election since 1976 in which Clackamas County backed the losing candidate, with Trump becoming the first Republican ever to win the White House without carrying the county.
Background[]
The incumbent President of the United States, Barack Obama, a Democrat and former U.S. Senator from Illinois, was first elected president in the 2008 election, running with former Senator Joe Biden of Delaware. Defeating the Republican nominee, Senator John McCain of Arizona, with 52.9% of the popular vote and 68% of the electoral vote,[5][6] Obama succeeded two-term Republican President George W. Bush, the former Governor of Texas. Obama and Biden were reelected in the 2012 presidential election, defeating former Massachusetts Governor Mitt Romney with 51.1% of the popular vote and 61.7% of electoral votes.[7] Although Barack Obama's approval rating in the RealClearPolitics poll tracking average remained between 40% and 50% for most of his second term, it has experienced a surge in early 2016 and reached its highest point since 2012 during June of that year.[8][9] Analyst Nate Cohn has noted that a strong approval rating for President Obama would equate to a strong performance for the Democratic candidate, and vice versa.[10]
Following his second term, President Obama was not eligible for another reelection. In October 2015, Obama's running-mate and two-term Vice President Biden decided not to enter the race for the Democratic presidential nomination either.[11] With their terms expiring on January 20, 2017, the electorate is asked to elect a new president, the 45th president and 48th vice president of the United States, respectively.
Political landscape in Oregon[]
Besides Lyndon Johnson's landslide victory in 1964, the Republican party's candidate won Oregon in every year from 1948 through 1984. Since then, however, the Democratic candidate has carried the state in every election, including a narrow victory in the 2000 election. The last statewide election won by a Republican candidate was in the 2002 Senate election, all statewide elected officials as of election day were Democrats, and Barack Obama defeated Mitt Romney by 12.09% in the 2012 election. Generally, Eastern Oregon is more conservative, while Western Oregon is more Liberal.
Primary elections[]
Democratic primary[]
Two candidates appeared on the Democratic presidential primary ballot:
- Bernie Sanders
- Hillary Clinton
| |||||||||||||||||||
| |||||||||||||||||||
 Oregon results by county Bernie Sanders Hillary Clinton | |||||||||||||||||||
The 74 delegates from Oregon were allocated in this way. 41 delegates were allocated based on the popular vote in each congressional district with district 2 split (district 2 was split because of its size with district 2a including the northern part of the district and 2b containing the southern part of the district). Another 20 delegates were allocated proportionally based on the statewide popular vote. The state also had 13 super delegates.[12]
| Oregon Democratic primary, May 17, 2016 | |||||
|---|---|---|---|---|---|
| Candidate | Popular vote | Estimated delegates | |||
| Count | Percentage | Pledged | Unpledged | Total | |
| Bernie Sanders | 360,829 | 56.24% | 36 | 3 | 39 |
| Hillary Clinton | 269,846 | 42.06% | 25 | 7 | 32 |
| Misc. | 10,920 | 1.70% | 0 | 0 | 0 |
| (available) | N/A | 0 | 3 | 3 | |
| Total | 641,595 | 100% | 61 | 13 | 74 |
| Source: The Green Papers, Oregon Secretary of State - Official Election Results | |||||
Republican primary[]
Six candidates appeared on the Republican presidential primary ballot:
- Jeb Bush (withdrawn)
- Ben Carson (withdrawn)
- Ted Cruz (withdrawn)
- John Kasich (withdrawn)
- Marco Rubio (withdrawn)
- Donald Trump
| |||||||||||||||||||||||||
| |||||||||||||||||||||||||
 Oregon results by county Donald Trump (Note: Italicization indicates a withdrawn candidacy) | |||||||||||||||||||||||||


The 28 delegates from Oregon were allocated proportionally based on the statewide popular vote.[13]
| Candidate | Votes | Percentage | Actual delegate count | ||
|---|---|---|---|---|---|
| Bound | Unbound | Total | |||
| Donald Trump | 252,748 | 64.16% | 18 | 0 | 18 |
| Ted Cruz (withdrawn) | 65,513 | 16.63% | 5 | 0 | 5 |
| John Kasich (withdrawn) | 62,248 | 15.80% | 5 | 0 | 5 |
| Write-in | 13,411 | 3.40% | 0 | 0 | 0 |
| Unprojected delegates: | 0 | 0 | 0 | ||
| Total: | 393,920 | 100.00% | 28 | 0 | 28 |
| Source: The Green Papers | |||||
Green primary[]
This state's Green Party held its presidential preference vote on May 21.
On May 22, it was announced that Jill Stein had won the preference vote.[14]
| Candidate | Votes | Percentage | National delegates |
|---|---|---|---|
| Jill Stein | - | - | 6 |
| Sedinam Kinamo Christin Moyowasifza Curry | - | - | 1 |
| Uncommitted | - | - | 1 |
| Total | - | - | 8 |
Libertarian primary[]
The Oregon primary was completed on May 27, 2016, the last day to receive mail-in ballots.
| Candidate | Votes | Percentage |
|---|---|---|
| Gary Johnson | 422 | 57% |
| John McAfee | 105 | 14% |
| Merry Susan Nehls | 34 | 5% |
| Austin Petersen (write-in) | 25 | 3% |
| Darryl Perry | 21 | 3% |
| Keenan Dunham | 18 | 2% |
| Derrick Michael Reid | 10 | 1% |
| Rhett Smith | 6 | 1% |
| NOTA (write-in) | 2 | 0% |
| Other write-ins | 91 | 12% |
| Total | 742 | 100% |
Independent Party of Oregon primary[]
The Independent Party held a primary election on July 18. The party's ballot included Bernie Sanders (D), Hillary Clinton (D), Donald Trump (R), Ted Cruz (R), John Kasich (R), Gary Johnson (L), Jill Stein (G) and a "none of these candidates" choice.[17] Bernie Sanders won the primary election with 31.5% of the vote, narrowly defeating Donald Trump's 30.08%. Hillary Clinton came in third, with 24.02% of the vote. Members were allowed to select one or more candidates.[18]
| Candidate | Party | Percentage |
|---|---|---|
| Bernie Sanders | Democrat | 31.5% |
| Donald Trump | Republican | 30.08% |
| Hillary Clinton | Democrat | 24.02% |
| None of the above | N/A | 9.17% |
| Gary Johnson | Libertarian | 16.07% |
| Jill Stein | Green | 9.49% |
| Ted Cruz | Republican | 5.68% |
| John Kasich | Republican | 12.27% |
General election[]
Predictions[]
| Source | Ranking | As of |
|---|---|---|
| Los Angeles Times[19] | Safe D | November 6, 2016 |
| CNN[20] | Safe D | November 4, 2016 |
| Cook Political Report[21] | Safe D | November 7, 2016 |
| Electoral-vote.com[22] | Safe D | November 8, 2016 |
| Rothenberg Political Report[23] | Safe D | November 7, 2016 |
| Sabato's Crystal Ball[24] | Safe D | November 7, 2016 |
| RealClearPolitics[25] | Lean D | November 8, 2016 |
| Fox News[26] | Safe D | November 7, 2016 |
Polling[]
Democrat Hillary Clinton won every pre-election poll conducted in the state except one and led by margins of 7 to 13 points in most polls. The average of the final 3 polls showed Hillary Clinton leading Trump 44% to 36%.[27]
Results[]
| Party | Candidate | Votes | % | |
|---|---|---|---|---|
| Democratic | Hillary Clinton | 1,002,106 | 50.07% | |
| Republican | Donald Trump | 782,403 | 39.09% | |
| Libertarian | Gary Johnson | 94,231 | 4.71% | |
| Pacific Green | Jill Stein | 50,002 | 2.50% | |
| write-ins | 72,594 | 3.63% | ||
| Total votes | 2,001,336 | 100.00% | ||
Hillary Clinton carried the state, lengthening the Democratic streak in Oregon to 8 straight contests.
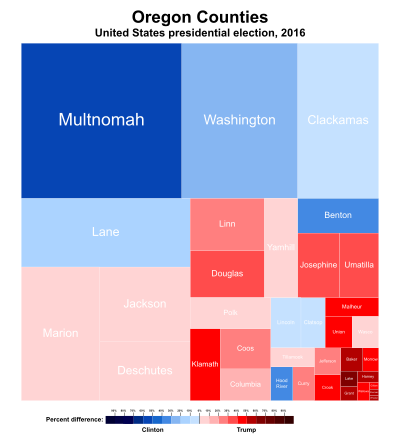
Results by county[]
| County | Hillary R. Clinton | Donald J. Trump | Gary E. Johnson | Jill E. Stein | Others | Margin | Total Votes | ||||||
|---|---|---|---|---|---|---|---|---|---|---|---|---|---|
| # | % | # | % | # | % | # | % | # | % | # | % | ||
| Baker | 1,797 | 20.47% | 6,218 | 70.83% | 413 | 4.70% | 134 | 1.53% | 217 | 2.47% | -4,421 | -50.36% | 8,779 |
| Benton | 29,193 | 59.88% | 13,445 | 27.58% | 2,692 | 5.52% | 1,595 | 3.27% | 1,828 | 3.75% | 15,748 | 32.30% | 48,753 |
| Clackamas | 102,095 | 47.70% | 88,392 | 41.30% | 11,053 | 5.16% | 4,001 | 1.87% | 8,498 | 3.97% | 20,703 | 6.40% | 214,039 |
| Clatsop | 9,252 | 47.05% | 8,138 | 41.39% | 973 | 4.95% | 569 | 2.89% | 732 | 3.72% | 1,114 | 5.67% | 19,664 |
| Columbia | 10,167 | 38.20% | 13,217 | 49.65% | 1,646 | 6.18% | 572 | 2.15% | 1,016 | 3.82% | -3,050 | -11.46% | 26,618 |
| Coos | 10,448 | 33.37% | 17,865 | 57.05% | 1,411 | 4.51% | 755 | 2.41% | 834 | 2.66% | -7,417 | -23.69% | 31,313 |
| Crook | 2,637 | 21.66% | 8,511 | 69.92% | 518 | 4.26% | 157 | 1.29% | 349 | 2.87% | -5,874 | -48.26% | 12,172 |
| Curry | 4,300 | 34.10% | 7,212 | 57.19% | 498 | 3.95% | 273 | 2.16% | 328 | 2.60% | -2,912 | -23.09% | 12,611 |
| Deschutes | 42,444 | 43.07% | 45,692 | 46.36% | 5,158 | 5.23% | 1,998 | 2.03% | 3,265 | 3.31% | -3,248 | -3.30% | 98,557 |
| Douglas | 14,096 | 26.34% | 34,582 | 64.61% | 2,413 | 4.51% | 1,021 | 1.91% | 1,409 | 2.63% | -20,486 | -38.28% | 53,521 |
| Gilliam | 239 | 23.45% | 671 | 65.85% | 79 | 7.75% | 7 | 0.69% | 23 | 2.26% | -432 | -42.39% | 1,019 |
| Grant | 739 | 17.03% | 3,210 | 73.96% | 209 | 4.82% | 48 | 1.11% | 134 | 3.09% | -2,471 | -56.94% | 4,340 |
| Harney | 683 | 17.19% | 2,912 | 73.28% | 222 | 5.59% | 42 | 1.06% | 115 | 2.89% | -2,229 | -56.09% | 3,974 |
| Hood River | 6,510 | 59.67% | 3,272 | 29.99% | 511 | 4.68% | 300 | 2.75% | 317 | 2.91% | 3,238 | 29.68% | 10,910 |
| Jackson | 44,447 | 40.66% | 53,870 | 49.27% | 4,373 | 4.00% | 2,996 | 2.74% | 3,641 | 3.33% | -9,423 | -8.62% | 109,327 |
| Jefferson | 2,980 | 31.50% | 5,483 | 57.97% | 493 | 5.21% | 182 | 1.92% | 321 | 3.33% | -2,503 | -26.46% | 9,459 |
| Josephine | 13,453 | 30.19% | 26,923 | 60.42% | 1,829 | 4.10% | 1,057 | 2.37% | 1,298 | 2.91% | -13,470 | -30.23% | 44,560 |
| Klamath | 7,210 | 23.63% | 20,435 | 66.98% | 1,525 | 5.00% | 508 | 1.67% | 829 | 2.72% | -13,225 | -43.35% | 30,507 |
| Lake | 639 | 16.26% | 3,022 | 76.90% | 151 | 3.84% | 42 | 1.07% | 76 | 1.93% | -2,383 | -60.64% | 3,930 |
| Lane | 102,753 | 53.53% | 67,141 | 34.98% | 8,476 | 4.42% | 6,302 | 3.28% | 7,278 | 3.79% | 35,612 | 18.55% | 191,950 |
| Lincoln | 12,501 | 49.50% | 10,039 | 39.75% | 1,130 | 4.47% | 748 | 2.96% | 838 | 3.32% | 2,462 | 9.75% | 25,256 |
| Linn | 17,995 | 30.65% | 33,488 | 57.03% | 3,431 | 5.84% | 1,339 | 2.28% | 2,466 | 4.20% | -15,493 | -26.63% | 58,179 |
| Malheur | 2,246 | 21.52% | 7,194 | 68.94% | 427 | 4.09% | 177 | 1.70% | 391 | 3.75% | -4,948 | -47.42% | 10,435 |
| Marion | 57,788 | 42.23% | 63,377 | 46.31% | 7,058 | 5.16% | 2,868 | 2.10% | 5,749 | 4.20% | -5,589 | -4.09% | 136,840 |
| Morrow | 1,017 | 24.41% | 2,721 | 65.30% | 238 | 5.71% | 52 | 1.25% | 139 | 3.34% | -1,704 | -40.89% | 4,167 |
| Multnomah | 292,561 | 73.30% | 67,954 | 17.03% | 12,862 | 3.22% | 12,969 | 3.25% | 12,757 | 3.20% | 224,607 | 56.28% | 399,103 |
| Polk | 16,420 | 40.75% | 18,940 | 47.00% | 2,254 | 5.59% | 907 | 2.25% | 1,774 | 4.40% | -2,520 | -6.25% | 40,295 |
| Sherman | 202 | 19.86% | 732 | 71.98% | 44 | 4.33% | 11 | 1.08% | 28 | 2.75% | -530 | -52.11% | 1,017 |
| Tillamook | 5,768 | 41.79% | 6,538 | 47.37% | 760 | 5.51% | 333 | 2.41% | 404 | 2.93% | -770 | -5.58% | 13,803 |
| Umatilla | 7,673 | 27.80% | 17,059 | 61.81% | 1,457 | 5.28% | 489 | 1.77% | 919 | 3.33% | -9,386 | -34.01% | 27,597 |
| Union | 3,249 | 25.05% | 8,431 | 65.01% | 673 | 5.19% | 198 | 1.53% | 417 | 3.22% | -5,182 | -39.96% | 12,968 |
| Wallowa | 1,116 | 25.56% | 2,848 | 65.23% | 179 | 4.10% | 82 | 1.88% | 141 | 3.23% | -1,732 | -39.67% | 4,366 |
| Wasco | 4,781 | 39.96% | 5,833 | 48.75% | 689 | 5.76% | 239 | 2.00% | 422 | 3.53% | -1,052 | -8.79% | 11,964 |
| Washington | 153,251 | 56.92% | 83,197 | 30.90% | 15,266 | 5.67% | 6,005 | 2.23% | 11,513 | 4.28% | 70,054 | 26.02% | 269,232 |
| Wheeler | 155 | 18.95% | 591 | 72.25% | 46 | 5.62% | 10 | 1.22% | 16 | 1.96% | -436 | -53.30% | 818 |
| Yamhill | 19,301 | 39.59% | 23,250 | 47.69% | 3,074 | 6.31% | 1,016 | 2.08% | 2,112 | 4.33% | -3,949 | -8.10% | 48,753 |
| Total | 1,002,106 | 50.09% | 782,403 | 39.10% | 94,231 | 4.71% | 50,002 | 2.50% | 72,594 | 3.63% | 219,703 | 10.98% | 2,000,796 |
Counties that flipped from Democratic to Republican[]
- Columbia (largest city: St. Helens)
- Tillamook (largest city: Tillamook)
By congressional district[]
Clinton won 4 of 5 congressional districts.[29]
| District | Trump | Clinton | Representative |
|---|---|---|---|
| 1st | 33% | 55% | Suzanne Bonamici |
| 2nd | 55% | 35% | Greg Walden |
| 3rd | 22% | 68% | Earl Blumenauer |
| 4th | 46% | 46.1% | Peter DeFazio |
| 5th | 42% | 46% | Kurt Schrader |
See also[]
- 2016 Democratic Party presidential debates and forums
- 2016 Democratic Party presidential primaries
- 2016 Republican Party presidential debates and forums
- 2016 Republican Party presidential primaries
References[]
- ^ Oregon State Elections Division (2016). "[PARTICIPATION] STATISTICAL SUMMARY - NOVEMBER 8, 2016, GENERAL ELECTION". Oregon Secretary of State. Retrieved October 3, 2018.
- ^ Betsy Hammond (December 12, 2016). "Oregon voters shattered previous participation rates in November 2016". The Oregonian. Retrieved October 3, 2018.
- ^ "Distribution of Electoral Votes". National Archives and Records Administration. 19 September 2019. Retrieved December 24, 2020.
- ^ Sullivan, Robert David; ‘How the Red and Blue Map Evolved Over the Past Century’; America Magazine in The National Catholic Review; June 29, 2016
- ^ "United States House of Representatives floor summary for Jan 8, 2009". Clerk.house.gov. Archived from the original on April 2, 2012. Retrieved January 30, 2009.
- ^ "Federal elections 2008" (PDF). Federal Election Commission. Retrieved May 11, 2015.
- ^ "President Map". The New York Times. November 29, 2012. Retrieved May 11, 2015.
- ^ "Election Other – President Obama Job Approval". RealClearPolitics. Retrieved December 24, 2015.
- ^ Byrnes, Jesse (2016-06-15). "Poll: Obama approval rating highest since 2012". TheHill. Retrieved 2016-06-19.
- ^ Cohn, Nate (2015-01-19). "What a Rise in Obama's Approval Rating Means for 2016". The New York Times. ISSN 0362-4331. Retrieved 2016-06-19.
- ^ "Joe Biden Decides Not to Enter Presidential Race". The Wall Street Journal. Retrieved October 21, 2015.
- ^ "Oregon Democratic Delegation 2016". www.thegreenpapers.com. Retrieved 2017-02-25.
- ^ "Oregon Republican Delegation 2016". www.thegreenpapers.com. Retrieved 2017-02-25.
- ^ "Stein wins six Oregon delegates, Moyowasifza-Curry one – Green Party Watch". Retrieved 2016-06-18.
- ^ "2016 Election Rules". The Libertarian Party of Oregon. Archived from the original on 27 March 2016. Retrieved 19 March 2016.
- ^ "Oregon Libertarian Primary Raw Results". Independent Political Report. 8 June 2016. Retrieved 8 June 2016.
- ^ "Independent Party of Oregon". Retrieved 23 July 2016.
- ^ "2016 IPO PRESIDENTIAL BALLOT & MEMBER SURVEY RESULTS (UNOFFICIAL)" (PDF). Archived from the original (PDF) on 4 August 2016. Retrieved 31 July 2016.
- ^ "Our final map has Clinton winning with 352 electoral votes. Compare your picks with ours". Los Angeles Times. 2016-11-06. Retrieved 2016-11-13.
- ^ Chalian, David (November 4, 2016). "Road to 270: CNN's new election map". CNN. Retrieved March 3, 2019.
- ^ "2016 Electoral Scorecard". The Cook Political Report. November 7, 2016. Retrieved March 3, 2019.
- ^ "2016 Electoral Map Prediction". Electoral-vote.com. November 8, 2016. Retrieved March 3, 2019.
- ^ "Presidential Ratings". The Rothenberg Political Report. Retrieved August 16, 2021.
- ^ Sabato, Larry J. (November 7, 2016). "2016 President". University of Virginia Center for Politics. Retrieved March 3, 2019.
- ^ "2016 Election Maps - Battle for White House". RealClearPolitics. Retrieved 2016-11-13.
- ^ "Electoral Scorecard: Map shifts again in Trump's favor, as Clinton holds edge". Fox News. 2016-11-07. Retrieved 2016-11-13.
- ^ "RealClearPolitics - Election 2016 - Oregon: Trump vs. Clinton".
- ^ "November 8, 2016, General Election Abstract of Votes". Oregon Secretary of State. Oregon Secretary of State. Retrieved 9 December 2016.
- ^ David Nir. "Daily Kos Elections' presidential results by congressional district for 2016, 2012, and 2008". The Daily Kos. Retrieved September 30, 2020.
External links[]
- RNC 2016 Republican Nominating Process Archived 2016-11-08 at the Wayback Machine
- Green papers for 2016 primaries, caucuses, and conventions
State and district results of the 2016 United States presidential election | ||
|---|---|---|
|  | |
- 2016 Oregon elections
- 2016 United States presidential election by state
- United States presidential elections in Oregon