2019 Dover District Council election
| |||||||||||||||||||||
All 32 seats on Dover District Council 17 seats needed for a majority | |||||||||||||||||||||
|---|---|---|---|---|---|---|---|---|---|---|---|---|---|---|---|---|---|---|---|---|---|
| |||||||||||||||||||||
 | |||||||||||||||||||||
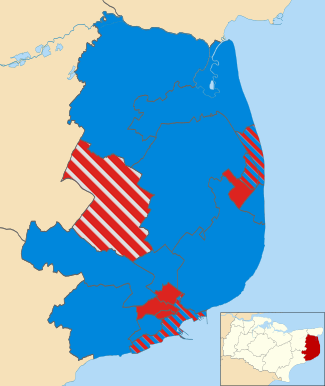
The 2019 Dover District Council election took place on 2 May 2019 to elect members of the Dover District Council in Kent, England. It was held on the same day as other local elections. It was the first election to be held after boundary changes reduced the number of seats from 45 to 32.[2] The Conservative Party retained overall control of the council.[3]
Ward results[]
Alkham and Capel-le-Ferne[]
| Party | Candidate | Votes | % | ±% | |
|---|---|---|---|---|---|
| Conservative | James Rose | 455 | 52.1 | ||
| Liberal Democrats | Aston Mannerings | 317 | 36.3 | ||
| Labour | Susan Carlyle | 101 | 11.6 | ||
| Majority | |||||
| Turnout | 896 | 33.7 | |||
| Conservative win (new seat) | |||||
Aylesham, Eythorne and Shepherdswell[]
| Party | Candidate | Votes | % | ±% | |
|---|---|---|---|---|---|
| Labour | Linda Keen | 997 | 39.9 | ||
| Labour | Charles Woodgate | 915 | 36.6 | ||
| Independent | Peter Walker | 914 | 36.6 | ||
| Conservative | Marjorie Ovenden | 908 | 36.3 | ||
| Labour | Gordon Cowan | 872 | 34.9 | ||
| Conservative | Martin Bates | 786 | 31.4 | ||
| Liberal Democrats | Annabel Stogdon | 450 | 18.0 | ||
| Turnout | 2,531 | 31.1 | |||
| Labour win (new seat) | |||||
| Labour win (new seat) | |||||
| Independent win (new seat) | |||||
Buckland[]
| Party | Candidate | Votes | % | ±% | |
|---|---|---|---|---|---|
| Labour | Kevin Mills | 504 | 41.1 | ||
| Labour | Charlotte Zosseder | 463 | 37.8 | ||
| Conservative | John Morgan | 387 | 31.6 | ||
| Conservative | Brian Rowland | 334 | 27.3 | ||
| Our Nation | Graham Lane | 297 | 24.2 | ||
| Independent | Neil Rix | 229 | 18.7 | ||
| Turnout | 1,249 | 23.2 | |||
| Labour win (new seat) | |||||
| Labour win (new seat) | |||||
Dover Downs and River[]
| Party | Candidate | Votes | % | ±% | |
|---|---|---|---|---|---|
| Conservative | David Beaney | 902 | 50.0 | ||
| Conservative | Mark Rose | 850 | 47.1 | ||
| Liberal Democrats | Penelope James | 490 | 27.2 | ||
| Labour | Lesley Stephenson | 476 | 26.4 | ||
| Liberal Democrats | Stephen Green | 411 | 22.8 | ||
| Turnout | 1,869 | 35.1 | |||
| Conservative win (new seat) | |||||
| Conservative win (new seat) | |||||
Eastry Rural[]
| Party | Candidate | Votes | % | ±% | |
|---|---|---|---|---|---|
| Conservative | Nicholas Kenton | 800 | 47.5 | ||
| Conservative | Stephen Manion | 764 | 45.4 | ||
| Green | Simon Phillips | 759 | 45.1 | ||
| Labour | Angela Ray | 519 | 30.8 | ||
| Turnout | 1,712 | 34.9 | |||
| Conservative win (new seat) | |||||
| Conservative win (new seat) | |||||
Guston, Kingsdown and St. Margaret's-at-Cliffe[]
| Party | Candidate | Votes | % | ±% | |
|---|---|---|---|---|---|
| Conservative | Keith Morris | 1,159 | 52.1 | ||
| Conservative | Oliver Richardson | 938 | 42.1 | ||
| Green | Nicolas Shread | 531 | 23.9 | ||
| Labour | Margaret Cosin | 431 | 19.4 | ||
| Renew | Stephen Wisbey | 389 | 17.5 | ||
| Labour | Jeffrey Loffman | 340 | 15.3 | ||
| Independent | Peter Powell | 211 | 9.5 | ||
| Turnout | 2,248 | 39.1 | |||
| Conservative win (new seat) | |||||
| Conservative win (new seat) | |||||
Little Stour and Ashstone[]
| Party | Candidate | Votes | % | ±% | |
|---|---|---|---|---|---|
| Conservative | Trevor Bartlett | 1,207 | 57.9 | ||
| Conservative | Michael Conolly | 1,123 | 53.9 | ||
| Green | Fiona Mason | 548 | 26.3 | ||
| Liberal Democrats | Luke Lyden | 331 | 15.9 | ||
| Liberal Democrats | Nigel Whitburn | 323 | 15.5 | ||
| Labour | Anthony Pollitt | 284 | 13.6 | ||
| Turnout | 2,123 | 37.5 | |||
| Conservative win (new seat) | |||||
| Conservative win (new seat) | |||||
Maxton and Elms Vale[]
| Party | Candidate | Votes | % | ±% | |
|---|---|---|---|---|---|
| Conservative | Roger Walkden | 373 | 44.7 | ||
| Labour | Ann Napier | 339 | 40.6 | ||
| Liberal Democrats | Caroline Howden | 122 | 14.6 | ||
| Majority | |||||
| Turnout | 861 | 29.1 | |||
| Conservative win (new seat) | |||||
Middle Deal[]
| Party | Candidate | Votes | % | ±% | |
|---|---|---|---|---|---|
| Conservative | Trevor Bond | 660 | 39.2 | ||
| Labour | David Cronk | 620 | 36.9 | ||
| Conservative | David Hawkes | 553 | 32.9 | ||
| Labour | Eileen Rowbotham | 536 | 31.9 | ||
| Green | Anne Farrington | 414 | 24.6 | ||
| Liberal Democrats | Bernadette Gosling | 181 | 10.8 | ||
| Our Nation | Stephen Connor | 157 | 9.3 | ||
| Turnout | 1,707 | 30.5 | |||
| Conservative win (new seat) | |||||
| Labour win (new seat) | |||||
Mill Hill[]
| Party | Candidate | Votes | % | ±% | |
|---|---|---|---|---|---|
| Labour | Joseph Burman | 709 | 40.1 | ||
| Labour | Helen Williams | 664 | 37.5 | ||
| Conservative | Derek Bond | 530 | 30.0 | ||
| Green | Michael Eddy | 509 | 28.8 | ||
| Conservative | Keith Lee | 466 | 26.3 | ||
| Green | Christine Oliver | 446 | 25.2 | ||
| Turnout | 1,816 | 30.1 | |||
| Labour win (new seat) | |||||
| Labour win (new seat) | |||||
North Deal[]
| Party | Candidate | Votes | % | ±% | |
|---|---|---|---|---|---|
| Labour | Susan Beer | 891 | 42.4 | ||
| Conservative | Peter Jull | 825 | 39.2 | ||
| Conservative | Daniel Friend | 802 | 38.2 | ||
| Labour | William Gardner | 790 | 37.6 | ||
| Liberal Democrats | Linda Hook | 490 | 23.3 | ||
| Turnout | 2,178 | 37.2 | |||
| Labour win (new seat) | |||||
| Conservative win (new seat) | |||||
Sandwich[]
| Party | Candidate | Votes | % | ±% | |
|---|---|---|---|---|---|
| Conservative | Michael Holloway | 883 | 42.8 | ||
| Conservative | Susan Chandler | 872 | 42.3 | ||
| Independent | Paul Carter | 639 | 31.0 | ||
| Liberal Democrats | Anne Fox | 371 | 18.0 | ||
| Labour | Benet Bano | 351 | 17.0 | ||
| Green | Peter Cutler | 328 | 15.9 | ||
| Labour | David Wood | 314 | 15.2 | ||
| Turnout | 2,086 | 40.3 | |||
| Conservative win (new seat) | |||||
| Conservative win (new seat) | |||||
St. Radigund's[]
| Party | Candidate | Votes | % | ±% | |
|---|---|---|---|---|---|
| Labour | Susan Jones | 425 | 42.8 | ||
| Labour | John Haste | 319 | 32.2 | ||
| Green | Jacqueline Garnett | 273 | 27.5 | ||
| Conservative | Andy Calder | 271 | 27.3 | ||
| Conservative | Callum Warriner | 242 | 24.4 | ||
| Our Nation | Amanda Heafey | 157 | 15.8 | ||
| Turnout | 1,014 | 22.4 | |||
| Labour win (new seat) | |||||
| Labour win (new seat) | |||||
Tower Hamlets[]
| Party | Candidate | Votes | % | ±% | |
|---|---|---|---|---|---|
| Labour | Pamela Brivio | 307 | 47.2 | +13.9 | |
| Conservative | Ann Jenner | 133 | 20.5 | -2.4 | |
| Our Nation | Ben Glayzer | 110 | 16.9 | New | |
| Green | Brian Murphy | 100 | 15.4 | +4.3 | |
| Majority | |||||
| Turnout | 667 | 23.9 | |||
| Labour win (new seat) | |||||
Town and Castle[]
| Party | Candidate | Votes | % | ±% | |
|---|---|---|---|---|---|
| Conservative | David Hannent | 458 | 30.3 | ||
| Labour | Edward Biggs | 425 | 28.1 | ||
| Conservative | Richard Jeacock | 407 | 26.9 | ||
| Independent | Graham Wanstall | 395 | 26.1 | ||
| Independent | Christopher Precious | 367 | 24.3 | ||
| Labour | Miriam Wood | 347 | 22.9 | ||
| Green | Rebecca Sawbridge | 312 | 20.6 | ||
| Turnout | 1,548 | 26.9 | |||
| Conservative win (new seat) | |||||
| Labour win (new seat) | |||||
Walmer[]
| Party | Candidate | Votes | % | ±% | |
|---|---|---|---|---|---|
| Conservative | Christopher Vinson | 1,062 | 46.2 | ||
| Conservative | Derek Murphy | 956 | 41.5 | ||
| Green | John Lonsdale | 621 | 27.0 | ||
| Green | Daniel Symons | 604 | 26.2 | ||
| Labour | Ruth Harris-Small | 444 | 19.3 | ||
| Labour | Hilary Preidel | 408 | 17.7 | ||
| Liberal Democrats | James Caple | 234 | 10.2 | ||
| Turnout | 2,349 | 40.4 | |||
| Conservative win (new seat) | |||||
| Conservative win (new seat) | |||||
Whitfield[]
| Party | Candidate | Votes | % | ±% | |
|---|---|---|---|---|---|
| Conservative | James Back | 775 | 56.4 | ||
| Conservative | Nigel Collor | 703 | 51.2 | ||
| Labour | Lee Kettlewell | 298 | 21.7 | ||
| Labour | Roland Zosseder | 256 | 18.6 | ||
| Green | Sarah Waite Gleave | 228 | 16.6 | ||
| Liberal Democrats | Richard Beal | 224 | 16.3 | ||
| Turnout | 1,402 | 29.4 | |||
| Conservative win (new seat) | |||||
| Conservative win (new seat) | |||||
By-elections[]
Mill Hill[]
| Party | Candidate | Votes | % | ±% | |
|---|---|---|---|---|---|
| Conservative | David Hawkes | 716 | 40.3 | +10.3 | |
| Labour | Jeffrey Loffman | 608 | 34.2 | -5.9 | |
| Green | Mike Eddy | 292 | 16.4 | -12.4 | |
| Independent | Chris Tough | 103 | 5.8 | N/A | |
| Liberal Democrats | Rick Blackwell | 59 | 3.3 | N/A | |
| Majority | 108 | 6.1 | |||
| Turnout | 1,778 | ||||
| Conservative gain from Labour | Swing | ||||
Alkham & Capel-Le-Ferne[]
| Party | Candidate | Votes | % | ±% | |
|---|---|---|---|---|---|
| Conservative | Martin Hibbert | 315 | 48.7 | -3.4 | |
| Liberal Democrats | Roben Franklin | 173 | 26.7 | -9.6 | |
| Labour | Gordon Cowan | 101 | 15.6 | +4.0 | |
| Green | Nick Shread | 58 | 9.0 | New | |
| Majority | 142 | 22.0 | |||
| Turnout | 651 | 24.7 | |||
| Conservative hold | Swing | ||||
Sandwich[]
| Party | Candidate | Votes | % | ±% | |
|---|---|---|---|---|---|
| Conservative | Daniel Friend | 721 | 51.6 | +8.8 | |
| Liberal Democrats | Anne Fox | 676 | 48.4 | +30.4 | |
| Majority | 45 | 3.2 | |||
| Turnout | 1,407 | 27.4 | |||
| Conservative hold | Swing | ||||
References[]
- ^ "Declaration of Result of Poll Dover District Council" (PDF). Dover District Council. 2 May 2019.
- ^ "The Dover (Electoral Changes) Order 2019". legislation.gov.uk. 29 January 2019.
- ^ "Dover District Council". BBC News. 2 May 2019.
| Metropolitan boroughs (England) |
|
|---|---|
| Unitary authorities (England) |
|
| District councils (England) |
|
| Mayoral elections (England) |
|
| District councils (Northern Ireland) |
|
| Kent County Council | |
|---|---|
| Ashford Borough Council | |
| Canterbury City Council |
|
| Dartford Borough Council | |
| Dover District Council | |
| Folkestone & Hythe District Council | |
| Gravesham Borough Council | |
| Maidstone Borough Council | |
| Medway Council |
|
| Orpington Urban District Council | |
| Sevenoaks District Council | |
| Swale Borough Council | |
| Thanet District Council | |
| Tonbridge & Malling Borough Council | |
| Tunbridge Wells Borough Council | |
| Rochester-upon-Medway City Council |
|
| Gillingham Borough Council |
|
| |
Categories:
- 2019 English local elections
- May 2019 events in the United Kingdom
- Dover District Council elections
- 2010s in Kent