2017 Kent County Council election
| |||||||||||||||||||||||||||||||||||||||||||||
All 81 seats to Kent County Council 41 seats needed for a majority | |||||||||||||||||||||||||||||||||||||||||||||
|---|---|---|---|---|---|---|---|---|---|---|---|---|---|---|---|---|---|---|---|---|---|---|---|---|---|---|---|---|---|---|---|---|---|---|---|---|---|---|---|---|---|---|---|---|---|
| |||||||||||||||||||||||||||||||||||||||||||||
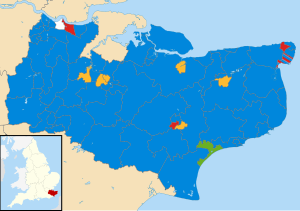 Map showing the results of the 2017 Kent County Council elections. | |||||||||||||||||||||||||||||||||||||||||||||
| |||||||||||||||||||||||||||||||||||||||||||||
The 2017 Kent County Council election was held on 4 May 2017 as part of the 2017 local elections in the United Kingdom.[1] All 81 councillors were elected from 72 electoral divisions, each of which returned either one or two county councillors by first-past-the-post voting for a four-year term of office. The Conservative Party retained control. UKIP, previously the second-largest party on the council, lost all their seats.
The Liberal Democrats regained status as the second largest party, which they had been 2009-2013. A notable triumph for Liberal Democrats was Antony Hook winning the Faversham division, which had been considered a "safe" Conservative seat. Antony Hook's campaign increased the Liberal Democrat vote share from 4% in 2013 to a winning 43%. Faversham also saw the largest turnout of any seat. The Labour Party lost seats, including those of their Leader Roger Truelove and previous leaders Gordon Cowan and Dr. Mike Eddy. The Labour vote share also fell but they retained status as 3rd party.
Ward boundary changes took effect at this election after a review of the county by the Local Government Boundary Commission for England.[2][3] Kent saw a large turnover of councillors. Of the 81 councillors elected in 2017, 39 had not served in the previous council.
Results[]
| Party | Seats | Gains | Losses | Net gain/loss | Seats % | Votes % | Votes | +/− | |
|---|---|---|---|---|---|---|---|---|---|
| Conservative | 67 | 24 | 1 | +23 | 82.71 | 50 | |||
| Liberal Democrats | 7 | 1 | 1 | 0 | 8.64 | 14 | |||
| Labour | 5 | 0 | 8 | -8 | 6.17 | 19 | |||
| Green | 1 | 0 | 0 | 0 | 1.23 | 5 | |||
| Swanscombe and Greenhithe Residents Association | 1 | 0 | 0 | 0 | 1.23 | <1 | - | ||
| UKIP | 0 | 0 | 17 | -17 | 0 | 10 | |||
Results by district[]
Ashford[]
| Party | Candidate | Votes | % | ±% | |
|---|---|---|---|---|---|
| Conservative | Paul Bartlett | 2,030 | 59 | ||
| Labour | John Charles Suddards | 638 | 18 | ||
| Liberal Democrats | Adrian John Gee-Turner | 366 | 11 | ||
| UKIP | Serge Xavier Goldenberg-Kosbab | 236 | 7 | ||
| Green | Liz Wright | 198 | 6 | ||
| Majority | 1,392 | 41 | |||
| Turnout | 3,468 | 27 | |||
| Conservative hold | Swing | ||||
| Party | Candidate | Votes | % | ±% | |
|---|---|---|---|---|---|
| Liberal Democrats | George Koowaree | 1,426 | 41 | ||
| Conservative | Larry William Krause | 971 | 28 | ||
| Labour | Martin Chandler | 534 | 15 | ||
| UKIP | Garry George Harrison | 338 | 10 | ||
| Green | Steven Robert Campkin | 191 | 6 | ||
| Majority | 455 | 13 | |||
| Turnout | 3,460 | 27 | |||
| Liberal Democrats hold | Swing | ||||
| Party | Candidate | Votes | % | ±% | |
|---|---|---|---|---|---|
| Conservative | Clair Bell | 2,621 | 60 | ||
| Liberal Democrats | Stuart James Dove | 686 | 16 | ||
| Labour | Lynda Suddards | 429 | 10 | ||
| Green | Geoff Meaden | 350 | 8 | ||
| UKIP | Pat Purnell | 269 | 6 | ||
| Majority | 1,935 | 44 | |||
| Turnout | 4,355 | 35 | |||
| Conservative hold | Swing | ||||
| Party | Candidate | Votes | % | ±% | |
|---|---|---|---|---|---|
| Conservative | Mike Angell | 2,405 | 62 | ||
| Labour | Vivien Wheatley | 523 | 14 | ||
| Liberal Democrats | Chris Grayling | 455 | 12 | ||
| UKIP | Liah Natasha MacPherson | 321 | 8 | ||
| Green | Marilyn Sansom | 161 | 4 | ||
| Majority | 1,882 | 48 | |||
| Turnout | 3,865 | 29 | |||
| Conservative hold | Swing | ||||
| Party | Candidate | Votes | % | ±% | |
|---|---|---|---|---|---|
| Conservative | Charlie Simkins | 2,780 | 63 | ||
| Liberal Democrats | Clare Hardwick | 579 | 13 | ||
| Labour | Sally Ann Gathern | 439 | 10 | ||
| UKIP | Norman Taylor | 349 | 8 | ||
| Green | Hilary Jones | 283 | 6 | ||
| Majority | 2,201 | 50 | |||
| Turnout | 4,430 | 31 | |||
| Conservative hold | Swing | ||||
| Party | Candidate | Votes | % | ±% | |
|---|---|---|---|---|---|
| Labour | Dara Farrell | 1,022 | 32 | ||
| Conservative | David Robey | 966 | 30 | ||
| UKIP | Ryan Paul MacPherson | 727 | 23 | ||
| Liberal Democrats | James Angus Galloway | 312 | 10 | ||
| Green | Claire Madeleine Wallington | 146 | 5 | ||
| Majority | 56 | 2 | |||
| Turnout | 3,173 | 23 | |||
| Labour hold | Swing | ||||
| Party | Candidate | Votes | % | ±% | |
|---|---|---|---|---|---|
| Conservative | Mike Hill, OBE | 3,383 | 71 | ||
| Liberal Democrats | Steve Bowen | 451 | 9 | ||
| UKIP | Eddy Barrows | 360 | 8 | ||
| Labour | Alexander Ward | 302 | 6 | ||
| Green | Guy Pullen | 269 | 6 | ||
| Majority | 2,932 | 62 | |||
| Turnout | 4,765 | 36 | |||
| Conservative hold | Swing | ||||
Canterbury[]
* This constituency boundaries for Canterbury were redrawn and percentage changes should thus be taken as rough approximations, particularly for the previously two-seat Whitstable constituency.
| Party | Candidate | Votes | % | ±% | |
|---|---|---|---|---|---|
| Conservative | Graham Gibbens | 1,665 | 36 | ||
| Labour | Mike Bland | 1,198 | 26 | ||
| Liberal Democrats | Andrew Lloyd Palmer | 1,137 | 25 | ||
| Green | Henry Stanton | 479 | 10 | ||
| UKIP | Richard Henry West | 193 | 4 | ||
| Majority | 467 | 10 | |||
| Turnout | 4,672 | 37 | |||
| Conservative hold | Swing | ||||
| Party | Candidate | Votes | % | ±% | |
|---|---|---|---|---|---|
| Liberal Democrats | Ida Ann Linfield | 1,863 | 41 | ||
| Labour | Simon Nicholas Warley | 1,087 | 24 | ||
| Conservative | Joe Egerton | 1,071 | 24 | ||
| Green | Pat Marsh | 313 | 7 | ||
| UKIP | Carole Anne Riley | 189 | 4 | ||
| Majority | 776 | 17 | |||
| Turnout | 4,523 | 33 | |||
| Liberal Democrats hold | Swing | ||||
| Party | Candidate | Votes | % | ±% | |
|---|---|---|---|---|---|
| Conservative | John Simmonds, MBE | 2,321 | 55 | ||
| Labour | Ben Hickman | 700 | 16 | ||
| Liberal Democrats | David Norman Prevett | 600 | 16 | ||
| Green | Andrew Peter Goatly | 287 | 7 | ||
| UKIP | Trevor William Dockwray | 240 | 6 | ||
| Majority | 1,621 | 39 | |||
| Turnout | 4,247 | 33 | |||
| Conservative hold | Swing | ||||
| Party | Candidate | Votes | % | ±% | |
|---|---|---|---|---|---|
| Conservative | Michael Northey | 2,151 | 44 | ||
| Liberal Democrats | Michael John Sole | 1,788 | 37 | ||
| Labour | Jean Elizabeth Butcher | 655 | 13 | ||
| Green | Frankie-Rose Taylor | 285 | 6 | ||
| Majority | 363 | 7 | |||
| Turnout | 4,879 | 40 | |||
| Conservative hold | Swing | ||||
| Party | Candidate | Votes | % | ±% | |
|---|---|---|---|---|---|
| Conservative | Andrew Cook | 2,399 | 55 | ||
| Labour | Jon Beer | 893 | 20 | ||
| UKIP | Nicholas Bond | 580 | 13 | ||
| Liberal Democrats | Ann Margaret Anderson | 506 | 12 | ||
| Majority | 1,506 | 35 | n/a | ||
| Turnout | 4,387 | 31 | |||
| Conservative gain from UKIP | Swing | ||||
| Party | Candidate | Votes | % | ±% | |
|---|---|---|---|---|---|
| Conservative | Alan Marsh | 2,637 | 60 | ||
| Labour | Lynn Faux-Bowyer | 769 | 18 | ||
| Liberal Democrats | Graham Dudley Wood | 403 | 9 | ||
| UKIP | Mick O'Brien | 391 | 9 | ||
| Green | Nathan James Geoffrey Tough | 189 | 4 | ||
| Majority | 1,868 | 42 | |||
| Turnout | 4,389 | 29 | |||
| Conservative hold | Swing | ||||
| Party | Candidate | Votes | % | ±% | |
|---|---|---|---|---|---|
| Conservative | Ian Thomas | 2,111 | 48 | ||
| Labour | Naomi Ruth Smith | 757 | 17 | ||
| Liberal Democrats | Mike Northern | 674 | 15 | ||
| UKIP | David Hirst | 649 | 15 | ||
| Green | Sarah Stanton | 178 | 4 | ||
| Majority | 1,354 | 31 | |||
| Turnout | 4,369 | 32 | |||
| Conservative gain from UKIP | Swing | ||||
| Party | Candidate | Votes | % | ±% | |
|---|---|---|---|---|---|
| Conservative | Mark Dance | 2,225 | 42 | ||
| Labour | Rachel Natalie Goodwin | 1,736 | 33 | ||
| Liberal Democrats | David John Mummery | 557 | 11 | ||
| UKIP | Richard Peter Riley | 414 | 8 | ||
| Green | Alex Stevens | 364 | 7 | ||
| Majority | 489 | 9 | |||
| Turnout | 5,296 | 36 | |||
| Conservative hold | Swing | ||||
Dartford[]
| Party | Candidate | Votes | % | ±% | |
|---|---|---|---|---|---|
| Conservative | Penny Cole | 1,914 | 62 | ||
| Labour | Catherine Mary Stafford | 696 | 22 | ||
| Liberal Democrats | Ashley MacTaggart | 497 | 16 | new | |
| Majority | 1,218 | 40 | |||
| Turnout | 3,007 | 23 | |||
| Conservative hold | Swing | ||||
| Party | Candidate | Votes | % | ±% | |
|---|---|---|---|---|---|
| Conservative | Dave Butler | 1,611 | 42 | ||
| Labour | Tom Maddison | 1,523 | 40 | ||
| UKIP | Ben Robert Fryer | 442 | 12 | ||
| Green | Andrew Danny Blatchford | 163 | 4 | new | |
| BNP | Ronald David Ball | 61 | 2 | ||
| Majority | 88 | 2 | n/a | ||
| Turnout | 3,800 | 28 | |||
| Conservative gain from Labour | Swing | ||||
| Party | Candidate | Votes | % | ±% | |
|---|---|---|---|---|---|
| Conservative | Jeremy Kite, MBE | 3,013 | 70 | ||
| Labour | Mandy Garford | 680 | 16 | ||
| UKIP | Ivan Paul Burch | 439 | 10 | ||
| Liberal Democrats | Edward Temple Waite | 165 | 4 | new | |
| Majority | 2,333 | 54 | |||
| Turnout | 4,297 | 33 | |||
| Conservative hold | Swing | ||||
| Party | Candidate | Votes | % | ±% | |
|---|---|---|---|---|---|
| Conservative | Jan Ozog | 2,077 | 49 | ||
| Labour | Sacha Navindra Gosine | 1,355 | 32 | ||
| UKIP | Jim Moore | 442 | 10 | ||
| Liberal Democrats | Ashley Francis Edward Wassall | 317 | 7 | new | |
| BNP | Michael Godfrey Cope | 36 | 1 | new | |
| Majority | 722 | 17 | |||
| Turnout | 4,227 | 31 | |||
| Conservative hold | Swing | ||||
| Party | Candidate | Votes | % | ±% | |
|---|---|---|---|---|---|
| Swanscombe and Greenhithe Residents' Association | Peter Harman | 1,093 | 43 | ||
| Conservative | Keith Martin Kelly | 634 | 25 | ||
| Labour | Claire Pearce | 634 | 25 | ||
| UKIP | Linda Janet Moore | 208 | 8 | ||
| Majority | 459 | 18 | |||
| Turnout | 2,569 | 24 | |||
| Swanscombe and Greenhithe Residents' Association hold | Swing | ||||
| Party | Candidate | Votes | % | ±% | |
|---|---|---|---|---|---|
| Conservative | Ann Allen, MBE | 2,610 | 63 | ||
| Labour | Joshua Jones | 841 | 20 | ||
| UKIP | Roger Errol Doucy | 497 | 12 | ||
| Liberal Democrats | Caroline Watkinson | 195 | 5 | new | |
| Majority | 1,769 | 43 | |||
| Turnout | 4,143 | 31 | |||
| Conservative hold | Swing | ||||
Dover[]
| Party | Candidate | Votes | % | ±% | |
|---|---|---|---|---|---|
| Conservative | Trevor Antony Bond | 3,969 | 47 | ||
| Conservative | Derek Murphy | 3,544 | 42 | ||
| Labour | Mike Eddy | 2,860 | 34 | ||
| Labour | Eileen Rowbotham | 2,751 | 33 | ||
| Liberal Democrats | Will Darlington | 779 | 9 | ||
| UKIP | Sylvia Angela Hanael | 699 | 8 | ||
| Liberal Democrats | John Charles Trickey | 610 | 7 | ||
| UKIP | Graham Francis Lane | 497 | 6 | ||
| Green | John Lonsdale | 491 | 6 | new | |
| Independent | Christopher James David Tough | 179 | 2 | new | |
| Majority | 684 | 8 | n/a | ||
| Turnout | 8,434 | 35 | |||
| Conservative gain from Labour | Swing | ||||
| Conservative gain from Labour | Swing | ||||
| Party | Candidate | Votes | % | ±% | |
|---|---|---|---|---|---|
| Conservative | Steve Manion | 2,074 | 54 | ||
| Labour | Charles Francis Woodgate | 1,173 | 30 | ||
| Green | Nick Fox | 311 | 8 | new | |
| UKIP | Tim Turner | 303 | 8 | new | |
| Majority | 901 | 24 | |||
| Turnout | 3,861 | 34 | |||
| Conservative hold | Swing | ||||
| Party | Candidate | Votes | % | ±% | |
|---|---|---|---|---|---|
| Conservative | Pauline Margaret Beresford | 2,832 | 41 | ||
| Conservative | Nigel Collor | 2,681 | 39 | ||
| Labour | Pam Brivio | 2,436 | 35 | ||
| Labour | Gordon Cowan | 1,989 | 29 | ||
| UKIP | Ben John Glayzer | 979 | 14 | ||
| UKIP | Georgette Rapley | 845 | 12 | ||
| Green | Beccy Sawbridge | 443 | 6 | new | |
| Liberal Democrats | Adrian John Briggs | 394 | 6 | ||
| Liberal Democrats | Carolyn Rose Hughes | 365 | 5 | ||
| Majority | 245 | 4 | n/a | ||
| Turnout | 6,877 | 27 | |||
| Conservative gain from Labour | Swing | ||||
| Conservative gain from Labour | Swing | ||||
| Party | Candidate | Votes | % | ±% | |
|---|---|---|---|---|---|
| Conservative | Geoff Lymer | 2,589 | 61 | ||
| Labour | Miriam Wood | 766 | 18 | ||
| UKIP | Peter John McDermott | 421 | 10 | ||
| Liberal Democrats | Jim Caple | 299 | 7 | ||
| Green | Sarah Gleave | 182 | 4 | new | |
| Majority | 1,823 | 43 | |||
| Turnout | 4,257 | 34 | |||
| Conservative hold | Swing | ||||
| Party | Candidate | Votes | % | ±% | |
|---|---|---|---|---|---|
| Conservative | Sue Chandler | 2,868 | 61 | ||
| Labour | David Pestell | 831 | 18 | ||
| Liberal Democrats | Wendy Ann Scott | 442 | 9 | ||
| UKIP | Lesley Anne Ede | 287 | 6 | ||
| Green | Aidan John Shanks | 251 | 5 | new | |
| Majority | 2,037 | 43 | |||
| Turnout | 4,684 | 36 | |||
| Conservative hold | Swing | ||||
Folkestone & Hythe[]
* All of the Folkestone & Hythe constituencies bar two were reorganised, therefore percentage changes have only been given for Elham Valley and Romney Marsh.
| Party | Candidate | Votes | % | ±% | |
|---|---|---|---|---|---|
| Conservative | Rory Cassian Love | 2,172 | 42 | n/a | |
| Liberal Democrats | Tim Prater | 1,217 | 24 | n/a | |
| Green | Ross Carter | 856 | 17 | n/a | |
| Labour | Paul Richard Bingham | 506 | 10 | n/a | |
| UKIP | Neil Lawrence Jones | 398 | 8 | n/a | |
| Majority | 955 | 18 | n/a | ||
| Turnout | 5,147 | 36 | n/a | ||
| Conservative gain from UKIP | Swing | ||||
| Party | Candidate | Votes | % | ±% | |
|---|---|---|---|---|---|
| Conservative | Susan Carey | 2,706 | 54 | ||
| UKIP | Stephen Terence Priestley | 639 | 13 | ||
| Green | Karen Jane White | 616 | 12 | new | |
| Liberal Democrats | Ross Clark | 515 | 10 | ||
| Labour | Aaron Simon Roche | 513 | 10 | ||
| Majority | 2,069 | 41 | |||
| Turnout | 4,989 | 36 | |||
| Conservative hold | Swing | ||||
| Party | Candidate | Votes | % | ±% | |
|---|---|---|---|---|---|
| Conservative | Dick Pascoe | 1,153 | 36 | n/a | |
| Labour | Arran Harvey | 831 | 26 | n/a | |
| UKIP | Mary Lawes | 660 | 20 | n/a | |
| Liberal Democrats | Lynne Beaumont | 542 | 17 | n/a | |
| Socialist (GB) | Max Lionel Hess | 48 | 1 | n/a | |
| Majority | 322 | 10 | n/a | ||
| Turnout | 3,234 | 25 | n/a | ||
| Conservative gain from UKIP | Swing | ||||
| Party | Candidate | Votes | % | ±% | |
|---|---|---|---|---|---|
| Conservative | David Drury Monk | 1,834 | 44 | n/a | |
| Labour | Laura Frances Davison | 841 | 20 | n/a | |
| Liberal Democrats | Gary Fuller | 521 | 13 | n/a | |
| UKIP | Stephen Jardine | 412 | 10 | n/a | |
| Green | Rebecca Tamsin Shoob | 325 | 8 | n/a | |
| Independent | Bryan Anthony Rylands | 191 | 5 | n/a | |
| Socialist (GB) | Andy Thomas | 23 | 1 | n/a | |
| Majority | 993 | 24 | n/a | ||
| Turnout | 4,150 | 31 | n/a | ||
| Conservative gain from UKIP | Swing | ||||
| Party | Candidate | Votes | % | ±% | |
|---|---|---|---|---|---|
| Green | Martin Whybrow | 2,234 | 41 | n/a | |
| Conservative | David Lionel Godwin Owen | 2,044 | 38 | n/a | |
| UKIP | Ian Barry Meyers | 493 | 9 | n/a | |
| Labour | Christopher John Deane | 340 | 6 | n/a | |
| Liberal Democrats | Neil Matthews | 515 | 5 | n/a | |
| Majority | 190 | 3 | n/a | ||
| Turnout | 5,393 | 42 | n/a | ||
| Green hold | Swing | ||||
| Party | Candidate | Votes | % | ±% | |
|---|---|---|---|---|---|
| Conservative | Tony Hills | 2,218 | 42 | ||
| UKIP | Susie Govett | 1,077 | 20 | ||
| Independent | David Wimble | 1,061 | 20 | n/a | |
| Labour | Nicola Helen Deane | 361 | 7 | ||
| Liberal Democrats | Ted Last | 335 | 6 | ||
| Green | Andrew John South | 215 | 4 | ||
| Majority | 1,141 | 22 | n/a | ||
| Turnout | 5,268 | 36 | |||
| Conservative gain from UKIP | Swing | ||||
Gravesham[]
| Party | Candidate | Votes | % | ±% | |
|---|---|---|---|---|---|
| Conservative | Diane Marsh | 3,708 | 46 | ||
| Conservative | Alan Michael Ridgers | 3,332 | 42 | ||
| Labour | Colin Caller | 2,784 | 35 | ||
| Labour | Lyn Milner | 2,730 | 34 | ||
| UKIP | Tina Brooker | 1,182 | 15 | ||
| Green | Martin James Wilson | 385 | 5 | new | |
| Liberal Democrats | James Martin Willis | 378 | 5 | ||
| Green | Marna Eilish Gilligan | 310 | 4 | new | |
| Liberal Democrats | Mason Cole | 267 | 3 | ||
| Majority | 548 | 7 | n/a | ||
| Turnout | 7,987 | 26 | |||
| Conservative gain from Labour | Swing | ||||
| Conservative gain from Labour | Swing | ||||
| Party | Candidate | Votes | % | ±% | |
|---|---|---|---|---|---|
| Conservative | Bryan Sweetland | 3,975 | 71 | ||
| Labour | Doug Christie | 740 | 13 | ||
| Liberal Democrats | John Richard Death | 440 | 8 | new | |
| UKIP | Ryan Andrew Waters | 407 | 7 | new | |
| Majority | 3,235 | 58 | |||
| Turnout | 5,562 | 36 | |||
| Conservative hold | Swing | ||||
| Party | Candidate | Votes | % | ±% | |
|---|---|---|---|---|---|
| Labour | Tan Dhesi | 3,786 | 44 | ||
| Labour | Lauren Sullivan | 3,621 | 42 | ||
| Conservative | Conrad Broadley | 3,390 | 39 | ||
| Conservative | Gary John Harding | 3,149 | 36 | ||
| UKIP | David Shaun Beattie | 883 | 10 | ||
| UKIP | Emmanuel Korede Feyisetan | 649 | 7 | ||
| Liberal Democrats | Sharan Virk | 386 | 4 | new | |
| Green | Erin Claire Johnson | 374 | 4 | new | |
| Liberal Democrats | Mark John Powell Marsh | 365 | 4 | new | |
| Green | Ruiha Gayle Smalley | 218 | 3 | new | |
| Majority | 231 | 3 | |||
| Turnout | 8,682 | 30 | |||
| Labour hold | Swing | ||||
| Labour hold | Swing | ||||
Maidstone[]
| Party | Candidate | Votes | % | ±% | |
|---|---|---|---|---|---|
| Liberal Democrats | Dan Daley | 3,540 | 42 | ||
| Liberal Democrats | Rob Bird | 3,140 | 38 | ||
| Conservative | Alan Bartlett | 2,746 | 33 | ||
| Conservative | Graham Alexander Jarvis | 2,246 | 27 | ||
| Labour | Paul Harper | 1,319 | 16 | ||
| UKIP | Pamela Elizabeth Watts | 647 | 8 | ||
| Green | Stuart Robert Jeffery | 470 | 6 | ||
| Green | Donna Louise Greenan | 444 | 5 | ||
| Majority | 394 | 5 | |||
| Turnout | 8,367 | 30 | |||
| Liberal Democrats hold | Swing | ||||
| Liberal Democrats hold | Swing | ||||
| Party | Candidate | Votes | % | ±% | |
|---|---|---|---|---|---|
| Liberal Democrats | Ian Chittenden | 2,232 | 50 | ||
| Conservative | Cheryl Janette Taylor Maggio | 1,411 | 32 | ||
| Labour | Joanna Burns | 332 | 7 | ||
| UKIP | Nick Goddard | 310 | 7 | ||
| Green | Belinda Anne Bassett | 148 | 3 | ||
| Majority | 821 | 18 | |||
| Turnout | 4,433 | 32 | |||
| Liberal Democrats hold | Swing | ||||
| Party | Candidate | Votes | % | ±% | |
|---|---|---|---|---|---|
| Conservative | Shellina Prendergast | 3,482 | 70 | ||
| UKIP | Mark John McGiffin | 472 | 9 | new | |
| Liberal Democrats | Paul John Wilby | 458 | 9 | ||
| Labour | Malcolm McKay | 397 | 8 | ||
| Green | Derek Roy Eagle | 201 | 4 | ||
| Majority | 3,010 | 61 | |||
| Turnout | 5,010 | 36 | |||
| Conservative hold | Swing | ||||
| Party | Candidate | Votes | % | ±% | |
|---|---|---|---|---|---|
| Conservative | Paul Carter, CBE | 3,042 | 66 | ||
| Liberal Democrats | Martin Ashley Richard Cox | 530 | 11 | ||
| Labour | Tim Licence | 441 | 10 | ||
| UKIP | Gordon Newton | 408 | 9 | ||
| Green | Ciaran Dominic Oliver | 197 | 4 | ||
| Majority | 2,512 | 55 | |||
| Turnout | 4,618 | 33 | |||
| Conservative hold | Swing | ||||
| Party | Candidate | Votes | % | ±% | |
|---|---|---|---|---|---|
| Conservative | Eric Hotson | 2,912 | 68 | ||
| Liberal Democrats | Derek John Mortimer | 610 | 14 | ||
| Labour | Stella Marlyn Randall | 398 | 9 | new | |
| Green | Caroline Jessel | 356 | 8 | ||
| Majority | 2,302 | 54 | |||
| Turnout | 4,276 | 34 | |||
| Conservative hold | Swing | ||||
| Party | Candidate | Votes | % | ±% | |
|---|---|---|---|---|---|
| Conservative | Paulina Stockell | 2,351 | 49 | ||
| Liberal Democrats | Brian Mortimer | 1,716 | 36 | ||
| UKIP | Martin Peter Lack | 348 | 7 | ||
| Labour | Richard John Coates | 259 | 5 | ||
| Green | Geoffrey Wilkinson | 140 | 3 | ||
| Majority | 635 | 13 | |||
| Turnout | 4,814 | 39 | |||
| Conservative hold | Swing | ||||
| Party | Candidate | Votes | % | ±% | |
|---|---|---|---|---|---|
| Conservative | Paul Charles Cooper | 1,872 | 42 | ||
| Liberal Democrats | Brian Clark | 1,561 | 35 | ||
| UKIP | Michael Hogg | 418 | 9 | new | |
| Labour | Patrick Frederick Coates | 371 | 8 | ||
| Green | Ian McDonald | 101 | 2 | ||
| Independent | Yolande Ann Kenward | 82 | 2 | new | |
| Independent | Gary Butler | 46 | 1 | new | |
| Majority | 311 | 7 | n/a | ||
| Turnout | 4,451 | 33 | |||
| Conservative gain from Liberal Democrats | Swing | ||||
| Party | Candidate | Votes | % | ±% | |
|---|---|---|---|---|---|
| Conservative | Gary Cooke | 1,496 | 52 | ||
| UKIP | Eddie Powell | 543 | 19 | new | |
| Labour | Dan Wilkinson | 496 | 17 | ||
| Liberal Democrats | David Sandru Naghi | 247 | 9 | ||
| Green | Steven Cheeseman | 107 | 4 | ||
| Majority | 953 | 33 | |||
| Turnout | 2,888 | 24 | |||
| Conservative hold | Swing | ||||
Sevenoaks[]
| Party | Candidate | Votes | % | ±% | |
|---|---|---|---|---|---|
| Conservative | Roger Gough | 3,289 | 64 | ||
| Labour | Theo Michael | 502 | 10 | ||
| Liberal Democrats | Krish Shanmuganathan | 476 | 9 | ||
| Green | Philip Dodd | 463 | 9 | new | |
| UKIP | Graham Russell Cushway | 374 | 7 | ||
| Majority | 2,787 | 54 | |||
| Turnout | 5,104 | 32 | |||
| Conservative hold | Swing | ||||
| Party | Candidate | Votes | % | ±% | |
|---|---|---|---|---|---|
| Conservative | David Brazier | 3,371 | 78 | ||
| Labour | Lucas Jacob Pearce | 539 | 12 | ||
| Green | Mark Richard Lindop | 435 | 10 | new | |
| Majority | 2,832 | 66 | |||
| Turnout | 4,345 | 30 | |||
| Conservative hold | Swing | ||||
| Party | Candidate | Votes | % | ±% | |
|---|---|---|---|---|---|
| Conservative | Peter William Ariel Lake | 2,749 | 63 | ||
| Liberal Democrats | Richard Giles Streatfeild | 878 | 20 | ||
| Labour | James Fredrick Charles Parish | 354 | 8 | ||
| Green | Amelie Elisabeth Boleyn | 280 | 6 | new | |
| Independent | Alan Dharmendra Damodaran | 72 | 2 | new | |
| Majority | 1,871 | 43 | |||
| Turnout | 4,333 | 34 | |||
| Conservative hold | Swing | ||||
| Party | Candidate | Votes | % | ±% | |
|---|---|---|---|---|---|
| Conservative | Margaret Crabtree | 2,483 | 48 | ||
| Liberal Democrats | Tony Clayton | 2,046 | 40 | ||
| Labour | Michael James Hogg | 346 | 7 | ||
| UKIP | Gerald Michael O'Brien | 293 | 6 | ||
| Majority | 437 | 8 | |||
| Turnout | 5,168 | 35 | |||
| Conservative hold | Swing | ||||
| Party | Candidate | Votes | % | ±% | |
|---|---|---|---|---|---|
| Conservative | Nick Chard | 3,025 | 63 | ||
| Liberal Democrats | Merilyn Canet | 719 | 15 | ||
| Labour | Neil Malcolm Proudfoot | 432 | 9 | ||
| UKIP | Chris Stewart | 301 | 6 | ||
| Green | Sarah Jane White | 298 | 6 | ||
| Majority | 2,306 | 48 | |||
| Turnout | 4,775 | 32 | |||
| Conservative hold | Swing | ||||
| Party | Candidate | Votes | % | ±% | |
|---|---|---|---|---|---|
| Conservative | Michael Horwood | 2,411 | 65 | ||
| Labour | Angela George | 886 | 24 | ||
| Liberal Democrats | John Owen Jones | 213 | 6 | new | |
| Green | Phil Levy | 118 | 3 | ||
| BNP | Clifford Le May | 94 | 3 | ||
| Majority | 1,525 | 41 | |||
| Turnout | 3,722 | 25 | |||
| Conservative hold | Swing | ||||
Swale[]
There are five single-member constituencies and one multi-member constituency within the District of Swale, which elect a total of seven councillors to Kent County Council. The electoral map of Swale was redrawn as a result of boundary changes which saw the old Swale Central multi-member ward split to create Sittingbourne North and Sittingbourne South, both single member divisions. Sheerness and Sheppey Divisions were merged to create the new Multi-member Sheppey Division. Swale District includes the Division of Faversham which saw Liberal Democrat Antony Hook winning the Faversham division, which had been considered a "safe" Conservative seat. Antony Hook's campaign increased the Liberal Democrat vote share from 4% in 2013 to a winning 43%. Faversham also saw the largest turnout of any seat. Boundary changes meant that Below are the results:[4]
| Party | Candidate | Votes | % | ±% | |
|---|---|---|---|---|---|
| Liberal Democrats | Antony Hook | 2,714 | 43 | ||
| Conservative | David Henry Simmons | 2218 | 35 | ||
| Labour | Trevor Raymond Payne | 863 | 14 | ||
| Green | Peter Hutchinson | 261 | 4 | new | |
| UKIP | Christine Margaret Palmer | 243 | 4 | ||
| Majority | 496 | 8 | n/a | ||
| Turnout | 6,299 | 43 | |||
| Liberal Democrats gain from Conservative | Swing | ||||
| Party | Candidate | Votes | % | ±% | |
|---|---|---|---|---|---|
| Conservative | Andy Booth | 3,093 | 43 | ||
| Conservative | Ken Pugh | 3,009 | 42 | ||
| Labour | Angela Harrison | 1,774 | 25 | ||
| UKIP | Richard William Darby | 1,485 | 21 | ||
| Labour | Gill Smith | 1,291 | 18 | ||
| UKIP | Mini Nissanga | 998 | 14 | ||
| Independent | Elliott Jayes | 593 | 8 | n/a | |
| Monster Raving Loony | Mad Mike Young | 339 | 5 | ||
| Green | Richard John Bishop | 337 | 5 | new | |
| Green | Dru Hopkins | 201 | 3 | new | |
| Liberal Democrats | David John Spurling | 175 | 2 | ||
| Independent | Mike Walters | 144 | 2 | new | |
| Majority | 1,235 | 17 | n/a | ||
| Turnout | 7,194 | 24 | |||
| Conservative gain from UKIP | Swing | ||||
| Conservative gain from Labour | Swing | ||||
| Party | Candidate | Votes | % | ±% | |
|---|---|---|---|---|---|
| Conservative | Sue Gent | 1,526 | 41 | ||
| Labour | Ghlin Whelan | 1,195 | 32 | ||
| UKIP | Jim Hall | 639 | 17 | ||
| Liberal Democrats | Tony Clark | 330 | 9 | ||
| Green | Huw Jones | 72 | 2 | new | |
| Majority | 331 | 9 | n/a | ||
| Turnout | 3,762 | 24 | |||
| Conservative gain from Labour | Swing | ||||
| Party | Candidate | Votes | % | ±% | |
|---|---|---|---|---|---|
| Conservative | John Wright | 1,972 | 42 | ||
| Labour | Roger Truelove | 1,955 | 41 | ||
| UKIP | Lee Burgess | 527 | 11 | ||
| Liberal Democrats | Gareth Dominic Edmund Arnold | 188 | 4 | ||
| Green | Jonathan Grace | 76 | 2 | new | |
| Majority | 17 | 1 | n/a | ||
| Turnout | 4,718 | 33 | |||
| Conservative gain from UKIP | Swing | ||||
| Party | Candidate | Votes | % | ±% | |
|---|---|---|---|---|---|
| Conservative | Andrew Bowles | 2,597 | 54 | ||
| UKIP | Richard Frank Palmer | 717 | 15 | ||
| Labour | Frances Rehal | 624 | 13 | ||
| Liberal Democrats | Eddie Thomas | 500 | 10 | ||
| Green | Alistair Gould | 367 | 8 | new | |
| Majority | 1,880 | 39 | |||
| Turnout | 4,805 | 37 | |||
| Conservative hold | Swing | ||||
| Party | Candidate | Votes | % | ±% | |
|---|---|---|---|---|---|
| Conservative | Mike Whiting | 2,159 | 43 | ||
| UKIP | Mike Baldock | 2040 | 40 | ||
| Labour | Tony Winkless | 495 | 10 | ||
| Liberal Democrats | Marc Wilson | 228 | 5 | ||
| Green | Tim Valentine | 120 | 2 | new | |
| Majority | 119 | 3 | n/a | ||
| Turnout | 5,042 | 32 | |||
| Conservative gain from UKIP | Swing | ||||
Thanet[]
| Party | Candidate | Votes | % | ±% | |
|---|---|---|---|---|---|
| Conservative | Emma Dawson | 4,529 | 54 | ||
| Conservative | Ken Gregory | 4,103 | 49 | ||
| Labour | Lynda Diana Robinson | 1,455 | 17 | ||
| UKIP | Suzanne Brimm | 1,418 | 17 | ||
| UKIP | Peter Evans | 1,141 | 14 | ||
| Labour | Seamus Yener | 1,115 | 13 | ||
| Liberal Democrats | Angie Curwen | 1,076 | 13 | ||
| Liberal Democrats | Martyn Harry Pennington | 819 | 10 | ||
| Green | Natasha Anne Ransom | 499 | 6 | new | |
| Majority | 684 | 32 | n/a | ||
| Turnout | 8,385 | 32 | |||
| Conservative gain from UKIP | Swing | ||||
| Conservative gain from UKIP | Swing | ||||
* Previously the one seat Birchington and Villages division.
| Party | Candidate | Votes | % | ±% | |
|---|---|---|---|---|---|
| Conservative | Rosalind Binks | 3,155 | 58 | ||
| Labour | Stuart James McCann | 1,172 | 21 | ||
| UKIP | Zita Wiltshire | 580 | 11 | ||
| Liberal Democrats | William Robert Hewer | 379 | 7 | ||
| Green | Terry MacDonald | 196 | 4 | ||
| Majority | 1,983 | 37 | n/a | ||
| Turnout | 5,482 | 38 | |||
| Conservative gain from UKIP | Swing | ||||
* Previously a two seat division.
| Party | Candidate | Votes | % | ±% | |
|---|---|---|---|---|---|
| Conservative | Lesley Game | 2,679 | 55 | ||
| Labour | Aram Ahmed Rawf | 965 | 20 | ||
| UKIP | Chris Wells | 648 | 13 | ||
| Liberal Democrats | Matthew David Brown | 246 | 5 | ||
| Independent | David Reginald Davidge | 163 | 3 | new | |
| Green | Mike White | 129 | 3 | ||
| Majority | 1,714 | 35 | n/a | ||
| Turnout | 4,830 | 35 | |||
| Conservative gain from UKIP | Swing | ||||
| Party | Candidate | Votes | % | ±% | |
|---|---|---|---|---|---|
| Labour | Barry Harvey Lewis | 1,268 | 44 | ||
| Conservative | Kerry Jane Boyd | 1,187 | 42 | ||
| Liberal Democrats | John Finnegan | 169 | 6 | ||
| Green | Bernard Charles Kirkham | 133 | 5 | new | |
| Independent | Pip Rees | 96 | 3 | new | |
| Majority | 81 | 2 | n/a | ||
| Turnout | 3,485 | 24 | |||
| Labour gain from UKIP | Swing | ||||
* Previously Margate West, as well as part of the Cliftonville division.
| Party | Candidate | Votes | % | ±% | |
|---|---|---|---|---|---|
| Labour | Karen Constantine | 3,200 | 34 | ||
| Conservative | Paul Joesph Messenger | 3,168 | 34 | ||
| Labour | Raushan Ara | 3,145 | 34 | ||
| Conservative | Marc Rattigan | 2,945 | 32 | ||
| UKIP | Trevor Shonk | 1,846 | 20 | ||
| UKIP | Lin Fairbrass | 1,746 | 19 | ||
| Independent | Ian Driver | 505 | 5 | ||
| Independent | Colin Grostate | 485 | 5 | new | |
| Liberal Democrats | Jordan Luke Williams | 479 | 5 | ||
| Liberal Democrats | Catherine Frances Hewer | 472 | 5 | ||
| Independent | Stefan John Connor Costen | 181 | 2 | new | |
| Majority | 23 | 0.2 | n/a | ||
| Turnout | 9,333 | 30 | |||
| Labour gain from UKIP | Swing | ||||
| Conservative gain from UKIP | Swing | ||||
Tonbridge and Malling[]
There are five single-member constituencies and one multi-member constituency within the District of Tonbridge and Malling, which elect a total of seven councillors to Kent County Council. Below are the results:[5]
| Party | Candidate | Votes | % | ±% | |
|---|---|---|---|---|---|
| Liberal Democrats | Trudy Dean | 2,576 | 57 | ||
| Conservative | Dougie Dick | 1,535 | 34 | ||
| Labour | Sarah Rosalind Palmer | 239 | 5 | ||
| UKIP | Helen Jean Brown | 182 | 4 | ||
| Majority | 1,041 | 23 | |||
| Turnout | 4,532 | 36 | |||
| Liberal Democrats hold | Swing | ||||
| Party | Candidate | Votes | % | ±% | |
|---|---|---|---|---|---|
| Conservative | Sarah Hohler | 2,512 | 65 | ||
| Labour | Wayne John Mallard | 763 | 20 | ||
| Liberal Democrats | Richard Stephen Selkirk | 411 | 11 | ||
| Green | Howard Porter | 158 | 4 | ||
| Majority | 1,749 | 45 | |||
| Turnout | 3,844 | 28 | |||
| Conservative hold | Swing | ||||
| Party | Candidate | Votes | % | ±% | |
|---|---|---|---|---|---|
| Conservative | Peter Homewood | 3,208 | 69 | ||
| Liberal Democrats | Darren Kent Nicholls | 620 | 13 | ||
| Labour | Lola Ayeni | 594 | 13 | ||
| Green | Steve Jackson | 217 | 5 | ||
| Majority | 2,588 | 56 | |||
| Turnout | 4,639 | 32 | |||
| Conservative hold | Swing | ||||
| Party | Candidate | Votes | % | ±% | |
|---|---|---|---|---|---|
| Conservative | Matthew Balfour | 3,230 | 74 | ||
| Liberal Democrats | Nicola Marie Gibb | 663 | 15 | ||
| Green | Jill Darby | 450 | 10 | ||
| Majority | 2,567 | 59 | |||
| Turnout | 4,343 | 31 | |||
| Conservative hold | Swing | ||||
| Party | Candidate | Votes | % | ±% | |
|---|---|---|---|---|---|
| Conservative | Harry Rayner | 3,208 | 69 | ||
| Liberal Democrats | Nicholas George Stapleton | 460 | 10 | ||
| Labour | Kathleen Maria Garlick | 336 | 7 | ||
| Green | Richard Paul Mountford | 312 | 7 | ||
| UKIP | Mike Jerrom | 311 | 7 | ||
| Majority | 2,748 | 59 | |||
| Turnout | 4,627 | 36 | |||
| Conservative hold | Swing | ||||
| Party | Candidate | Votes | % | ±% | |
|---|---|---|---|---|---|
| Conservative | Michael Douglas Payne | 4,647 | 52 | ||
| Conservative | Richard Long, TD | 4,464 | 50 | ||
| Liberal Democrats | Frances Annabel Hoskins | 1,413 | 16 | ||
| Labour | Mary Geraldine Ann Arigho | 1,209 | 14 | ||
| Liberal Democrats | Garry Christopher Bridge | 1,146 | 13 | ||
| Green | April Elizabeth Clark | 1,028 | 12 | ||
| Labour | Sacha Marten | 1,009 | 11 | ||
| Green | Mark Antony James Hood | 923 | 10 | ||
| UKIP | David John Allen | 766 | 9 | ||
| UKIP | Colin Robert Tarver Hussey | 723 | 8 | ||
| Majority | 3,051 | 34 | |||
| Turnout | 8,874 | 33 | |||
| Conservative hold | Swing | ||||
| Conservative hold | Swing | ||||
Tunbridge Wells[]
| Party | Candidate | Votes | % | ±% | |
|---|---|---|---|---|---|
| Conservative | Seán Holden | 2,932 | 60 | ||
| Independent | Nancy Warne | 988 | 20 | new | |
| Liberal Democrats | Clare Katherine Bishop | 647 | 13 | ||
| Labour | Ian Patrick Carvell | 306 | 6 | ||
| Majority | 1,944 | 40 | |||
| Turnout | 4,873 | 35 | |||
| Conservative hold | Swing | ||||
| Party | Candidate | Votes | % | ±% | |
|---|---|---|---|---|---|
| Conservative | Paul Vincent Barrington-King | 1,953 | 41 | ||
| Liberal Democrats | Allen David Lear | 912 | 19 | ||
| Independent | Terry Cload | 850 | 18 | ||
| Labour | Tim Rich | 567 | 12 | ||
| UKIP | Chris Hoare | 429 | 9 | ||
| Majority | 1,041 | 22 | n/a | ||
| Turnout | 4,711 | 35 | |||
| Conservative gain from UKIP | Swing | ||||
| Party | Candidate | Votes | % | ±% | |
|---|---|---|---|---|---|
| Conservative | Peter Oakford | 2,017 | 42 | ||
| Labour | Martin Roland Betts | 1,248 | 26 | ||
| Liberal Democrats | Marguerita Morton | 1,172 | 25 | ||
| UKIP | William O'Shea | 215 | 4 | ||
| Green | Anthony Hoskin | 128 | 3 | ||
| Majority | 769 | 16 | |||
| Turnout | 4,780 | 35 | |||
| Conservative hold | Swing | ||||
| Party | Candidate | Votes | % | ±% | |
|---|---|---|---|---|---|
| Conservative | Sarah Hamilton | 2,928 | 65 | ||
| Labour | Raymond Peter Moon | 600 | 13 | ||
| Liberal Democrats | Tom Deacon | 475 | 11 | ||
| UKIP | Colin Nicholson | 266 | 6 | ||
| Green | Trevor Tyrone Bisdee | 219 | 5 | new | |
| Majority | 2,328 | 52 | |||
| Turnout | 4,488 | 35 | |||
| Conservative hold | Swing | ||||
| Party | Candidate | Votes | % | ±% | |
|---|---|---|---|---|---|
| Conservative | Catherine Rankin | 2,716 | 53 | ||
| Liberal Democrats | Andrew Thomas Hickey | 888 | 17 | ||
| Labour | Lorna Blackmore | 573 | 11 | ||
| Women's Equality | Céline Thomas | 474 | 9 | new | |
| UKIP | Naz Mian | 219 | 4 | ||
| Green | John Anthony Hurst | 215 | 4 | new | |
| Majority | 1,828 | 36 | |||
| Turnout | 5,085 | 36 | |||
| Conservative hold | Swing | ||||
| Party | Candidate | Votes | % | ±% | |
|---|---|---|---|---|---|
| Conservative | James McInroy | 2,720 | 55 | ||
| Liberal Democrats | Alan James Bullion | 884 | 18 | ||
| Labour | Alex Britcher | 718 | 15 | ||
| Green | David Charles Holton | 350 | 7 | ||
| UKIP | Russell Robert Bishop | 259 | 5 | ||
| Majority | 1,836 | 37 | |||
| Turnout | 4,931 | 35 | |||
| Conservative hold | Swing | ||||
References[]
- ^ "Upcoming elections & referendums". Electoral Commission. Archived from the original on 5 May 2018. Retrieved 16 September 2016.
- ^ "The Kent (Electoral Changes) Order 2016". legislation.gov.uk. Retrieved 16 September 2016.
- ^ "Kent County Council". Local Government Boundary Commission for England. Retrieved 16 September 2016.
- ^ "Kent County Council election".
- ^ [1][permanent dead link]
- Kent County Council elections
- 2017 English local elections
- 2010s in Kent