Aguinaldo, Ifugao
Aguinaldo | |
|---|---|
| Municipality of Aguinaldo | |
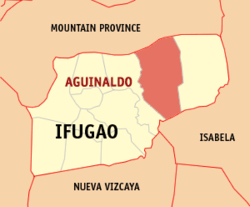 Map of Ifugao with Aguinaldo highlighted | |
OpenStreetMap  | |
 Aguinaldo Location within the Philippines | |
| Coordinates: 16°49′14″N 121°27′47″E / 16.820614°N 121.462936°ECoordinates: 16°49′14″N 121°27′47″E / 16.820614°N 121.462936°E | |
| Country | Philippines |
| Region | Cordillera Administrative Region |
| Province | Ifugao |
| District | Lone district |
| Founded | September 20, 1980 |
| Barangays | 16 (see Barangays) |
| Government | |
| • Type | Sangguniang Bayan |
| • Mayor | Gaspar B. Chilagan Jr. |
| • Vice Mayor | Tony L. Chilagan |
| • Representative | Solomon R. Chungalao |
| • Electorate | 11,651 voters (2019) |
| Area | |
| • Total | 538.05 km2 (207.74 sq mi) |
| Elevation | 88 m (289 ft) |
| Highest elevation | 1,457 m (4,780 ft) |
| Lowest elevation | 431 m (1,414 ft) |
| Population (2020 census) [3] | |
| • Total | 21,128 |
| • Density | 39/km2 (100/sq mi) |
| • Households | 4,658 |
| Economy | |
| • Income class | 2nd municipal income class |
| • Poverty incidence | 31.36% (2015)[4] |
| • Revenue | ₱201,903,996.71 (2020) |
| • Assets | ₱431,432,919.31 (2020) |
| • Expenditure | ₱128,562,832.58 (2020) |
| • Liabilities | ₱71,027,496.17 (2020) |
| Service provider | |
| • Electricity | Ifugao Electric Cooperative (IFELCO) |
| Time zone | UTC+8 (PST) |
| ZIP code | 3606 |
| PSGC | |
| IDD : area code | +63 (0)74 |
| Native languages | Ifugao Tuwali Ilocano Tagalog |
| Website | www |

Aguinaldo, officially the Municipality of Aguinaldo, is a 2nd class municipality in the province of Ifugao, Philippines. According to the 2020 census, it has a population of 21,128 people. [3]
Batas Pambansa Bilang 86, approved on September 20, 1980, created the municipality out of Barangays Bunhian, Damag, Galonogon, Itab, Jacmal, Taang, Talete and Ubao, from the Municipality of Mayoyao.
The economy is mostly agricultural with palay as the main crop.
Barangays[]
Aguinaldo is politically subdivided into 16 barangays.142708000
- Awayan
- Bunhian
- Butac
- Buwag
- Chalalo
- Damag
- Galonogon
- Halag
- Itab
- Jacmal
- Majlong
- Mongayang
- Posnaan
- Ta-ang
- Talite
- Ubao
Climate[]
| Climate data for Aguinaldo, Ifugao | |||||||||||||
|---|---|---|---|---|---|---|---|---|---|---|---|---|---|
| Month | Jan | Feb | Mar | Apr | May | Jun | Jul | Aug | Sep | Oct | Nov | Dec | Year |
| Average high °C (°F) | 21 (70) |
23 (73) |
25 (77) |
28 (82) |
28 (82) |
27 (81) |
27 (81) |
26 (79) |
26 (79) |
25 (77) |
24 (75) |
22 (72) |
25 (77) |
| Average low °C (°F) | 16 (61) |
16 (61) |
17 (63) |
19 (66) |
20 (68) |
20 (68) |
20 (68) |
20 (68) |
20 (68) |
19 (66) |
19 (66) |
17 (63) |
19 (66) |
| Average precipitation mm (inches) | 103 (4.1) |
73 (2.9) |
49 (1.9) |
38 (1.5) |
141 (5.6) |
144 (5.7) |
172 (6.8) |
181 (7.1) |
155 (6.1) |
148 (5.8) |
147 (5.8) |
208 (8.2) |
1,559 (61.5) |
| Average rainy days | 17.1 | 12.8 | 11.0 | 9.6 | 18.9 | 21.5 | 22.5 | 24.5 | 21.7 | 16.1 | 17.1 | 20.5 | 213.3 |
| Source: Meteoblue [5] | |||||||||||||
Demographics[]
| Year | Pop. | ±% p.a. |
|---|---|---|
| 1990 | 19,830 | — |
| 1995 | 12,623 | −8.11% |
| 2000 | 16,377 | +5.74% |
| 2007 | 17,231 | +0.70% |
| 2010 | 18,610 | +2.84% |
| 2015 | 19,408 | +0.80% |
| 2020 | 21,128 | +1.68% |
| Source: Philippine Statistics Authority [6] [7] [8][9] | ||
In the 2020 census, the population of Aguinaldo, Ifugao, was 21,128 people, [3] with a density of 39 inhabitants per square kilometre or 100 inhabitants per square mile.
Economy[]
| Poverty Incidence of Aguinaldo | |
| Source: Philippine Statistics Authority[10][11][12][13][14][15][16] | |
References[]
- ^ Municipality of Aguinaldo | (DILG)
- ^ "2015 Census of Population, Report No. 3 – Population, Land Area, and Population Density" (PDF). Philippine Statistics Authority. Quezon City, Philippines. August 2016. ISSN 0117-1453. Archived (PDF) from the original on May 25, 2021. Retrieved July 16, 2021.
- ^ a b c Census of Population (2020). "Cordillera Administrative Region (CAR)". Total Population by Province, City, Municipality and Barangay. PSA. Retrieved 8 July 2021.
- ^ https://psa.gov.ph/sites/default/files/City%20and%20Municipal-level%20Small%20Area%20Poverty%20Estimates_%202009%2C%202012%20and%202015_0.xlsx; publication date: 10 July 2019; publisher: Philippine Statistics Authority.
- ^ "Aguinaldo: Average Temperatures and Rainfall". Meteoblue. Retrieved 8 March 2020.
- ^ Census of Population (2015). "Cordillera Administrative Region (CAR)". Total Population by Province, City, Municipality and Barangay. PSA. Retrieved 20 June 2016.
- ^ Census of Population and Housing (2010). "Cordillera Administrative Region (CAR)". Total Population by Province, City, Municipality and Barangay. NSO. Retrieved 29 June 2016.
- ^
Censuses of Population (1903–2007). "Cordillera Administrative Region (CAR)". Table 1. Population Enumerated in Various Censuses by Province/Highly Urbanized City: 1903 to 2007. NSO.
{{cite encyclopedia}}: CS1 maint: url-status (link) - ^ "Province of Ifugao". Municipality Population Data. Local Water Utilities Administration Research Division. Retrieved 17 December 2016.
- ^ "Poverty incidence (PI):". Philippine Statistics Authority. Retrieved 28 December 2020.
- ^ https://psa.gov.ph/sites/default/files/NSCB_LocalPovertyPhilippines_0.pdf; publication date: 29 November 2005; publisher: Philippine Statistics Authority.
- ^ https://psa.gov.ph/sites/default/files/2003%20SAE%20of%20poverty%20%28Full%20Report%29_1.pdf; publication date: 23 March 2009; publisher: Philippine Statistics Authority.
- ^ https://psa.gov.ph/sites/default/files/2006%20and%202009%20City%20and%20Municipal%20Level%20Poverty%20Estimates_0_1.pdf; publication date: 3 August 2012; publisher: Philippine Statistics Authority.
- ^ https://psa.gov.ph/sites/default/files/2012%20Municipal%20and%20City%20Level%20Poverty%20Estima7tes%20Publication%20%281%29.pdf; publication date: 31 May 2016; publisher: Philippine Statistics Authority.
- ^ https://psa.gov.ph/sites/default/files/City%20and%20Municipal-level%20Small%20Area%20Poverty%20Estimates_%202009%2C%202012%20and%202015_0.xlsx; publication date: 10 July 2019; publisher: Philippine Statistics Authority.
- ^ "PSA Releases the 2018 Municipal and City Level Poverty Estimates". Philippine Statistics Authority. 15 December 2021. Retrieved 22 January 2022.
External links[]
- Aguinaldo Profile at PhilAtlas.com
- Municipality of Aguinaldo official website
- Philippine Standard Geographic Code
- Philippine Census Information
- Local Governance Performance Management System
Places adjacent to Aguinaldo, Ifugao | ||||||||||||||||
|---|---|---|---|---|---|---|---|---|---|---|---|---|---|---|---|---|
| ||||||||||||||||
Lagawe (capital) | |
| Municipalities | |
| Barangays | |
This article about a location in the Cordillera Administrative Region is a stub. You can help Wikipedia by . |
- Municipalities of Ifugao
- Philippines geography stubs