Hungduan
Hungduan | |
|---|---|
| Municipality of Hungduan | |
 Hapao Rice Terraces in Hungduan | |
 Flag | |
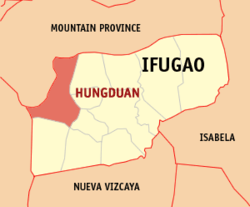 Map of Ifugao with Hungduan highlighted | |
OpenStreetMap  | |
 Hungduan Location within the Philippines | |
| Coordinates: 16°50′N 121°00′E / 16.83°N 121°ECoordinates: 16°50′N 121°00′E / 16.83°N 121°E | |
| Country | Philippines |
| Region | Cordillera Administrative Region |
| Province | Ifugao |
| District | Lone district |
| Barangays | 9 (see Barangays) |
| Government | |
| • Type | Sangguniang Bayan |
| • Mayor | Casan P. Dumulag |
| • Vice Mayor | Lucas A. Bugatti |
| • Representative | Solomon R. Chungalao |
| • Electorate | 6,293 voters (2019) |
| Area | |
| • Total | 260.30 km2 (100.50 sq mi) |
| Elevation | 1,291 m (4,236 ft) |
| Highest elevation | 2,604 m (8,543 ft) |
| Lowest elevation | 651 m (2,136 ft) |
| Population (2020 census) [3] | |
| • Total | 8,866 |
| • Density | 34/km2 (88/sq mi) |
| • Households | 1,939 |
| Economy | |
| • Income class | 4th municipal income class |
| • Poverty incidence | 27.02% (2015)[4] |
| • Revenue | ₱104,653,278.06 (2020) |
| • Assets | ₱257,195,253.38 (2020) |
| • Expenditure | ₱93,954,144.92 (2020) |
| • Liabilities | ₱43,812,809.97 (2020) |
| Service provider | |
| • Electricity | Ifugao Electric Cooperative (IFELCO) |
| Time zone | UTC+8 (PST) |
| ZIP code | 3603 |
| PSGC | |
| IDD : area code | +63 (0)74 |
| Native languages | Ifugao Kallahan Tuwali Ilocano Tagalog |

Hungduan, officially the Municipality of Hungduan is a 4th class municipality in the province of Ifugao, Philippines. According to the 2020 census, it has a population of 8,866 people. [3]
It is bounded on the north-east by the town of Banaue in the east by Hingyon and on the southeast by the town of Kiangan. It borders in the south with the town of Tinoc, Ifugao. On its westside, the town is bordered by the towns of Sabangan and Bauko, Mountain Province.
Barangays[]
Hungduan is politically subdivided into 9 barangays. [5]
- Abatan
- Bangbang
- Maggok
- Poblacion
- Bokiawan
- Hapao
- Lubo-ong
- Nungulunan
- Ba-ang
Climate[]
| Climate data for Hungduan, Ifugao | |||||||||||||
|---|---|---|---|---|---|---|---|---|---|---|---|---|---|
| Month | Jan | Feb | Mar | Apr | May | Jun | Jul | Aug | Sep | Oct | Nov | Dec | Year |
| Average high °C (°F) | 21 (70) |
22 (72) |
24 (75) |
25 (77) |
25 (77) |
25 (77) |
24 (75) |
24 (75) |
24 (75) |
24 (75) |
23 (73) |
21 (70) |
24 (74) |
| Average low °C (°F) | 14 (57) |
15 (59) |
16 (61) |
18 (64) |
19 (66) |
19 (66) |
19 (66) |
19 (66) |
19 (66) |
17 (63) |
16 (61) |
15 (59) |
17 (63) |
| Average precipitation mm (inches) | 35 (1.4) |
46 (1.8) |
63 (2.5) |
117 (4.6) |
402 (15.8) |
400 (15.7) |
441 (17.4) |
471 (18.5) |
440 (17.3) |
258 (10.2) |
94 (3.7) |
68 (2.7) |
2,835 (111.6) |
| Average rainy days | 9.9 | 11.1 | 13.9 | 18.9 | 26.0 | 27.3 | 28.9 | 28.5 | 26.1 | 19.7 | 14.5 | 12.8 | 237.6 |
| Source: Meteoblue [6] | |||||||||||||
Demographics[]
| Year | Pop. | ±% p.a. |
|---|---|---|
| 1939 | 12,937 | — |
| 1948 | 3,540 | −13.41% |
| 1960 | 7,603 | +6.58% |
| 1970 | 8,958 | +1.65% |
| 1975 | 12,301 | +6.57% |
| 1980 | 9,857 | −4.33% |
| 1990 | 7,254 | −3.02% |
| 1995 | 9,491 | +5.17% |
| 2000 | 9,380 | −0.25% |
| 2007 | 9,601 | +0.32% |
| 2010 | 9,933 | +1.24% |
| 2015 | 9,400 | −1.04% |
| 2020 | 8,866 | −1.14% |
| Source: Philippine Statistics Authority [7] [8] [9][10] | ||
In the 2020 census, the population of Hungduan was 8,866 people, [3] with a density of 34 inhabitants per square kilometre or 88 inhabitants per square mile.
Economy[]
| Poverty Incidence of Hungduan | |
| Source: Philippine Statistics Authority[11][12][13][14][15][16][17] | |
References[]
- ^ Municipality of Hungduan | (DILG)
- ^ "2015 Census of Population, Report No. 3 – Population, Land Area, and Population Density" (PDF). Philippine Statistics Authority. Quezon City, Philippines. August 2016. ISSN 0117-1453. Archived (PDF) from the original on May 25, 2021. Retrieved July 16, 2021.
- ^ a b c Census of Population (2020). "Cordillera Administrative Region (CAR)". Total Population by Province, City, Municipality and Barangay. PSA. Retrieved 8 July 2021.
- ^ https://psa.gov.ph/sites/default/files/City%20and%20Municipal-level%20Small%20Area%20Poverty%20Estimates_%202009%2C%202012%20and%202015_0.xlsx; publication date: 10 July 2019; publisher: Philippine Statistics Authority.
- ^ "Province: Ifugao". PSGC Interactive. Quezon City, Philippines: Philippine Statistics Authority. Retrieved 12 November 2016.
- ^ "Hungduan: Average Temperatures and Rainfall". Meteoblue. Retrieved 8 March 2020.
- ^ Census of Population (2015). "Cordillera Administrative Region (CAR)". Total Population by Province, City, Municipality and Barangay. PSA. Retrieved 20 June 2016.
- ^ Census of Population and Housing (2010). "Cordillera Administrative Region (CAR)". Total Population by Province, City, Municipality and Barangay. NSO. Retrieved 29 June 2016.
- ^
Censuses of Population (1903–2007). "Cordillera Administrative Region (CAR)". Table 1. Population Enumerated in Various Censuses by Province/Highly Urbanized City: 1903 to 2007. NSO.
{{cite encyclopedia}}: CS1 maint: url-status (link) - ^ "Province of Ifugao". Municipality Population Data. Local Water Utilities Administration Research Division. Retrieved 17 December 2016.
- ^ "Poverty incidence (PI):". Philippine Statistics Authority. Retrieved 28 December 2020.
- ^ https://psa.gov.ph/sites/default/files/NSCB_LocalPovertyPhilippines_0.pdf; publication date: 29 November 2005; publisher: Philippine Statistics Authority.
- ^ https://psa.gov.ph/sites/default/files/2003%20SAE%20of%20poverty%20%28Full%20Report%29_1.pdf; publication date: 23 March 2009; publisher: Philippine Statistics Authority.
- ^ https://psa.gov.ph/sites/default/files/2006%20and%202009%20City%20and%20Municipal%20Level%20Poverty%20Estimates_0_1.pdf; publication date: 3 August 2012; publisher: Philippine Statistics Authority.
- ^ https://psa.gov.ph/sites/default/files/2012%20Municipal%20and%20City%20Level%20Poverty%20Estima7tes%20Publication%20%281%29.pdf; publication date: 31 May 2016; publisher: Philippine Statistics Authority.
- ^ https://psa.gov.ph/sites/default/files/City%20and%20Municipal-level%20Small%20Area%20Poverty%20Estimates_%202009%2C%202012%20and%202015_0.xlsx; publication date: 10 July 2019; publisher: Philippine Statistics Authority.
- ^ "PSA Releases the 2018 Municipal and City Level Poverty Estimates". Philippine Statistics Authority. 15 December 2021. Retrieved 22 January 2022.
External links[]
- Hungduan Profile at PhilAtlas.com
- Philippine Standard Geographic Code
- Philippine Census Information
- Local Governance Performance Management System
Places adjacent to Hungduan | ||||||||||||||||
|---|---|---|---|---|---|---|---|---|---|---|---|---|---|---|---|---|
| ||||||||||||||||
Lagawe (capital) | |
| Municipalities | |
| Barangays | |
This article about a location in the Cordillera Administrative Region is a stub. You can help Wikipedia by . |
- Municipalities of Ifugao
- Philippines geography stubs