Beaumont–Port Arthur metropolitan area
Golden Triangle | |
|---|---|
| Beaumont–Port Arthur, TX Metropolitan Statistical Area | |
 | |
| Country | United States |
| State(s) | Texas |
| Largest city | Beaumont |
| Other cities | – Port Arthur – Orange |
| Area | |
| • Total | 2,388 sq mi (6,180 km2) |
| Highest elevation | N/A ft (N/A m) |
| Lowest elevation | 0 ft (0 m) |
| Population (2010 including Newton County) | |
| • Total | 403,190 |
| • Rank | 133rd in the U.S. |
| • Density | 162.79/sq mi (62.85/km2) |
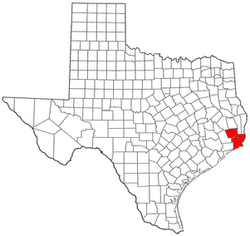
The Beaumont–Port Arthur metropolitan statistical area is defined by the United States Census Bureau as a three-county region in Southeast Texas. The metropolitan area shares borders with the Houston–The Woodlands–Sugar Land metropolitan area to the west and the Lake Charles metropolitan area to the east. The area is also known as the Golden Triangle. The "golden" refers to the wealth that came from the Spindletop oil strike near Beaumont in 1901, and "triangle" refers to the area among the cities of Beaumont, Port Arthur, and Orange. According to the 2000 Census, it has a population of 385,090 (though the 2010 census placed the population at 388,745).[1] Newton County was added to the MSA in the February, 2013 delineation (OMB Bulletin 13-01).[2] The addition of Newton County increases the 2010 population by 14,445.[3]
Counties[]
Communities[]
Places with more than 100,000 inhabitants[]
- Beaumont (principal city)
Places with more than 50,000 inhabitants[]
- Port Arthur (principal city)
Places with 10,000 to 50,000 inhabitants[]
Places with fewer than 10,000 inhabitants[]
- Bevil Oaks
- Bridge City
- Central Gardens (census-designated place)
- China
- Kountze
- Mauriceville (census-designated place)
- Nome
- Pine Forest
- Pinehurst
- Pinewood Estates (census-designated place)
- Rose City
- Rose Hill Acres
- Silsbee
- Sour Lake
- Taylor Landing
- West Orange
Unincorporated places[]
- Batson
- Fannett
- Forest Heights
- Hamshire
- Honey Island
- LaBelle
- Little Cypress
- Orangefield
- Saratoga
- Thicket
- Village Mills
- Votaw
- Wildwood
Demographics[]
As of the census[4] of 2000, there were 385,090 people, 142,327 households, 101,240 families, and 156,697 housing units within the MSA. The racial makeup of the MSA was 68.22% White, 24.80% African American, 2.09% Native American, 1.56% Asian, 0.03% Pacific Islander, 3.13% from other races, and 1.35% from two or more races. Hispanic or Latino of any race were 8.01% of the population.
The median income for a household in the MSA was $36,635, and the median income for a family was $43,111. Males had a median income of $37,595 versus $22,869 for females. The per capita income for the MSA was $17,696.
See also[]
- List of Texas metropolitan areas
- United States metropolitan area
- List of United States metropolitan statistical areas by population
References[]
- ^ "Table 1. Annual Estimates of the Population of Metropolitan and Micropolitan Statistical Areas: April 1, 2000 to July 1, 2009 (CBSA-EST2009-01)". 2009 Population Estimates. United States Census Bureau, Population Division. March 23, 2010. Archived from the original (CSV) on June 15, 2010. Retrieved 2010-03-24.
- ^ "Revised Delineations of Metropolitan Statistical Areas, Micropolitan Statistical Areas, and Combined Statistical Areas, and Guidance on Uses of the Delineations of These Areas" (PDF). Office of Management and Budget. Retrieved October 2, 2014 – via National Archives.
- ^ "State & County QuickFacts". United States Census Bureau. Archived from the original on July 15, 2011. Retrieved October 2, 2014.
- ^ "U.S. Census website". United States Census Bureau. Retrieved 2008-01-31.

- Beaumont–Port Arthur metropolitan area
- Metropolitan areas of Texas