Broxbourne (UK Parliament constituency)
| Broxbourne | |
|---|---|
| Borough constituency for the House of Commons | |
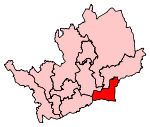 Boundary of Broxbourne in Hertfordshire | |
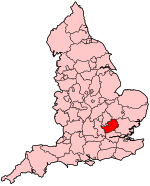 Location of Hertfordshire within England | |
| County | Hertfordshire |
| Population | 98,790 (2011 census)[1] |
| Electorate | 71,872 (December 2010)[2] |
| Major settlements | Broxbourne Cheshunt |
| Current constituency | |
| Created | 1983 |
| Member of Parliament | Charles Walker (Conservative) |
| Number of members | one |
| Created from | East Hertfordshire Welwyn Hatfield Hertford and Stevenage[3] |
Broxbourne is a constituency in Hertfordshire represented in the House of Commons of the UK Parliament since 2005 by Charles Walker of the Conservative Party.[n 1]
Constituency profile[]
Broxbourne is, measured by the winning candidate's share of the vote, the safest seat of any held by the Conservative Party in Hertfordshire, and one of the safest in the country.
Just beyond the outer limits of Greater London,[4] the constituency consists almost exclusively of low-unemployment census output areas,[5] with walks, golf courses and leisure facilities, and (compared to Greater London) a relatively high proportion of the retired and the high-income self-employed.[6] Broxbourne's economy is also supported by good railway links to the City of London.[7]
Boundaries and boundary changes[]

1983–1997: The Borough of Broxbourne, the District of East Hertfordshire wards of Great Amwell, Little Amwell, and Stanstead, and the District of Welwyn Hatfield ward of Northaw.[8]
Formed as a Borough Constituency primarily from parts of the abolished County Constituency of East Hertfordshire, mainly consisting of the former Urban Districts of Cheshunt and Hoddesdon which had been combined to form the District of Broxbourne under the local government reorganisation of 1974 and also including Stanstead Abbotts and Great Amwell to the north and Northaw (transferred from Welwyn Hatfield) to the west.
1997–present: The Borough of Broxbourne, and the District of Welwyn Hatfield ward of Northaw.[9][10]
The three District of East Hertfordshire wards were transferred to Hertford and Stortford.
Members of Parliament[]
| Election | Member[11][12] | Party | |
|---|---|---|---|
| 1983 | Dame Marion Roe | Conservative | |
| 2005 | Sir Charles Walker | Conservative | |
Elections[]
Elections in the 2010s[]
| Party | Candidate | Votes | % | ±% | |
|---|---|---|---|---|---|
| Conservative | Charles Walker | 30,631 | 65.6 | +3.4 | |
| Labour | Sean Waters | 10,824 | 23.2 | –5.7 | |
| Liberal Democrats | Julia Bird | 3,970 | 8.5 | +5.4 | |
| Green | Nicholas Cox | 1,281 | 2.7 | +0.9 | |
| Majority | 19,807 | 42.4 | +9.1 | ||
| Turnout | 46,706 | 63.8 | –2.5 | ||
| Conservative hold | Swing | +4.6 | |||
| Party | Candidate | Votes | % | ±% | |
|---|---|---|---|---|---|
| Conservative | Charles Walker | 29,515 | 62.2 | +6.1 | |
| Labour | Selina Norgrove | 13,723 | 28.9 | +10.5 | |
| UKIP | Tony Faulkner | 1,918 | 4.0 | –15.7 | |
| Liberal Democrats | Andy Graham | 1,481 | 3.1 | –0.1 | |
| Green | Tabitha Evans | 848 | 1.8 | –0.8 | |
| Majority | 15,792 | 33.3 | –3.1 | ||
| Turnout | 47,485 | 66.3 | +3.2 | ||
| Conservative hold | Swing | –2.2 | |||
| Party | Candidate | Votes | % | ±% | |
|---|---|---|---|---|---|
| Conservative | Charles Walker | 25,797 | 56.1 | –2.7 | |
| UKIP | David Platt | 9,074 | 19.7 | +15.6 | |
| Labour | Edward Robinson | 8,470 | 18.4 | +0.8 | |
| Liberal Democrats | Anthony Rowlands | 1,467 | 3.2 | –10.2 | |
| Green | Russell Secker | 1,216 | 2.6 | New | |
| Majority | 16,723 | 36.4 | –4.8 | ||
| Turnout | 46,024 | 63.1 | –0.9 | ||
| Conservative hold | Swing | –9.2 | |||
| Party | Candidate | Votes | % | ±% | |
|---|---|---|---|---|---|
| Conservative | Charles Walker | 26,844 | 58.8 | +5.0 | |
| Labour | Michael Watson | 8,040 | 17.6 | –7.9 | |
| Liberal Democrats | Allan Witherick | 6,107 | 13.4 | +1.2 | |
| BNP | Steve McCole | 2,159 | 4.7 | 0.0 | |
| UKIP | Martin J. Harvey | 1,890 | 4.1 | +0.5 | |
| English Democrat | Debbie Lemay | 618 | 1.4 | +1.4 | |
| Majority | 18,804 | 41.2 | +12.9 | ||
| Turnout | 45,658 | 64.0 | +4.3 | ||
| Conservative hold | Swing | +4.7 | |||
Elections in the 2000s[]
| Party | Candidate | Votes | % | ±% | |
|---|---|---|---|---|---|
| Conservative | Charles Walker | 21,878 | 53.8 | –0.3 | |
| Labour | Jamie Bolden | 10,369 | 25.5 | –4.9 | |
| Liberal Democrats | Andrew Porrer | 4,973 | 12.2 | +1.2 | |
| BNP | Andrew Emerson | 1,929 | 4.7 | +2.5 | |
| UKIP | Martin J. Harvey | 1,479 | 3.6 | +1.3 | |
| Majority | 11,509 | 28.3 | +4.6 | ||
| Turnout | 40,628 | 59.7 | +4.0 | ||
| Conservative hold | Swing | +2.3 | |||
| Party | Candidate | Votes | % | ±% | |
|---|---|---|---|---|---|
| Conservative | Marion Roe | 20,487 | 54.1 | +5.3 | |
| Labour | David Prendergast | 11,494 | 30.4 | –4.3 | |
| Liberal Democrats | Julia Davies | 4,158 | 11.0 | –0.3 | |
| UKIP | Martin Harvey | 858 | 2.3 | New | |
| BNP | John Cope | 848 | 2.2 | +0.9 | |
| Majority | 8,993 | 23.7 | +9.6 | ||
| Turnout | 37,845 | 55.7 | –14.6 | ||
| Conservative hold | Swing | +4.8 | |||
Elections in the 1990s[]
| Party | Candidate | Votes | % | ±% | |
|---|---|---|---|---|---|
| Conservative | Marion Roe | 22,952 | 48.8 | –13.4 | |
| Labour | Benjamin Coleman | 16,299 | 34.7 | +13.3 | |
| Liberal Democrats | Julia Davies | 5,310 | 11.3 | –4.7 | |
| Referendum | David Millward | 1,633 | 3.5 | New | |
| BNP | David Bruce | 610 | 1.3 | New | |
| National Liberal Party | Benjamin Cheetham | 172 | 0.4 | New | |
| Majority | 6,653 | 14.1 | –27.5 | ||
| Turnout | 46,976 | 70.3 | –9.6 | ||
| Conservative hold | Swing | –13.7 | |||
| Party | Candidate | Votes | % | ±% | |
|---|---|---|---|---|---|
| Conservative | Marion Roe | 36,094 | 62.6 | –0.6 | |
| Labour | Martin Hudson | 12,124 | 21.0 | +4.1 | |
| Liberal Democrats | Julia Davies | 9,244 | 16.0 | –3.9 | |
| Natural Law | George Woolhouse | 198 | 0.3 | New | |
| Majority | 23,970 | 41.6 | –1.7 | ||
| Turnout | 57,660 | 79.9 | +4.7 | ||
| Conservative hold | Swing | –2.4 | |||
Elections in the 1980s[]
| Party | Candidate | Votes | % | ±% | |
|---|---|---|---|---|---|
| Conservative | Marion Roe | 33,567 | 63.2 | +4.4 | |
| Liberal | Eunice Yates | 10,572 | 19.9 | –3.9 | |
| Labour | Philip Parry | 8,984 | 16.9 | +0.5 | |
| Majority | 22,995 | 43.3 | +8.3 | ||
| Turnout | 53,123 | 75.2 | +1.2 | ||
| Conservative hold | Swing | +4.1 | |||
| Party | Candidate | Votes | % | ±% | |
|---|---|---|---|---|---|
| Conservative | Marion Roe | 29,328 | 58.8 | ||
| Liberal | Brian Pollock | 11,862 | 23.8 | ||
| Labour | Martin Stears | 8,159 | 16.4 | ||
| BNP | John Smith | 502 | 1.0 | ||
| Majority | 17,466 | 35.0 | |||
| Turnout | 49,851 | 74.0 | |||
| Conservative win (new seat) | |||||
See also[]
Notes[]
- ^ As with all constituencies, the constituency elects one Member of Parliament (MP) by the first past the post system of election at least every five years.
References[]
- ^ "Broxbourne: Usual Resident Population, 2011". Neighbourhood Statistics. Office for National Statistics. Retrieved 4 February 2015.
- ^ "Electorate Figures - Boundary Commission for England". 2011 Electorate Figures. Boundary Commission for England. 4 March 2011. Archived from the original on 6 November 2010. Retrieved 13 March 2011.
- ^ "'Broxbourne', June 1983 up to May 1997". ElectionWeb Project. Cognitive Computing Limited. Archived from the original on 11 March 2016. Retrieved 10 March 2016.
- ^ "Politics". The Guardian.
- ^ "OpenStreetMap". OpenStreetMap.
- ^ "Local statistics". Office for National Statistics.
- ^ "National Rail Enquiries - Official source for UK train times and timetables". www.nationalrail.co.uk.
- ^ "The Parliamentary Constituencies (England) Order 1983". www.legislation.gov.uk. Retrieved 25 February 2019.
- ^ "The Parliamentary Constituencies (England) Order 1995". www.legislation.gov.uk. Retrieved 25 February 2019.
- ^ "The Parliamentary Constituencies (England) Order 2007". www.legislation.gov.uk. Retrieved 25 February 2019.
- ^ "Broxbourne 1983-". Hansard 1803-2005. UK Parliament. Retrieved 2 February 2015.
- ^ Leigh Rayment's Historical List of MPs – Constituencies beginning with "B" (part 6)
- ^ "STATEMENT OF PERSONS NOMINATED AND NOTICE OF POLL" (PDF). ex.broxbourne.gov.uk. Retrieved 24 August 2021.
- ^ "UK Parliamentary Election: Broxbourne Constituency: Statement of persons nominated and notice of poll" (PDF). Broxbourne Borough Council. 11 May 2017. Retrieved 5 June 2017.
- ^ "Election Data 2015". Electoral Calculus. Archived from the original on 17 October 2015. Retrieved 17 October 2015.
- ^ "Election Data 2010". Electoral Calculus. Archived from the original on 26 July 2013. Retrieved 17 October 2015.
- ^ "Election 2010 – Broxbourne". BBC News.
- ^ "Election Data 2005". Electoral Calculus. Archived from the original on 15 October 2011. Retrieved 18 October 2015.
- ^ "Election Data 2001". Electoral Calculus. Archived from the original on 15 October 2011. Retrieved 18 October 2015.
- ^ "Election Data 1997". Electoral Calculus. Archived from the original on 15 October 2011. Retrieved 18 October 2015.
- ^ "Election Data 1992". Electoral Calculus. Archived from the original on 15 October 2011. Retrieved 18 October 2015.
- ^ "UK General Election results April 1992". Richard Kimber's Political Science Resources. Politics Resources. 9 April 1992. Archived from the original on 11 August 2011. Retrieved 6 December 2010.
- ^ "Election Data 1987". Electoral Calculus. Archived from the original on 15 October 2011. Retrieved 18 October 2015.
- ^ "Election Data 1983". Electoral Calculus. Archived from the original on 15 October 2011. Retrieved 18 October 2015.
External links[]
- nomis Constituency Profile for Broxbourne — presenting data from the ONS annual population survey and other official statistics.
Coordinates: 51°43′40″N 0°04′00″W / 51.72778°N 0.06667°W

| Authority control |
|---|
- Parliamentary constituencies in Hertfordshire
- Constituencies of the Parliament of the United Kingdom established in 1983
- Politics of the Borough of Broxbourne
- Politics of Welwyn Hatfield