1987 United Kingdom general election
| |||||||||||||||||||||||||||||||||||||||||||||
All 650 seats in the House of Commons 326 seats needed for a majority | |||||||||||||||||||||||||||||||||||||||||||||
|---|---|---|---|---|---|---|---|---|---|---|---|---|---|---|---|---|---|---|---|---|---|---|---|---|---|---|---|---|---|---|---|---|---|---|---|---|---|---|---|---|---|---|---|---|---|
| Opinion polls | |||||||||||||||||||||||||||||||||||||||||||||
| Turnout | 75.3%, | ||||||||||||||||||||||||||||||||||||||||||||
| |||||||||||||||||||||||||||||||||||||||||||||
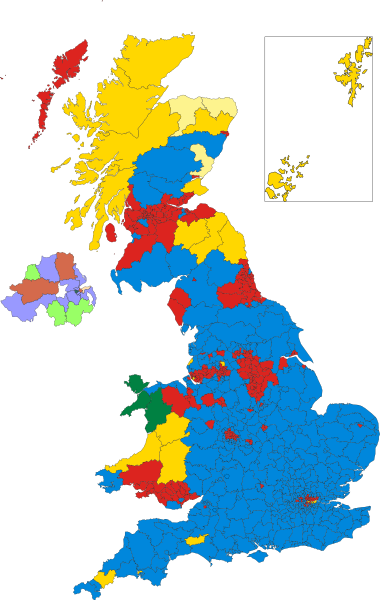 Colours denote the winning party—as shown in § Results | |||||||||||||||||||||||||||||||||||||||||||||
 Composition of the House of Commons after the election | |||||||||||||||||||||||||||||||||||||||||||||
| |||||||||||||||||||||||||||||||||||||||||||||


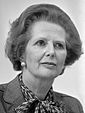
The 1987 United Kingdom general election was held on Thursday, 11 June 1987, to elect 650 members to the House of Commons of the United Kingdom. The election was the third consecutive general election victory for the Conservative Party, and second landslide under the leadership of Margaret Thatcher, who became the first Prime Minister since the Earl of Liverpool in 1820 to lead a party into three successive electoral victories.
The Conservatives ran a campaign focusing on lower taxes, a strong economy and strong defence. They also emphasised that unemployment had just fallen below the 3 million mark for the first time since 1981, and inflation was standing at 4%, its lowest level since the 1960s. National newspapers also continued to largely back the Conservative Party, particularly The Sun, which ran anti-Labour articles with headlines such as "Why I'm backing Kinnock, by Stalin".[1]
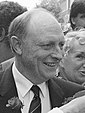
The Labour Party, led by Neil Kinnock following Michael Foot's resignation in the aftermath of the 1983 election, was slowly moving towards a more centrist policy platform following the lurch to the left under its previous leader Michael Foot. The main aim of the Labour Party was simply to re-establish itself as the main progressive centre-left alternative to the Conservatives, after the rise of the Social Democratic Party (SDP) forced Labour onto the defensive. Indeed, the Labour Party succeeded in doing so at this general election. The Alliance between the SDP and the Liberal Party was renewed but co-leaders David Owen and David Steel could not agree whether to support either major party in the event of a hung parliament.
The Conservatives were returned to government, having suffered a net loss of only 21 seats, leaving them with 376 MPs and a reduced but still strong majority of 102 seats. Labour succeeded in resisting the challenge by the SDP–Liberal Alliance to maintain its position as the opposition. Moreover, Labour managed to increase its vote share in Scotland, Wales and the North of England. Yet Labour still returned only 229 MPs to Westminster, and in certain London constituencies which Labour had held before the election, the Conservatives actually made gains.
The election was a disappointment for the Alliance, which saw its vote share fall and suffered a net loss of one seat as well as former SDP leader Roy Jenkins losing his seat. This led to the two parties merging completely soon afterwards to become the Liberal Democrats. In Northern Ireland, the main unionist parties maintained their alliance in opposition to the Anglo-Irish Agreement, however the Ulster Unionists lost two seats to the Social Democratic and Labour Party.
The 1987 election was the last in which the Conservatives won the popular vote in a general election by more than 10 points until the 2019 election, and the last time they would hold more than 336 seats in the House of Commons until the 58th Parliament following the 2019 election.
The 50th Parliament is the last time a Conservative government has lasted a full term with an overall majority of seats in Parliament, as it had to form a coalition with the Liberal Democrats to form a government in 2010, and its narrow majority won at the 2015 election was wiped out when a snap election was called two years later and resulted in a hung parliament.
The election night was covered live on the BBC and presented by David Dimbleby, Peter Snow and Sir Robin Day.[2] It was also broadcast on ITV and presented by Sir Alastair Burnet, Peter Sissons and Alastair Stewart.
The 1987 general election saw the election of the first Black members of Parliament: Diane Abbott, Paul Boateng and Bernie Grant, all for the Labour Party. MPs leaving the House of Commons as a result of this election included former Labour Prime Minister James Callaghan, Keith Joseph, Jim Prior, Ian Mikardo, former SDP leader and Labour cabinet minister Roy Jenkins, former Health Minister Enoch Powell (who had switched to the UUP in Northern Ireland in 1974 after defecting from the Conservatives) and Clement Freud.
|
|
|
Campaign and policies[]
The Conservative campaign emphasised lower taxes, a strong economy and defence, and also employed rapid-response reactions to take advantage of Labour errors. Norman Tebbit and Saatchi and Saatchi spearheaded the Conservative campaign. However, when on "Wobbly Thursday" it was rumoured a Marplan opinion poll showed a narrow 2% Conservative lead, the "exiles" camp of David Young, Tim Bell and the Young & Rubicam firm advocated a more aggressively anti-Labour message. This was when, according to Young's memoirs, Young got Tebbit by the lapels and shook him, shouting: "Norman, listen to me, we're about to lose this fucking election."[3][4] In his memoirs Tebbit defends the Conservative campaign: "We finished exactly as planned on the ground where Labour was weak and we were strong—defence, taxation, and the economy."[5] During the election campaign however Tebbit and Thatcher argued.[6]
Bell and Saatchi and Saatchi produced memorable posters for the Conservatives, such as a picture of a British soldier's arms raised in surrender with the caption "Labour's Policy On Arms"—a reference to Labour's policy of unilateral nuclear disarmament. The first Conservative party political broadcast played on the theme of "Freedom" and ended with a fluttering Union Jack, the hymn I Vow to Thee, My Country (which Thatcher would later quote in her "Sermon on the Mound") and the slogan "It's Great To Be Great Again".
The Labour campaign was a marked change from previous efforts; professionally directed by Peter Mandelson and Bryan Gould, it concentrated on presenting and improving Neil Kinnock's image to the electorate. Labour's first party political broadcast, dubbed Kinnock: The Movie, was directed by Hugh Hudson of Chariots of Fire fame, and concentrated on portraying Kinnock as a caring, compassionate family man. It was filmed at the Great Orme in Wales and had "Ode to Joy" as its music.[7] He was particularly critical of the high unemployment that the government's economic policies had resulted in, as well as condemning the wait for treatment that many patients had endured on the National Health Service. Kinnock's personal popularity jumped 16 points overnight following the initial broadcast.[8]
On 24 May, Kinnock was interviewed by David Frost and claimed that Labour's alternative defence strategy in the event of a Soviet attack would be "using the resources you've got to make any occupation totally untenable".[citation needed] In a speech two days later Thatcher attacked Labour's defence policy as a programme for "defeat, surrender, occupation, and finally, prolonged guerrilla fighting ... I do not understand how anyone who aspires to Government can treat the defence of our country so lightly".[9]
Endorsements[]
The following newspapers endorsed political parties running in the election in the following ways:[10]
| Newspaper | Party/ies endorsed | |
|---|---|---|
| The Sun | Conservative Party | |
| Daily Mirror | Labour Party | |
| Daily Mail | Conservative Party | |
| Daily Express | Conservative Party | |
| Daily Telegraph | Conservative Party | |
| The Guardian | Labour Party | |
| The Independent | None | |
| The Times | Conservative Party | |
Opinion polling[]
| Opinion polling for UK general elections |
|---|
| 1979 election |
| Opinion polls |
| 1983 election |
| Opinion polls |
| 1987 election |
| Opinion polls |
| 1992 election |
| Opinion polls |
| 1997 election |
| Opinion polls |

Results[]
The Conservatives were returned by a third landslide victory with a comfortable majority, down slightly on 1983 with a swing of 1.5% towards Labour. This marked the first time since the passing of the Great Reform Act in 1832 that a party leader had won three consecutive elections, although the Conservative party had won three consecutive contests in the 1950s under different leaders. The Conservative lead over Labour of 11.4% was the second greatest for any governing party since the Second World War, only being bettered by the 1983 result.[11]
The BBC announced the result at 02:35. Increasing polarisation marked divisions across the country; the Conservatives dominated Southern England and took additional seats from Labour in London and the rest of the South, but performed less well in Northern England, Scotland and Wales, losing many of the seats they had won there in previous elections. Yet the overall result of this election proved that the policies of Margaret Thatcher retained significant support, with the Conservatives given a third convincing majority.
Despite initial optimism and the professional campaign run by Neil Kinnock, the election brought only twenty additional seats for Labour from the 1983 Conservative landslide. In many southern areas, the Labour vote actually fell, with the party losing seats in London. However, it represented a decisive victory against the SDP–Liberal Alliance and marked out the Labour Party as the main opposition to the Conservative Party. This was in stark contrast to 1983, when the Alliance almost matched Labour in terms of votes—although Labour had almost 10 times as many seats as the Alliance.
The result for the Alliance was a disappointment, in that they had hoped to overtake Labour as the second party in the UK in terms of vote share. Instead, they lost one net seat and saw their vote share drop by almost 3%, with a widening gap of 8% between them and the Labour Party (compared to a 2% gap four years before). These results would eventually lead to the end of the Alliance and the birth of the Liberal Democrats.
Most of the prominent MPs retained their seats. Notable failures included Enoch Powell (the controversial former Conservative MP who had defected to the Ulster Unionist Party) and two Alliance members: Liberal Clement Freud and former SDP leader Roy Jenkins (a former Labour Home Secretary and Chancellor of the Exchequer). Neil Kinnock increased his share of the vote in Islwyn by almost 12%. Margaret Thatcher increased her share of the vote in her own seat in Finchley, but the Labour vote increased further, thereby slightly reducing her majority.
In Northern Ireland, the various unionist parties maintained an electoral pact (with few dissenters) in opposition to the Anglo-Irish Agreement. However, the Ulster Unionists lost two seats to the Social Democratic and Labour Party.
The election victory won by the Conservatives could also arguably be attributed to the rise in average living standards that had taken place during their time in office. As noted by Dennis Kavanagh and David Butler in their study on the 1987 election:
Since 1987 the Conservatives had located a large constituency of "winners", people who have an interest in the return of a Conservative government. It includes much of the affluent South, home-owners, share-owners, and most of those in work, whose standard of living, measured in post-tax incomes, has risen appreciably since 1979.[12]
| 376 | 229 | 22 | 23 |
| Conservative | Labour | Alliance | O |

| Candidates | Votes | ||||||||||
|---|---|---|---|---|---|---|---|---|---|---|---|
| Party | Leader | Stood | Elected | Gained | Unseated | Net | % of total | % | No. | Net % | |
| Conservative | Margaret Thatcher | 633 | 376 | 9 | 30 | −21 | 57.85 | 42.2 | 13,760,583 | −0.2 | |
| Labour | Neil Kinnock | 633 | 229 | 26 | 6 | +20 | 35.23 | 30.8 | 10,029,807 | +3.2 | |
| Alliance | David Owen & David Steel | 633 | 22 | 5 | 6 | −1 | 3.38 | 22.6 | 7,341,633 | −2.8 | |
| SNP | Gordon Wilson | 72 | 3 | 3 | 2 | +1 | 0.46 | 1.3 | 416,473 | +0.2 | |
| UUP | James Molyneaux | 12 | 9 | 0 | 2 | −2 | 1.38 | 0.8 | 276,230 | 0.0 | |
| SDLP | John Hume | 13 | 3 | 2 | 0 | +2 | 0.46 | 0.5 | 154,067 | +0.1 | |
| Plaid Cymru | Dafydd Elis-Thomas | 38 | 3 | 1 | 0 | +1 | 0.46 | 0.4 | 123,599 | 0.0 | |
| Green | N/A | 133 | 0 | 0 | 0 | 0 | 0.3 | 89,753 | +0.1 | ||
| DUP | Ian Paisley | 4 | 3 | 0 | 0 | 0 | 0.46 | 0.3 | 85,642 | −0.2 | |
| Sinn Féin | Gerry Adams | 14 | 1 | 0 | 0 | 0 | 0.15 | 0.3 | 83,389 | 0.0 | |
| Alliance | John Alderdice | 16 | 0 | 0 | 0 | 0 | 0.2 | 72,671 | 0.0 | ||
| Workers' Party | Tomás Mac Giolla | 14 | 0 | 0 | 0 | 0 | 0.1 | 19,294 | +0.1 | ||
| UPUP | James Kilfedder | 1 | 1 | 0 | 0 | 0 | 0.15 | 0.1 | 18,420 | 0.0 | |
| Real Unionist | Robert McCartney | 1 | 0 | 0 | 0 | 0 | 0.1 | 14,467 | N/A | ||
| Communist | Gordon McLennan | 19 | 0 | 0 | 0 | 0 | 0.0 | 6,078 | 0.0 | ||
| Protestant Unionist | George Seawright | 1 | 0 | 0 | 0 | 0 | 0.0 | 5,671 | N/A | ||
| Red Front | N/A | 14 | 0 | 0 | 0 | 0 | 0.0 | 3,177 | N/A | ||
| Orkney and Shetland Movement | John Goodlad | 1 | 0 | 0 | 0 | 0 | 0.0 | 3,095 | N/A | ||
| Moderate Labour | Brian Marshall | 2 | 0 | 0 | 0 | 0 | 0.0 | 2,269 | N/A | ||
| Monster Raving Loony | Screaming Lord Sutch | 5 | 0 | 0 | 0 | 0 | 0.0 | 1,951 | 0.0 | ||
| Workers Revolutionary | Sheila Torrance | 10 | 0 | 0 | 0 | 0 | 0.0 | 1,721 | 0.0 | ||
| Independent Liberal | N/A | 1 | 0 | 0 | 0 | 0 | 0.0 | 686 | 0.0 | ||
| BNP | John Tyndall | 2 | 0 | 0 | 0 | 0 | 0.0 | 553 | 0.0 | ||
| Spare the Earth | N/A | 1 | 0 | 0 | 0 | 0 | 0.0 | 522 | N/A | ||
| Government's new majority | 102 |
| Total votes cast | 32,529,578 |
| Turnout | 75.3% |
Votes summary[]

Seats summary[]

Incumbents defeated[]
| Party | Name | Constituency | Office held whilst in power | Year elected | Defeated by | Party | ||
|---|---|---|---|---|---|---|---|---|
| Conservative | Gerry Malone | Aberdeen South | 1983 | Frank Doran | Labour | |||
| The Rt Hon Peter Fraser | East Angus | Solicitor General for Scotland | 1979 | Andrew Welsh | SNP | |||
| John MacKay | Argyll and Bute | Under-Secretary of State for Scotland | 1979 | Ray Mitchie | Liberal | |||
| Sir Albert McQuarrie | Banff and Buchan | 1979 | Alex Salmond | SNP | ||||
| Geoffrey Lawler | Bradford North | 1983 | Pat Wall | Labour | ||||
| Peter Hubbard-Miles | Bridgend | Parliamentary Private Secretary to the Secretary of State for Wales | 1983 | Win Griffiths | ||||
| Stefan Terlezki | Cardiff West | 1983 | Rhodri Morgan | |||||
| Robert Harvey | Clwyd South-West | 1983 | Martyn Jones | |||||
| John Corrie | Cunninghame North | February 1974 | Brian Wilson | |||||
| John Whitfield | Dewsbury | 1983 | Ann Taylor | |||||
| Alexander MacPherson Fletcher | Edinburgh Central | 1973 | Alistair Darling | |||||
| Steven Norris | Oxford East | 1983 | Andrew Smith | |||||
| Barry Henderson | North East Fife | 1979 | Menzies Campbell | Liberal | ||||
| Richard Hickmet | Glanford and Scunthorpe | 1983 | Elliot Morley | Labour | ||||
| Roy Galley | Halifax | 1983 | Alice Mahon | |||||
| Peter Bruinvels | Leicester East | 1983 | Keith Vaz | |||||
| Derek Spencer | Leicester South | 1983 | Jim Marshall | |||||
| Fred Silvester | Manchester Withington | February 1974 | Keith Bradley | |||||
| Alexander Pollock | Moray | Parliamentary Private Secretary to the Secretary of State for Defence | 1979 | Margaret Ewing | SNP | |||
| Piers Merchant | Newcastle upon Tyne Central | 1983 | Jim Cousins | Labour | ||||
| Mark Robinson | Newport West | 1983 | Paul Flynn | |||||
| Richard Ottaway | Nottingham North | 1983 | Graham Allen | |||||
| Anna McCurley | Renfrew West and Inverclyde | 1983 | Tommy Graham | |||||
| Michael Hirst | Strathkelvin and Bearsden | 1983 | Sam Galbraith | |||||
| Warren Hawksley | The Wrekin | 1979 | Bruce Grocott | |||||
| John Powley | Norwich South | 1983 | John Garrett | |||||
| The Rt Hon Michael Ancram, Earl of Ancram | Edinburgh South | 1979 | Nigel Griffiths | |||||
| Labour | Alfred Dubs | Battersea | 1979 | John Bowis | Conservative | |||
| Willie Hamilton | Central Fife (stood in South Hams) | 1950 | Anthony Steen | |||||
| Nick Raynsford | Fulham | 1986 | Matthew Carrington | |||||
| Kenneth Weetch | Ipswich | October 1974 | Michael Irvine | |||||
| Oonagh McDonald | Thurrock | Opposition Spokesman on Treasury and Economic Affairs | 1976 | Tim Janman | ||||
| Eric Deakins | Walthamstow | 1970 | Hugo Summerson | |||||
| Liberal | Sir Clement Freud | North East Cambridgeshire | 1973 | Malcolm Moss | ||||
| Michael Meadowcroft | Leeds West | 1983 | John Battle | Labour | ||||
| Elizabeth Shields | Ryedale | 1986 | John Greenway | Conservative | ||||
| SDP | The Rt Hon Roy Jenkins | Glasgow Hillhead | Former Leader of the Social Democratic Party | 1982 | George Galloway | Labour | ||
| Mike Hancock | Portsmouth South | 1984 | David Martin | Conservative | ||||
| Ian Wrigglesworth | Stockton South | February 1974 | Tim Devlin | |||||
| SNP | Gordon Wilson | Dundee East | Leader of the Scottish National Party | February 1974 | John McAllion | Labour | ||
| UUP | The Rt Hon Brig Enoch Powell | South Down | 1950 | Eddie McGrady | SDLP | |||
See also[]
- List of MPs elected in the 1987 United Kingdom general election
- 1987 United Kingdom general election in England
- 1987 United Kingdom general election in Scotland
- 1987 United Kingdom general election in Wales
- 1987 United Kingdom general election in Northern Ireland
- 1987 United Kingdom local elections
References[]
- ^ James Thomas (7 May 2007). Popular Newspapers, the Labour Party and British Politics. Routledge. p. 103. ISBN 978-1-135-77373-1.
- ^ BBC Election 1987 coverage on YouTube
- ^ Campbell 2003, p. 522.
- ^ Oborne, Peter (19 March 2005). "Has Gordon Brown delivered his last Budget? The truth is that Blair hasn't yet decided". The Spectator. Retrieved 2 July 2018.
- ^ Tebbit 1988, p. 336.
- ^ Thatcher 1993, p. 584.
- ^ "World in Motion", The 80s with Dominic Sandbrook, BBC, retrieved 2 July 2018
- ^ Butler & Kavanagh 1988, p. 154.
- ^ Speech to Conservative Rally in Newport, Margaret Thatcher Foundation, 26 May 1987, retrieved 2 July 2018
- ^ 'Newspaper support in UK general elections' (2010) on The Guardian.
- ^ David Butler; Robert Waller (1987). "Survey of the voting. Election of haves and have-nots". The Times Guide to the House of Commons June 1987. London: Times Books Ltd. p. 253. ISBN 0-7230-0298-3.
- ^ Butler & Kavanagh 1988, p. 277.
Biographies[]
- Campbell, John (2003), Margaret Thatcher: The Iron Lady, 2, Pimlico, ISBN 978-0-7126-6781-4
- Tebbit, Norman (1988), Upwardly Mobile, Weidenfeld & Nicolson, ISBN 978-0-297-79427-1
- Thatcher, Margaret (1993), The Downing Street Years, HarperCollins, ISBN 978-0-00-255354-4
Scholarly sources[]
- Butler, David E.; Kavanagh, Dennis (1988), The British General Election of 1987, the standard scholarly studyCS1 maint: postscript (link)
- Craig, F. W. S. (1989), British Electoral Facts: 1832–1987, Dartmouth: Gower, ISBN 0900178302
- Craig, F. W. S., ed. (1990), British General Election Manifestos, 1959–1987
- Crewe, Ivor; Harrop, Martin (1989), Political Communications: The General Election Campaign of 1987, p. 316
- Galbraith, John W.; Rae, Nicol C. (1989), "A Test of the Importance of Tactical Voting: Great Britain, 1987", British Journal of Political Science, 19 (1): 126–136, doi:10.1017/S0007123400005366, JSTOR 193792
- Scott, Len (2012), "Selling or Selling Out Nuclear Disarmament? Labour, the Bomb, and the 1987 General Election", International History Review, 34 (1): 115–137, doi:10.1080/07075332.2012.620242
- Stewart, Marianne C.; Clarke, Harold D. (1992), "The (un)importance of party leaders: Leader images and party choice in the 1987 British election", Journal of Politics, 54 (2): 447–470, doi:10.2307/2132034, JSTOR 2132034, says the well-organised, media-wise Labour campaign helped Kinnock, but he was hurt by Conservative momentum and Thatcher's image as a decisive leader. Leadership images proved more important in voters' choices than did party identification, economic concerns, etc.CS1 maint: postscript (link)
Manifestos[]
- The Next Moves Forward, 1987 Conservative Party manifesto
- Britain will win with Labour, 1987 Labour Party manifesto
- Britain United: The Time Has Come, 1987 SDP–Liberal Alliance manifesto
| show Margaret Thatcher |
|---|
| show Neil Kinnock |
|---|
- 1987 United Kingdom general election
- General elections to the Parliament of the United Kingdom
- 1987 elections in the United Kingdom
- June 1987 events in the United Kingdom