Central Valley (California)
| Central Valley | |
|---|---|
| Great Central Valley, Great Valley, The Valley, Golden Empire | |
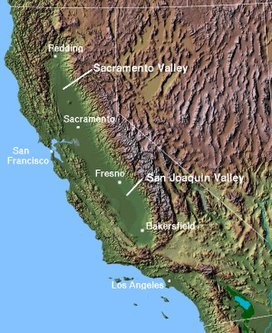 Topography, major regions, and cities of the Central Valley | |
| Length | 450 mi (720 km) |
| Width | 40 to 60 mi (64 to 97 km) |
| Area | 18,000 sq mi (47,000 km2)[1] |
| Depth | 2,000 to 6,000 ft (610 to 1,830 m) |
| Geology | |
| Type | Alluvial |
| Age | 2–3 million years |
| Geography | |
| Location | California, United States |
| Population centers | Redding, Chico, Yuba City, Sacramento, Stockton, Porterville, Tulare, Modesto, Manteca, Turlock, Merced, Fresno, Visalia, Bakersfield, Clovis, Madera |
| Borders on | Sierra Nevada (east), Cascade Range, Klamath Mountains (north), Coast Range, San Francisco Bay (west), Tehachapi Mountains (south) |
| Coordinates | 37°00′N 120°18′W / 37°N 120.3°WCoordinates: 37°00′N 120°18′W / 37°N 120.3°W[2] |
| Traversed by | Interstate 5, Interstate 80, State Route 99 |
| Rivers | Sacramento River, San Joaquin River, Kings River |

The Central Valley is a broad, elongated, flat valley that dominates the interior of California. It is 40–60 mi (60–100 km) wide and runs approximately 450 mi (720 km) from north-northwest to south-southeast, inland from and parallel to the Pacific coast of the state. It covers approximately 18,000 sq mi (47,000 km2),[1] about 11% of California's land area. The valley is bounded by the Coast Ranges to the west and the Sierra Nevada to the east.
It is California's most productive agricultural region and one of the most productive in the world, providing more than half of the fruits, vegetables, and nuts grown in the United States.[3] More than 7,000,000 acres (28,000 km2) of the valley are irrigated via reservoirs and canals.[4] The valley hosts many cities, including the state capital Sacramento; as well as Redding, Chico, Stockton, Modesto, Fresno, Visalia, and Bakersfield.
The Central Valley watershed comprises 60,000 square miles (160,000 km2), or over a third of California. It consists of three main drainage systems: the Sacramento Valley in the north, which receives over 20 inches (510 mm) of rain annually; the drier San Joaquin Valley in the south; and the Tulare Basin and its semi-arid desert climate at the southernmost end. The Sacramento and San Joaquin river systems drain their respective valleys and meet to form the Sacramento–San Joaquin River Delta, a large expanse of interconnected canals, stream beds, sloughs, marshes and peat islands. The delta empties into the San Francisco Bay, and ultimately into the Pacific.[5] The waters of the Tulare Basin essentially never reach the ocean (with the exception of Kings River waters diverted northward for irrigation), though they are connected by man-made canals to the San Joaquin.
The valley encompasses all or parts of 19 California counties: Butte, Colusa, Glenn, Fresno, Kern, Kings, Madera, Merced, Placer, San Joaquin, Sacramento, Shasta, Solano, Stanislaus, Sutter, Tehama, Tulare, Yolo and Yuba.[6]
Name[]
Older names include "the Great Valley", a name still often seen in scientific references (notably Great Valley Sequence), as well as "Golden Empire", a booster name that is still referred to by some organizations (notably Golden Empire Transit, Golden Empire Council).[citation needed]
Population[]

Subregions and their counties commonly associated with the valley include:[6]
- North Sacramento Valley (all or parts of Shasta, Tehama, Glenn, Butte and Colusa counties)
- Sacramento Metropolitan area (all or parts of Sacramento, El Dorado, Solano, Sutter, Yuba, Yolo and Placer counties)
- North San Joaquin (all or parts of San Joaquin, Stanislaus and Merced counties)
- South San Joaquin (all or parts of Madera, Fresno, Kings, Tulare and Kern counties)
The four main population centers in the Central Valley area roughly equidistant from the next. From south to north, they are Bakersfield, Fresno, Sacramento and Redding. These four cities act as hubs for regional commerce and transportation.
Metropolitan areas[]
As of 2010 some 7.2 million people lived in the Central Valley; it was the fastest growing region in California.[7] It includes 12 Metropolitan Statistical Areas (MSA) and 1 Micropolitan Statistical Area (μSA). Below, they are listed by MSA and μSA population. The largest city is Fresno followed by the state capital Sacramento. The following metropolitan and micropolitan statistical areas listed from largest to smallest:
| SMSA | Population |
|---|---|
| Sacramento Metropolitan Area | 2,527,123 |
| Fresno Metropolitan Area | 930,450 |
| Bakersfield Metropolitan Area | 839,361 |
| Stockton Metropolitan Area | 696,214 |
| Modesto Metropolitan Area | 518,522 |
| Visalia–Porterville Metropolitan Area | 449,253 |
| Merced Metropolitan Area | 259,898 |
| Chico Metropolitan Area | 220,266 |
| Redding Metropolitan Area | 177,774 |
| Yuba City Metropolitan Area | 167,497 |
| Hanford–Corcoran Metropolitan Area | 153,765 |
| Madera Metropolitan Area | 152,925 |
| Red Bluff Micropolitan Area | 63,601 |
Ethnography[]
After English and Spanish, Hmong is the third most commonly spoken language in the Central Valley.[8]
Geography[]

The flatness of the valley floor contrasts with the rugged hills or gentle mountains that are typical of most of California's terrain. The valley is thought to have originated below sea level as an offshore area depressed by subduction of the Farallon Plate into a trench further offshore. The valley has no earthquake faults of its own, but is surrounded by faults to the east and west.

The valley was enclosed by the uplift of the Coast Ranges, with its original outlet into Monterey Bay. Faulting moved the Coast Ranges, and a new outlet developed near what is now San Francisco Bay. Over the millennia, the valley filled with the sediments of these same ranges, as well as the rising Sierra Nevada to the east; that filling eventually created an extraordinary flatness just barely above sea level. Before California's flood control and aqueduct system was built, annual snow melt turned much of the valley into an inland sea.
The one notable exception to the flat valley floor is Sutter Buttes, the remnants of an extinct volcano just to the northwest of Yuba City.
Another significant geologic feature of the Central Valley lies hidden beneath the delta. The Stockton Arch is an upwarping of the crust beneath the valley sediments that extends southwest to northeast across the valley.
The Central Valley lies within the California Trough physiographic section, which is part of the larger Pacific Border province, which in turn is part of the Pacific Mountain System.[9][10]
Environment[]

The Central Valley was formerly a diverse expanse of grassland, containing areas of prairie, desert grassland (at the southern end), oak savanna, riparian forest, marsh, several types of seasonal vernal pools, and large lakes such as now-dry Tulare Lake (once the largest freshwater lake west of the Mississippi), Buena Vista Lake and Kern Lake. However, much of the Central Valley environment has been altered by human activity, including the introduction of exotic plants, notably grasses. The valley's grasslands, wetlands, and riparian forests constitute the California Central Valley grasslands, a temperate grasslands, savannas, and shrublands ecoregion. The foothill oak woodlands and chaparral that fringe the valley have been categorized as the California interior chaparral and woodlands ecoregion.[11]
Flora[]
This section does not cite any sources. (May 2021) |
The dominant grass of the valley was Nassella pulchra mixed with other species, but today only 1% of the grassland in the valley is intact. Grassland flowers include California poppy (Eschscholzia californica), lupins, and purple owl's clover (Castilleja exserta), which can still be seen, especially in Antelope Valley in the Tehachapi Mountains. Riverside trees include willows, western sycamore (Platanus racemosa), box elder (Acer negundo), Fremont cottonwood (Populus fremontii), and the endemic valley oak (Quercus lobata).
Fauna[]
This section does not cite any sources. (May 2021) |
The Central Valley was once home to large populations of pronghorn antelope (Antilocapra americana), elk including the endemic tule elk subspecies (Cervus elaphus nannodes), mule deer (Odocoileus hemionus), California ground squirrels, gophers, mice, hare, rabbits and kangaroo rats, along with their predators including the San Joaquin kit fox (an endangered subspecies surviving on the San Joaquin Valley's hillsides). The valley's wetlands were an important habitat for wintering waterbirds and migrating birds of other kinds. Reptiles and amphibians of the valley include the endemic San Joaquin coachwhip snake (Masticophis flagellum ruddocki), blunt-nosed leopard lizard (Gambelia sila), Gilbert's skink (Eumeces gilberti) and the western aquatic garter snake (Thamnophis couchii). Endemic invertebrates are present. The Central Valley is home to endemic fish species, including the Sacramento Pikeminnow, Sacramento Perch, Sacramento Blackfish, and Sacramento Splittail.
Protected areas[]
The Great Valley Grasslands State Park preserves an example of the valley's native grass habitat, while oak savanna habitats survive near Visalia. Areas of wetland and riverside woodland are found in the north especially by the Sacramento River system, including the Nature Conservancy's Cosumnes River Preserve just south of Sacramento, Gray Lodge Wildlife Area, Butte Sink Wildlife Management Area, and other patches in the delta area. Remaining vernal pools include Pixley National Wildlife Refuge between Tulare, California, and Bakersfield and Jepson Prairie Preserve in the delta. Large blocks of desert scrubland exist in the southern San Joaquin Valley and in the Carrizo Plain, just outside the valley, but offering a similar landscape.
The wetlands have been the target of rescue operations to restore areas replaced by agriculture.[12]
These patches of natural habitat are disconnected, which is particularly damaging for wildlife that is used to migrating along the rivers. Agriculture, grazing land, and the draining of lakes and rivers have radically altered the valley habitats. Most of the grassland has been overtaken by new species; most vernal pools have been destroyed, leaving only those on the higher slopes; the marshland has been drained; and the riverbank woodlands have nearly all been affected.[citation needed]
Health[]
The valley gives its name to Valley fever, which is primarily a disease of the lungs that is common in the southwestern United States and northwestern Mexico. It is caused by the fungus Coccidioides immitis, which grows in soils in areas of low rainfall, high summer temperatures, and moderate winter temperatures. These fungal spores become airborne when the soil is disturbed by winds, construction, or farming. This illness frequently takes weeks or months to resolve. Occasionally Valley Fever is life-threatening or even fatal.
Due to the agricultural industry's large presence in the Valley, pesticide drift and leaching have become concerns. Residents risk contamination when living in proximity of application sites.
Climate[]

The northern Central Valley has a hot Mediterranean climate (Köppen climate classification Csa); the more southerly parts in rainshadow zones are dry enough to be Mediterranean steppe (BShs, as around Fresno) or even low-latitude desert (BWh, as in areas around Bakersfield). It is very hot and dry during the summer and cool and damp in winter, when frequent ground fog known regionally as "tule fog" can obscure vision. Summer daytime temperatures frequently surpass 100 °F (38 °C), and common heat waves might bring temperatures exceeding 115 °F (46 °C). Mid-autumn to mid-spring is the rainy season — although during the late summer, southeasterly winds can bring tropical thunderstorms, mainly in the southern half of the San Joaquin Valley but occasionally to the Sacramento Valley. The northern half of the Central Valley receives greater precipitation than the semidesert southern half. Frost occurs at times in the fall months, but snow is extremely rare.[13]
Tule fog[]
This section does not cite any sources. (May 2021) |
Tule fog /ˈtuːliː/ is a thick ground fog that settles along the valley's length. Tule fog forms during the late fall and winter (California's rainy season), after the first significant rainfall. The official season is from November 1 to March 31. This phenomenon is named after the valley's tule grass wetlands (tulares). Accidents caused by the tule fog are the leading cause of weather-related casualties in California.
Statistics for selected cities[]
| showClimate data for Sacramento, California (Sacramento Executive Airport), 1981–2010 normals, extremes 1941–present[a] |
|---|
| showClimate data for Sacramento 5 ESE, California (Sacramento State[18]), 1981–2010 normals, extremes 1877–present) |
|---|
| showClimate data for Fresno, California (Fresno Airport), 1981–2010 normals, extremes 1881–present[b] |
|---|
Hydrography[]
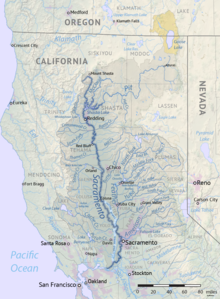
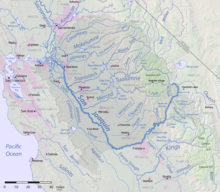
Two river systems drain and define the two parts of the Central Valley. The Sacramento River, along with its tributaries the Feather River and American River, flows southwards through the Sacramento Valley for about 447 miles (719 km).[24] In the San Joaquin Valley, the San Joaquin River flows roughly northwest for 365 miles (587 km), picking up tributaries such as the Merced River, Tuolumne River, Stanislaus River and Mokelumne River.[25] The Central Valley watershed encompasses over a third of California at 60,000 square miles (160,000 km2), with 46 percent draining into the Sacramento River, 26 percent into the San Joaquin, and 27 percent into Tulare Lake.
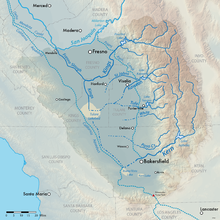
In the south part of the San Joaquin Valley, the alluvial fan of the Kings River and another from Coast Ranges streams have created a divide. The dry Tulare basin of the Central Valley, receives flow from four major Sierra Nevada rivers, the Kings, Kaweah, Tule and Kern. This basin, usually endorheic, formerly filled during snowmelt and spilled out into the San Joaquin River. Called Tulare Lake, it is usually dry because the rivers feeding it have been diverted for agricultural purposes.[26]
Central Valley rivers converge in the Sacramento-San Joaquin Delta, a network of marshy channels, distributaries and sloughs that wind around islands mainly used for agriculture. There the rivers merge with tidewater, and eventually reach the ocean after passing through Suisun Bay, San Pablo Bay, upper San Francisco Bay and finally the Golden Gate. Many of the islands lie below sea level because of intensive agriculture, and face a high risk of flooding, which would allow salt water to rush back into the delta, especially when too little fresh water is flowing in from the Valley.[27]
The Sacramento River carries far more water than the San Joaquin, with an estimated 22 million acre-feet (27 km3) of virgin annual runoff, as compared to the San Joaquin's approximately 6 million acre-feet (7.4 km3). Intensive agricultural and municipal water consumption decreased the rate of outflow to about 17 million acre-feet (21 km3) for the Sacramento and 3 million acre-feet (3.7 km3) for the San Joaquin. These figures vary widely from year to year. Over 25 million people, living both in the valley and in other regions of the state, rely on the water carried by these rivers.[28]
Engineering[]
Sierra Nevada runoff provides one of California's largest water resources. The Sacramento River is the second largest river to empty into the Pacific from the Continental United States, behind only the Columbia River and greater than the Colorado River.[29] Combined with the fertile and expansive area of the Central Valley's floor, the Central Valley is ideal for agriculture.[30]
The Central Valley is one of the United States's most productive growing regions. This is made possible by engineering the watercourses to prevent flooding during the spring snowmelt and drying up in the summer and autumn.[31] Many dams, including Shasta Dam, Oroville Dam, Folsom Dam, New Melones Dam, Don Pedro Dam, Hetch Hetchy Dam, Friant Dam, Pine Flat Dam and Isabella Dam, were constructed on the rivers, with many of them being part of the Central Valley Project.[31] These dams impact physical, economic, cultural, and ecological resources: for example, enabling development of its vast agricultural resources but leading to the loss of the Chinook salmon.[32]
Post-World War II demand for urban development, most notably the San Francisco Bay Area and the Los Angeles/Inland Empire/San Diego, required water resources. Moreover, agriculture in the southern Central Valley required far more water than available locally. The Feather River in the Sacramento Valley was looked to as a water source, leading to the California State Water Project. This transports water to the southern San Joaquin Valley and urban areas south of the Tehachapi Mountains.[33]
Runoff from the Sacramento and San Joaquin Rivers is intercepted in the delta through a series of pumps that divert water into the California Aqueduct, which runs south along the length of the San Joaquin Valley.[34] In parallel, pumps divert water into the Delta–Mendota Canal. The flow of the Sacramento River is further supplemented by a tunnel from the Trinity River (a tributary of the Klamath River, northwest of the Sacramento Valley) near Redding.[35] Cities of the San Francisco Bay Area, also needing water, built aqueducts from the Mokelumne River and Tuolumne River that run east to west across the middle part of the Central Valley.[36][37]
Flooding[]
This section needs additional citations for verification. (January 2017) |
Most valley lowlands are prone to flooding, especially in the old Tulare Lake, Buena Vista Lake, and Kern Lake rivers. The Kings, Kaweah, Tule and Kern rivers originally flowed into these seasonal lakes, which would expand each spring to flood large parts of the southern San Joaquin Valley. Farms, towns and infrastructure in these lakebeds are protected with levee systems, while the risk of floods damaging properties increased greatly.
The Great Flood of 1862 was the valley's worst flood in recorded history, flooding most of the valley and putting some places as much as 20 feet under water.
In 2003, it was determined that Sacramento had both the least protection against and nearly the highest risk of flooding. Congress then granted a $220 million loan for upgrades in Sacramento County.[38] Other counties in the valley that often face flooding are Yuba, Stanislaus, and San Joaquin.
In popular culture[]
Much of Goliath season 3 is set in Central Valley. Season 3 episode 3 is titled "Good Morning, Central Valley".[39]
Economy[]
Agriculture is the primary industry in most of the Central Valley. A notable exception is the Sacramento area, which hosts a large and stable workforce of government employees. Despite state hiring cutbacks and the closure of several military bases, Sacramento's economy has continued to expand and diversify and now more closely resembles that of the San Francisco Bay Area. Primary sources of population growth are Bay Area migrants seeking lower housing costs, augmented by immigration from Asia, Central America, Mexico, Ukraine and the rest of the former Soviet Union.[6]
Agriculture[]
The Central Valley is one of the world's most productive agricultural regions.[40][5] More than 230 crops are grown there.[5] On less than 1 percent of the total farmland in the United States, the Central Valley produces 8 percent of the nation's agricultural output by value: US$43.5 billion in 2013.[41] California's farms and ranches earned almost $50 billion in 2018.[42] The valley's productivity relies on irrigation from surface water and groundwater. About one-sixth of the US' irrigated land is in the Central Valley.[43]
Virtually all non-tropical crops are grown in the Central Valley, which is the primary source for produce throughout the United States, including tomatoes, almonds, grapes, cotton, apricots, and asparagus.[44]
6,000 almond growers produced more than 1.8 million tonnes in 2013, about 60 percent of the world's supply.[45][46]
The US' top four counties in agricultural sales are in the Central Valley (2007 Data).[6][47]
| County | Sales |
|---|---|
| Fresno County | $3.731B |
| Tulare County | $3.335B |
| Kern County | $3.204B |
| Merced County | $2.330 |
Early farming was concentrated close to the Sacramento-San Joaquin Delta, where the water table was high year round and water transport readily available. Subsequent irrigation projects brought many more parts of the valley into productive use.[48] The even larger California State Water Project was formed in the 1950s and construction continued over the following decades.
National Farmworkers Association (NFWA)[]
This section does not cite any sources. (May 2021) |
In the 1960s, farm labor leaders Cesar Chavez and Dolores Huerta organized Mexican American grape pickers into a union, the National Farmworkers Association (NFWA), in order to improve their working conditions. This organizing took place primarily in the Central Valley, especially in and around Delano, because of the extensive agriculture.
Utilities[]
This section does not cite any sources. (May 2021) |
The state water project's Oroville Dam in the Sacramento Valley provides water and power for the California Aqueduct in the San Joaquin Valley. The aqueduct runs from Clifton Court Forebay in the Delta southwards across the Transverse Ranges. The Central Valley Project includes numerous facilities between Shasta Dam in the north and Bakersfield in the south. Pacific Gas and Electric, Western Area Power Administration, and Southern California Edison built an interconnected electric grid connecting the north and south ends of the Central Valley.
See also[]
Notes[]
- ^ Official records for Sacramento were kept exclusively at the airport since 10 November 1941.[14]
- ^ Official records for Fresno kept September 1881 to 15 August 1887 at downtown, 16 August 1887 to June 1939 at Fresno City Offices, July 1939 to 20 August 1949 at Chandler Field, and at Fresno Yosemite Int'l since 21 August 1949. For more information, see Threadex
References[]
- ^ Jump up to: a b "California Central Valley". American Museum of Natural History. Archived from the original on October 29, 2016.
- ^ "Central Valley". Geographic Names Information System. United States Geological Survey.
- ^ "California's Central Valley: Producing America's Fruits and Vegetables". House Committee on Natural Resources. Archived from the original on June 23, 2015. Retrieved May 15, 2017.
- ^ "Federal Agencies Release Data Showing California Central Valley Idle Farmland Doubling During Drought". landsat.gsfc.nasa.gov. Archived from the original on April 10, 2016.
- ^ Jump up to: a b c Bittman, Mark (October 10, 2012). "Everyone Eats There". The New York Times. Archived from the original on October 13, 2012. Retrieved October 10, 2012.
Central Valley, which is really two valleys: the San Joaquin to the south and Sacramento to the north. All told,[sic] the Central Valley is about 450 miles long, from Bakersfield up to Redding, and is 60 miles at its widest, between the Sierra Nevada to the east and the Coast Ranges to the west.
- ^ Jump up to: a b c d "A Statistical Tour of California's Great Central Valley". California Research Bureau. California State Library. Archived from the original on May 3, 2009. Retrieved July 27, 2009.
- ^ Jennings, Joanne Elgart (November 1, 2010). "California's Central Valley Finds Itself on the Political Map". PBS Newshour. Archived from the original on January 25, 2018. Retrieved January 23, 2018.
About 6.5 million people live here, making it the state's fastest growing region, according to the 2010 U.S. Census. Between 1990 and 2009, the population here grew 44 percent (compared with 24 percent growth statewide).
- ^ "Hmong". Science and Environment Podcast. University of California Merced. Archived from the original on July 21, 2011. Retrieved September 20, 2010.
- ^ "Physiographic divisions of the conterminous U. S." U.S. Geological Survey. Archived from the original on December 5, 2007. Retrieved December 6, 2007.
- ^ Benke, Arthur C.; Cushing, Colbert E. (2005). Rivers of North America. Academic Press. p. 554. ISBN 0-12-088253-1.
- ^ "California Central Valley grasslands". Terrestrial Ecoregions. World Wildlife Fund. Retrieved November 13, 2011.
- ^ Philip Garone, The Fall and Rise of the Wetlands of California's Great Central Valley (University of California Press; 2011)
- ^ "Climate of California". Western Regional Climate Center. .www.wrcc.dri.edu. Archived from the original on July 21, 2009. Retrieved July 26, 2009.
- ^ ThreadEx
- ^ Jump up to: a b "NowData – NOAA Online Weather Data". National Oceanic and Atmospheric Administration. Retrieved August 17, 2020.
- ^ "Station Name: CA SACRAMENTO EXECUTIVE AP". National Oceanic and Atmospheric Administration. Retrieved July 19, 2020.
- ^ "WMO Climate Normals for SACRAMENTO/EXECUTIVE ARPT CA 1961–1990". National Oceanic and Atmospheric Administration. Retrieved July 19, 2020.
- ^ Reese, Phillip (January 7, 2015). "2014 was hottest year in Sacramento's history". Sacramento Bee.
- ^ "SACRAMENTO 5 ESE, CALIFORNIA". Western Regional Climate Center.
- ^ "NowData – NOAA Online Weather Data". National Oceanic and Atmospheric Administration. Retrieved December 3, 2012.
- ^ "Station Name: CA FRESNO YOSEMITE INTL AP". National Oceanic and Atmospheric Administration. Retrieved April 22, 2014.
- ^ "WMO Climate Normals for FRESNO/AIR TERMINAL CA 1961–1990". National Oceanic and Atmospheric Administration. Retrieved March 11, 2014.
- ^ "Average Weather for Fresno, CA – Temperature and Precipitation". The Weather Channel. Retrieved September 20, 2011.
- ^ "Sacramento River Basin National Water Quality Assessment Program: Study Unit Description". United States Geological Survey. ca.water.usgs.gov. Archived from the original on August 13, 2009. Retrieved July 26, 2009.
- ^ "Restoring the San Joaquin River: Following an 18-year legal battle, a great California river once given up for dead is on the verge of a comeback". Natural Resources Defense Council. www.nrdc.org. September 17, 2007. Archived from the original on July 9, 2009. Retrieved July 26, 2009.
- ^ Gorelick, Ellen. "Tulare Lake". Tulare Historical Museum. www.tularehistoricalmueseum.org. Archived from the original on February 19, 2010. Retrieved July 26, 2009.
- ^ "Delta Subsidence in California: The sinking heart of the State" (PDF). United States Geological Survey. ca.water.usgs.gov. Archived (PDF) from the original on July 10, 2011. Retrieved July 26, 2009.
- ^ "Sacramento-San Joaquin River System, California". American Rivers. America's Most Endangered Rivers Report: 2009 Edition. Archived from the original on January 17, 2010. Retrieved July 26, 2009.
- ^ The Columbia is the largest, with an average discharge of 265,000 cu ft/s (7,500 m3/s). The Sacramento comes next with a flow of 30,215 cu ft/s (855.6 m3/s), and even though the Colorado is much longer, its discharge is only about 10,000 cu ft/s (280 m3/s) to 22,000 cu ft/s (620 m3/s) (that is before diversions started; the river is currently dry at the mouth). Other significant rivers include the Klamath 17,010 cu ft/s (482 m3/s), Skagit 16,598 cu ft/s (470.0 m3/s), Snohomish 13,900 cu ft/s (390 m3/s), and San Joaquin 10,397 cu ft/s (294.4 m3/s).
- ^ "California's Central Valley". National Public Radio. November 11, 2002. Archived from the original on October 16, 2010. Retrieved May 27, 2010.
- ^ Jump up to: a b Stene, Eric A. "The Central Valley Project: Introduction". U.S. Bureau of Reclamation. Archived from the original on May 27, 2010. Retrieved May 27, 2010.
- ^ "Ecosystem Restoration: Systemwide Central Valley Chinook Salmon" (PDF). CALFED Bay-Delta Program. Archived (PDF) from the original on May 27, 2010. Retrieved May 27, 2010.
- ^ "California State Water Project Overview". California State Water Project. California Department of Water Resources. April 15, 2009. Archived from the original on May 27, 2010. Retrieved May 27, 2010.
- ^ "California State Water Project Today". California State Water Project. California Department of Water Resources. July 18, 2008. Archived from the original on September 1, 2010. Retrieved May 27, 2010.
- ^ Anderson, David (July 4, 1999). "A temporary diversion". Times-Standard. Archived from the original on January 3, 2010. Retrieved May 27, 2010.
- ^ "The Hetch Hetchy Aqueduct". Aquafornia. August 19, 2008. Archived from the original on January 10, 2013. Retrieved May 27, 2010.
- ^ "Mokelumne Aqueduct". Aquafornia. August 19, 2008. Archived from the original on January 10, 2013. Retrieved May 27, 2010.
- ^ "Sacramento Flood Protection". Archived from the original on August 9, 2011.
- ^ Hart, Daniel (October 4, 2019). "Goliath Recap: Nothing Here, Is What It Seems. He's Back!". RSC!. Ready Steady Cut.
- ^ BERGON, FRANK (August 30, 2019). "San Joaquin Valley's rich diversity shows America what it is becoming". Fresno Bee. Archived from the original on September 14, 2019. Retrieved October 2, 2019.
- ^ "Archived copy" (PDF). Archived (PDF) from the original on June 19, 2016. Retrieved March 29, 2016.CS1 maint: archived copy as title (link)
- ^ "CDFA - Statistics". www.cdfa.ca.gov.
- ^ Reilly, Thomas E. (2008). Ground-Water Availability in the United States: U.S. Geological Survey Circular 1323. Denver, CO: U.S. Geological Survey. p. 84. ISBN 978-1-4113-2183-0.
- ^ Pollan, Michael (December 16, 2007). "Our Decrepit Food Factories". The New York Times magazine. Archived from the original on November 18, 2011. Retrieved November 13, 2011.
- ^ Purdum, Todd S. (September 6, 2000). "California's Central Valley. Where the Mountains Are Almonds". The New York Times. Retrieved December 16, 2008.
The state's 6,000 growers produce more than 600 million pounds a year, more than 70 percent of the world's supply and virtually 100 percent of domestic production.
- ^ "Production/Crops for almonds with shell" (database). Food and Agriculture Organization of the United Nations, Statistics Division, FAOSTAT. 2013. Archived from the original on November 22, 2016. Retrieved December 22, 2015.
- ^ Parker, Timothy S. (October 27, 2011). "United States Fact Sheet: US agriculture income population food education employment unemployment federal funds farms top commodities exports counties financial indicators poverty food security farm income Rural Nonmetro Urban Metropolitan America USDA organic Census of Agriculture". Ers.usda.gov. Archived from the original on June 26, 2012. Retrieved November 13, 2011.
- ^ Flores, Christina (March 1, 2011). "They Rule the Valley: The Story of How Large Central Valley Landholders Became the Primary Beneficiaries of the Central Valley Project". UC Berkeley. Cite journal requires
|journal=(help)
External links[]
| Wikimedia Commons has media related to: Central Valley of California |
- Central Valley Tourism Association
- CA Central Valley & Foothills, project area of the American Land Conservancy
- Great Valley Center
- The Big Valley series
| show Authority control |
|---|
- Central Valley (California)
- Valleys of California
- Agriculture in California
- Grasslands of California
- Geologic provinces of California
- Geography of California
- Regions of California
- Physiographic sections
- Valleys of Butte County, California
- Valleys of Colusa County, California
- Valleys of Glenn County, California
- Valleys of El Dorado County, California
- Valleys of Fresno County, California
- Valleys of Kern County, California
- Valleys of Kings County, California
- Valleys of Madera County, California
- Valleys of Merced County, California
- Valleys of Placer County, California
- Valleys of San Joaquin County, California
- Valleys of Sacramento County, California
- Valleys of Shasta County, California
- Valleys of Stanislaus County, California
- Valleys of Sutter County, California
- Valleys of Tehama County, California
- Valleys of Tulare County, California
- Valleys of Yuba County, California
- Valleys of Yolo County, California
- Almond production