Chigorodó
Chigorodó | |
|---|---|
Municipality and town | |
 Flag  Seal | |
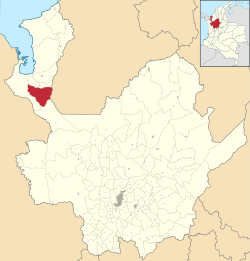 Location of the municipality and town of Chigorodó in the Antioquia Department of Colombia | |
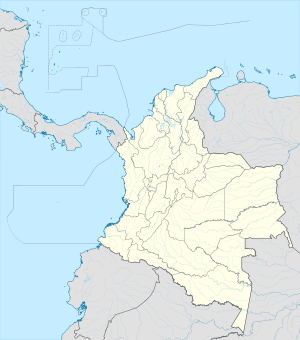 Chigorodó Location in Colombia | |
| Coordinates: 7°40′N 76°41′W / 7.667°N 76.683°W | |
| Country | |
| Department | |
| Subregion | Urabá |
| Founded | 1878 |
| Government | |
| • Mayor | Daniel Alvarez Sosa |
| Area | |
| • Total | 608 km2 (235 sq mi) |
| Elevation | 34 m (112 ft) |
| Population (2020 est.[1]) | |
| • Total | 86,239 |
| • Density | 140/km2 (370/sq mi) |
| Demonym(s) | Chigorodoseños |
| Time zone | UTC-5 (Colombia Standard Time) |
| Area code(s) | 57 + 4 |
| Website | Official website (in Spanish) |

Chigorodó (Spanish pronunciation: [tʃiɣoɾoˈðo]) is a town and municipality in Antioquia Department, Colombia.
Residents[]
- Jaime Castañeda, cyclist
Climate[]
Chigorodó has a tropical rainforest climate (Af) with heavy to very heavy rainfall year-round.
| Climate data for Chigorodó | |||||||||||||
|---|---|---|---|---|---|---|---|---|---|---|---|---|---|
| Month | Jan | Feb | Mar | Apr | May | Jun | Jul | Aug | Sep | Oct | Nov | Dec | Year |
| Average high °C (°F) | 31.5 (88.7) |
31.7 (89.1) |
32.1 (89.8) |
32.2 (90.0) |
30.8 (87.4) |
31.0 (87.8) |
31.4 (88.5) |
31.3 (88.3) |
30.9 (87.6) |
30.6 (87.1) |
30.6 (87.1) |
30.8 (87.4) |
31.2 (88.2) |
| Daily mean °C (°F) | 26.8 (80.2) |
27.2 (81.0) |
27.4 (81.3) |
27.4 (81.3) |
26.7 (80.1) |
26.7 (80.1) |
27.0 (80.6) |
26.9 (80.4) |
26.8 (80.2) |
26.6 (79.9) |
26.6 (79.9) |
26.6 (79.9) |
26.9 (80.4) |
| Average low °C (°F) | 22.1 (71.8) |
22.7 (72.9) |
22.8 (73.0) |
22.7 (72.9) |
22.6 (72.7) |
22.5 (72.5) |
22.6 (72.7) |
22.5 (72.5) |
22.7 (72.9) |
22.7 (72.9) |
22.7 (72.9) |
22.4 (72.3) |
22.6 (72.7) |
| Average rainfall mm (inches) | 142.2 (5.60) |
87.5 (3.44) |
120.6 (4.75) |
270.7 (10.66) |
427.9 (16.85) |
449.2 (17.69) |
396.5 (15.61) |
414.3 (16.31) |
443.6 (17.46) |
455.1 (17.92) |
363.2 (14.30) |
313.9 (12.36) |
3,884.7 (152.95) |
| Average rainy days | 9 | 7 | 9 | 16 | 20 | 23 | 24 | 23 | 23 | 23 | 21 | 16 | 214 |
| Average relative humidity (%) | 81 | 78 | 78 | 82 | 83 | 83 | 83 | 84 | 84 | 84 | 83 | 84 | 82 |
| Mean monthly sunshine hours | 105.4 | 107.3 | 65.1 | 81.0 | 74.4 | 75.0 | 80.6 | 96.1 | 81.0 | 105.4 | 90.0 | 86.8 | 1,048.1 |
| Mean daily sunshine hours | 3.4 | 3.8 | 2.1 | 2.7 | 2.4 | 2.5 | 2.6 | 3.1 | 2.7 | 3.4 | 3.0 | 2.8 | 2.9 |
| Source 1: IDEAM[2] | |||||||||||||
| Source 2: Climate-Data.org[3] | |||||||||||||
References[]
- ^ "Resultados y proyecciones (2005-2020) del censo 2005". Retrieved 12 April 2020.
- ^ "Data". www.ideam.gov.co. Retrieved 2020-08-30.
- ^ "Climate: Chigorodó". Climate-Data.org. Retrieved August 30, 2020.
Capital: Medellín | |||||||||||||||||||
| Regions and municipalities |
| ||||||||||||||||||
| Related topics | |||||||||||||||||||
Coordinates: 7°40′03″N 76°40′51″W / 7.66750°N 76.68083°W
This Department of Antioquia location article is a stub. You can help Wikipedia by . |
Categories:
- Municipalities of Antioquia Department
- Antioquia Department geography stubs