Demography of Slough
This article is intended to give an overview of the demography of Slough.
Population[]
The modern town of Slough grew from the parish of Upton-cum-Chalvey, Buckinghamshire, England. The populations given below are for the successive institutional areas of the principal local government level that could be recognised as Slough, now in Berkshire.
| Year | Population | Notes |
|---|---|---|
| 1801 | 1,018[1] | Parish of Upton-cum-Chalvey |
| 1811 | 1,083[1] | |
| 1821 | 1,268[1] | |
| 1831 | 1,502[1] | |
| 1841 | 2,296[1] | |
| 1851 | 3,573[1] | |
| 1861 | 4,688[1] | |
| 1871 | 5,940[1] | |
| 1881 | 7,030[1] | |
| 1891 | 7,700[1] | |
| 1901 | 11,453[1] | Slough Urban District from 1894; area enlarged in 1900[2] |
| 1911 | 14,982[1] | |
| 1921 | 16,392[1] | |
| 1931 | 33,612[1] | area enlarged in 1930/1931[2] |
| 1939 | 50,620[1] | estimate (1941 census not taken due to World War II):Municipal Borough from 1938 |
| 1951 | 66,471[1] | |
| 1961 | 80,781[1] | |
| 1971 | 87,075[1] | |
| 1981 | 96,512[3] | Borough of Slough in Berkshire and area enlarged from 1974 |
| 1991 | 101,066[3] | |
| 2001 | 119,070[4] | Area enlarged in 1995: Unitary Authority from 1998 |
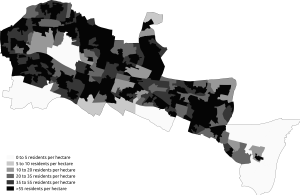
| 2011 | 140,200[5] | Up 16.3% on the 2001 Census, and 6.9% higher than the previous mid-2010 population estimate |
| 2016 | 149,400 | ONS - based on 2012 population trends |
Ethnicity[]
The following table shows the ethnic group of respondents in the 2001 and 2011 censuses in Slough.
| Ethnic Group | 2001[6] | 2011[7] | ||
|---|---|---|---|---|
| Number | % | Number | % | |
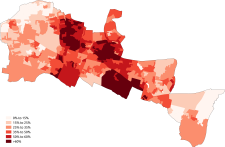
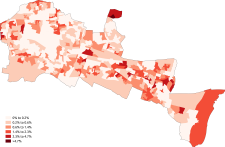
| White: British | 69,441 | 58.32% | 48,401 | 34.52% |
| White: Irish | 2,489 | 2.09% | 1,607 | 1.15% |
| White: Gypsy or Irish Traveller[note 1] | 220 | 0.16% | ||
| White: Other | 3,913 | 3.29% | 13,825 | 9.86% |
| White: Total | 75,843 | 63.70% | 64,053 | 45.69% |
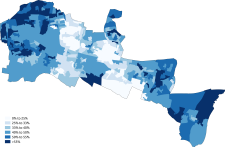
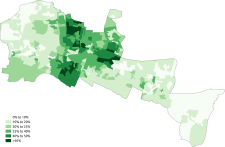
| Asian or Asian British: Indian | 16,719 | 14.04% | 21,922 | 15.64% |
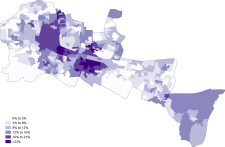
| Asian or Asian British: Pakistani | 14,360 | 12.06% | 24,869 | 17.74% |
| Asian or Asian British: Bangladeshi | 171 | 0.14% | 549 | 0.39% |
| Asian or Asian British: Chinese[note 2] | 349 | 0.29% | 797 | 0.57% |
| Asian or Asian British: Other Asian | 2,022 | 1.70% | 7,560 | 5.39% |
| Asian or Asian British: Total | 33,621 | 28.24% | 55,697 | 39.73% |
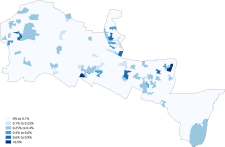
| Black or Black British: Caribbean | 3,470 | 2.91% | 3,096 | 2.21% |
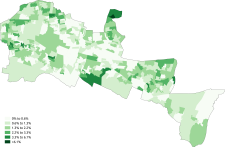
| Black or Black British: African | 2,275 | 1.91% | 7,548 | 5.38% |
| Black or Black British: Other Black | 281 | 0.24% | 1,471 | 1.05% |
| Black or Black British: Total | 6,026 | 5.06% | 12,115 | 8.64% |
| Mixed: White and Black Caribbean | 1,116 | 0.94% | 1,667 | 1.19% |
| Mixed: White and Black African | 224 | 0.19% | 607 | 0.43% |
| Mixed: White and Asian | 845 | 0.71% | 1,429 | 1.02% |
| Mixed: Other Mixed | 593 | 0.50% | 1,055 | 0.75% |
| Mixed: Total | 2,778 | 2.33% | 4,758 | 3.39% |
| Other: Arab[note 3] | 928 | 0.66% | ||
| Other: Any other ethnic group | 799 | 0.67% | 2,654 | 1.89% |
| Other: Total | 799 | 0.67% | 3,582 | 2.55% |
| Total | 119,067 | 100.00% | 140,205 | 100.00% |
Notes for table above

White

White-British
White-Irish
White-Other
Asian

Asian-Indian

Asian-Pakistani

Asian-Bangladeshi
Asian-Chinese

Black

Black-African

Black-Caribbean

Other-Arab


Languages[]
The most common main languages spoken in Slough according to the 2011 UK Census are shown below.[8]
| Rank | Language | Usual residents aged 3+ | Proportion |
|---|---|---|---|
| 1 | English | 96,508 | 72.90% |
| 2 | Polish | 8,249 | 6.23% |
| 3 | Punjabi | 8,247 | 6.23% |
| 4 | Urdu | 6,568 | 4.96% |
| 5 | Somali | 938 | 0.71% |
| 6 | Tamil | 860 | 0.65% |
| 7 | Hindi | 825 | 0.62% |
| 8 | Arabic | 703 | 0.53% |
| 9 | Gujarati | 534 | 0.40% |
| 10 | Tagalog/Filipino | 484 | 0.37% |
| 11 | Shona | 434 | 0.33% |
| 12 | Italian | 412 | 0.31% |
| 13 | Pashto | 412 | 0.31% |
| 14 | Romanian | 401 | 0.30% |
| 15 | French | 395 | 0.30% |
| 16 | Swahili/Kiswahili | 393 | 0.30% |
| 17 | Persian | 382 | 0.29% |
| 18 | Portuguese | 373 | 0.28% |
| 19 | Spanish | 297 | 0.22% |
| 20 | Bengali (with Sylheti and Chatgaya) | 287 | 0.22% |
| Other | 4,682 | 3.54% |
Religion[]
The following table shows the religion of respondents in the 2001 and 2011 censuses in Slough.
| Religion | 2001[9] | 2011[10] | ||
|---|---|---|---|---|
| Number | % | Number | % | |
| Christian | 63,993 | 53.75% | 57,726 | 41.17% |
| Buddhist | 294 | 0.25% | 743 | 0.53% |
| Hindu | 5,340 | 4.48% | 8,643 | 6.16% |
| Jewish | 139 | 0.12% | 87 | 0.06% |
| Muslim | 15,897 | 13.35% | 32,655 | 23.29% |
| Sikh | 10,820 | 9.09% | 14,889 | 10.62% |
| Other religion | 358 | 0.30% | 482 | 0.34% |
| No religion | 13,061 | 10.97% | 17,024 | 12.14% |
| Religion not stated | 9,165 | 7.70% | 7,956 | 5.67% |
| Total | 119,067 | 100.00% | 140,205 | 100.00% |
Christianity
Islam
Judaism

Hinduism

Sikhism

Buddhism

Other religion

No religion


See also[]
- Demography of the United Kingdom
- Demography of England
- Demography of London
- Demography of Birmingham
- Demography of Greater Manchester
- List of English cities by population
- List of English districts by population
- List of English districts and their ethnic composition
- List of English districts by area
- List of English districts by population density
References[]
- ^ a b c d e f g h i j k l m n o p q r p 153, The History of Slough, Maxwell Fraser, Slough Corporation, 1973
- ^ a b p 151, The History of Slough, Maxwell Fraser, Slough Corporation, 1973
- ^ a b Office for National Statistics, downloaded 31 December 2006[permanent dead link]
- ^ A Vision of Britain (Accessed 31 December 2006)
- ^ (Accessed 29 November 2013)
- ^ "2001 census - theme tables". NOMIS. Retrieved 17 June 2015.
- ^ "Download:local authorities: county / unitary". NOMIS. Retrieved 17 June 2015.
- ^ "Download:local authorities: county / unitary". NOMIS. Retrieved 17 June 2015.
- ^ "2001 census - theme tables". Retrieved 17 June 2015.
- ^ "Download:local authorities: county / unitary". NOMIS. Retrieved 17 June 2015.
Berkshire Portal | |
| Unitary authorities | |
| Major settlements | |
| Topics | |
- Slough
- Demographics of England