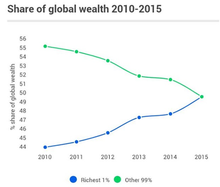
Distribution of wealth
This article needs additional citations for verification. (January 2020) |
[1]The distribution of wealth is a comparison of the wealth of various members or groups in a society. It shows one aspect of economic inequality or economic heterogeneity.
The distribution of wealth differs from the income distribution in that it looks at the economic distribution of ownership of the assets in a society, rather than the current income of members of that society. According to the International Association for Research in Income and Wealth, "the world distribution of wealth is much more unequal than that of income."[2]
For rankings regarding wealth, see list of countries by wealth equality or list of countries by wealth per adult.
Definition of wealth[]
Wealth of an individual is defined as net worth, expressed as: wealth = assets − liabilities
A broader definition of wealth, which is rarely used in the measurement of wealth inequality, also includes human capital. For example, the United Nations definition of inclusive wealth is a monetary measure which includes the sum of natural, human and physical assets.[3][4]
The relation between wealth, income, and expenses is: change of wealth = saving = income − consumption (expenses). If an individual has a large income but also large expenses, the net effect of that income on her or his wealth could be small or even negative.
Conceptual framework[]
There are many ways in which the distribution of wealth can be analyzed. One common-used example is to compare the amount of the wealth of individual at say 99 percentile relative to the wealth of the median (or 50th) percentile. This is P99/P50, which is one of the potential Kuznets ratios. Another common measure is the ratio of total amount of wealth in the hand of top say 1% of the wealth distribution over the total wealth in the economy. In many societies, the richest ten percent control more than half of the total wealth.
The Pareto Distribution has often been used to mathematically quantify the distribution of wealth at the right tail (the wealth of very rich). In fact, the tail of wealth distributions, similar to that of income distribution, behaves like a Pareto distribution but with a thicker tail.
Wealth over people (WOP) curves are a visually compelling way to show the distribution of wealth in a nation. WOP curves are modified distribution of wealth curves. The vertical and horizontal scales each show percentages from zero to one hundred. We imagine all the households in a nation being sorted from richest to poorest. They are then shrunk down and lined up (richest at the left) along the horizontal scale. For any particular household, its point on the curve represents how their wealth compares (as a proportion) to the average wealth of the richest percentile. For any nation, the average wealth of the richest 1/100 of households is the topmost point on the curve (people, 1%; wealth, 100%) or (p=1, w=100) or (1, 100). In the real world two points on the WOP curve are always known before any statistics are gathered. These are the topmost point (1, 100) by definition, and the rightmost point (poorest people, lowest wealth) or (p=100, w=0) or (100, 0). This unfortunate rightmost point is given because there are always at least one percent of households (incarcerated, long term illness, etc.) with no wealth at all. Given that the topmost and rightmost points are fixed ... our interest lies in the form of the WOP curve between them. There are two extreme possible forms of the curve. The first is the "perfect communist" WOP. It is a straight line from the leftmost (maximum wealth) point horizontally across the people scale to p=99. Then it drops vertically to wealth = 0 at (p=100, w=0).
The other extreme is the "perfect tyranny" form. It starts on the left at the Tyrant's maximum wealth of 100%. It then immediately drops to zero at p=2, and continues at zero horizontally across the rest of the people. That is, the tyrant and his friends (the top percentile) own all the nation's wealth. All other citizens are serfs or slaves. An obvious intermediate form is a straight line connecting the left/top point to the right/bottom point. In such a "Diagonal" society a household in the richest percentile would have just twice the wealth of a family in the median (50th) percentile. Such a society is compelling to many (especially the poor). In fact it is a comparison to a diagonal society that is the basis for the Gini values used as a measure of the disequity in a particular economy. These Gini values (40.8 in 2007) show the United States to be the third most dis-equitable economy of all the developed nations (behind Denmark and Switzerland).
More sophisticated models have also been proposed.[5]
Theoretical approaches[]
To model aspects of the distribution and holdings of wealth, there have been many different types of theories used. Before the 1960s, the data regarding this was collected mostly from wealth tax and estate tax records, with further proof gathered from small unrepresentative examinations and a variety of other sources. The results from these sources tended to show that the distribution of wealth was very unequal, and that material inheritance had a big role in the matter of wealth differences and in the transmission of the status of wealth from generation to generation. There was also reason to believe that the inequality in wealth was shrinking over time, and also the distribution’s shape demonstrated particular statistical regularities that could not have been caused by coincidence. Thus, early theoretical work on the distribution of wealth wanted to explain the statistical regularities, and also comprehend the relationship of basic forces which could be an explanation for the concentration of wealth to be high and the trend of declining over time.[6]
More lately, the research about wealth distribution has moved away from the worry with overall distributional characteristics, and in its place focuses more on the grounds of individual differences in the holdings of wealth.[6] This change was caused partly because the importance of saving for retirement increased, and it is reflected in the vital role now assigned to the model of lifecycle savings developed by Modigliani and Brumberg[7] (1954), and Ando and Modigliani[8] (1963). Another important progress has been the increase in availability and finesse in sets of micro-data, which offer not just estimations of individuals’ asset holdings and savings but also a variety of other household and personal characteristics that can assist in explain the differences in wealth.[6]
Inequality[]
This section needs to be updated. (June 2019) |
Wealth distribution pyramid[]
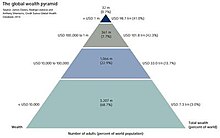
In 2013, Credit Suisse prepared a wealth pyramid infographic (shown right). Personal assets were calculated in net worth, meaning wealth would be negated by having any mortgages.[9] It has a large base of low wealth holders, alongside upper tiers occupied by progressively fewer people. In 2013 Credit-suisse estimate that 3.2 billion individuals – more than two thirds of adults in the world – have wealth below US$10,000. A further one billion (adult population) fall within the 10,000 – US$100,000 range. While the average wealth holding is modest in the base and middle segments of the pyramid, their total wealth amounts to US$40 trillion, underlining the potential for novel consumer products and innovative financial services targeted at this often neglected segment.[10]
The pyramid shows that:
- half of the world's net wealth belongs to the top 1%,
- top 10% of adults hold 85%, while the bottom 90% hold the remaining 15% of the world's total wealth,
- top 30% of adults hold 97% of the total wealth.
Wealth distribution in 2012[]
According to the OECD in 2012 the top 0.6% of world population (consisting of adults with more than US$1 million in assets) or the 42 million richest people in the world held 39.3% of world wealth. The next 4.4% (311 million people) held 32.3% of world wealth. The bottom 95% held 28.4% of world wealth. The large gaps of the report get by the Gini index to 0.893, and are larger than gaps in global income inequality, measured in 2009 at 0.38.[11] For example, in 2012 the bottom 60% of the world population held same wealth in 2012 as the people on Forbes' Richest list consisting of 1,226 richest billionaires of the world.
21st century[]
At the end of the 20th century, wealth was concentrated among the G8 and Western industrialized nations, along with several Asian and OPEC nations.
Wealth inequality[]
A study by the World Institute for Development Economics Research at United Nations University reports that the richest 1% of adults alone owned 40% of global assets in the year 2000, and that the richest 10% of adults accounted for 85% of the world total. The bottom half of the world adult population owned 1% of global wealth.[12]
- Launch of the WIDER study on The World Distribution of Household Wealth (includes press release, summary, and data)
- Estimating the Level and Distribution of Global Household Wealth (copy of full report with a cover page added)
- The World Distribution of Household Wealth (exact copy of report published at United Nations website)
Moreover, another study found that the richest 2% own more than half of global household assets.[13]
A 2017 Oxfam report found that collectively, just eight men own more than the least wealthy half of the entire human population.[14][15]
Real estate[]
While sizeable numbers of households own no land, few have no income. For example, the top 10% of land owners (all corporations) in Baltimore, Maryland own 58% of the taxable land value. The bottom 10% of those who own any land own less than 1% of the total land value.[16] This form of analysis as well as Gini coefficient analysis has been used to support land value taxation.
Credit Suisse Report – Wealth Distribution & Gini (2021)[]
This table was created from information provided by the Credit Suisse Research Institute's "Global Wealth Databook", Table 3-1, published 2021.[17]
| Country | Adults (1,000) |
Wealth per adult (USD) |
Distribution of adults (%) by wealth range (USD) | Gini (%) | ||||
|---|---|---|---|---|---|---|---|---|
| Mean | Median | Under 10k | 10k – 100k | 100k – 1M | Over 1M | |||
| 18,356 | 1,744 | 734 | 97.6 | 2.4 | 0.1 | 0.0 | 72.8 | |
| 2,187 | 30,524 | 15,363 | 41.0 | 54.2 | 4.7 | 0.1 | 68.2 | |
| 27,620 | 8,871 | 2,302 | 87.0 | 11.7 | 1.2 | 0.1 | 84.8 | |
| 14,339 | 3,529 | 1,131 | 93.5 | 6.2 | 0.2 | 0.0 | 80.6 | |
| 30,799 | 7,224 | 2,157 | 88.2 | 11.2 | 0.6 | 0.0 | 81.2 | |
| 2,176 | 22,573 | 9,411 | 52.3 | 44.0 | 3.5 | 0.1 | 73.0 | |
| 19,159 | 483,755 | 238,072 | 9.8 | 20.7 | 60.0 | 9.4 | 65.6 | |
| 7,271 | 290,348 | 91,833 | 14.2 | 36.9 | 44.1 | 4.8 | 73.5 | |
| 7,155 | 11,926 | 5,022 | 73.5 | 25.2 | 1.3 | 0.0 | 72.7 | |
| 278 | 56,737 | 7,507 | 54.0 | 39.7 | 5.7 | 0.6 | 91.4 | |
| 1,318 | 87,559 | 14,520 | 45.0 | 48.0 | 6.1 | 0.9 | 88.9 | |
| 106,060 | 7,837 | 3,062 | 84.6 | 14.6 | 0.7 | 0.0 | 75.2 | |
| 221 | 63,261 | 21,071 | 41.0 | 46.0 | 12.4 | 0.6 | 80.4 | |
| 7,367 | 23,278 | 12,168 | 45.9 | 51.3 | 2.8 | 0.1 | 66.7 | |
| 8,993 | 351,327 | 230,548 | 11.9 | 20.1 | 62.3 | 5.7 | 60.3 | |
| 245 | 10,364 | 3,015 | 82.0 | 16.6 | 1.4 | 0.0 | 83.4 | |
| 5,839 | 2,558 | 890 | 95.6 | 4.3 | 0.1 | 0.0 | 78.2 | |
| 7,088 | 12,286 | 3,804 | 78.1 | 20.5 | 1.3 | 0.1 | 81.0 | |
| 2,637 | 30,597 | 15,283 | 41.0 | 54.1 | 4.8 | 0.1 | 68.6 | |
| 1,358 | 15,598 | 3,680 | 80.0 | 16.8 | 3.1 | 0.1 | 87.3 | |
| 153,307 | 18,272 | 3,469 | 79.5 | 17.5 | 2.8 | 0.1 | 89.0 | |
| 567 | 45,109 | 14,684 | 44.0 | 47.7 | 7.9 | 0.4 | 80.8 | |
| 309 | 39,098 | 5,122 | 64.0 | 32.1 | 3.5 | 0.4 | 91.6 | |
| 5,586 | 36,443 | 17,403 | 38.7 | 54.9 | 6.2 | 0.2 | 70.1 | |
| 9,480 | 1,681 | 622 | 98.0 | 1.9 | 0.1 | 0.0 | 76.8 | |
| 5,381 | 728 | 281 | 99.5 | 0.5 | 0.0 | 0.0 | 75.1 | |
| 10,180 | 5,895 | 2,031 | 90.7 | 8.7 | 0.6 | 0.0 | 78.7 | |
| 12,716 | 3,042 | 941 | 94.3 | 5.5 | 0.2 | 0.0 | 81.6 | |
| 29,934 | 332,323 | 125,688 | 20.7 | 25.1 | 48.6 | 5.6 | 71.9 | |
| 2,161 | 840 | 212 | 98.8 | 1.2 | 0.0 | 0.0 | 85.9 | |
| 7,059 | 1,117 | 355 | 98.7 | 1.3 | 0.1 | 0.0 | 80.6 | |
| 14,259 | 53,591 | 17,747 | 39.1 | 51.6 | 8.8 | 0.5 | 79.7 | |
| 1,104,956 | 67,771 | 24,067 | 20.9 | 66.1 | 12.5 | 0.5 | 70.4 | |
| 35,612 | 16,928 | 4,854 | 72.0 | 25.4 | 2.5 | 0.1 | 82.7 | |
| 447 | 5,397 | 1,466 | 91.5 | 7.9 | 0.6 | 0.0 | 84.8 | |
| 39,740 | 1,240 | 356 | 98.3 | 1.6 | 0.1 | 0.0 | 83.2 | |
| 2,707 | 2,180 | 582 | 95.6 | 4.2 | 0.1 | 0.0 | 84.7 | |
| 3,696 | 44,337 | 14,662 | 44.0 | 47.4 | 8.4 | 0.3 | 79.9 | |
| 3,303 | 69,140 | 34,945 | 27.0 | 57.0 | 15.5 | 0.5 | 68.5 | |
| 679 | 142,304 | 35,300 | 23.0 | 57.0 | 18.3 | 1.7 | 80.7 | |
| 8,528 | 78,103 | 23,794 | 29.6 | 55.7 | 14.0 | 0.7 | 77.7 | |
| 4,557 | 376,069 | 165,622 | 15.4 | 25.4 | 52.5 | 6.7 | 73.6 | |
| 618 | 3,112 | 1,077 | 94.0 | 6.0 | 0.0 | 0.0 | 78.8 | |
| 258 | 40,909 | 16,810 | 40.0 | 52.7 | 7.1 | 0.2 | 69.1 | |
| 11,361 | 17,151 | 5,444 | 69.9 | 27.9 | 2.1 | 0.1 | 80.8 | |
| 59,547 | 19,468 | 6,329 | 66.5 | 30.7 | 2.6 | 0.1 | 79.2 | |
| 4,201 | 34,003 | 11,372 | 47.6 | 46.0 | 6.2 | 0.2 | 79.1 | |
| 776 | 18,246 | 4,561 | 77.0 | 18.8 | 4.1 | 0.1 | 86.3 | |
| 1,728 | 2,846 | 1,086 | 95.2 | 4.7 | 0.1 | 0.0 | 75.7 | |
| 1,044 | 77,817 | 38,901 | 30.5 | 53.5 | 15.3 | 0.7 | 73.8 | |
| 57,104 | 3,540 | 1,527 | 94.4 | 5.4 | 0.2 | 0.0 | 71.1 | |
| 564 | 15,708 | 5,764 | 69.0 | 28.3 | 2.6 | 0.1 | 77.4 | |
| 4,373 | 167,711 | 73,775 | 27.8 | 35.2 | 35.1 | 1.9 | 74.0 | |
| 49,967 | 299,355 | 133,559 | 14.8 | 27.0 | 53.3 | 4.9 | 70.0 | |
| 631 | 68,443 | 23,740 | 36.0 | 44.0 | 19.5 | 0.5 | 73.8 | |
| 1,216 | 13,696 | 4,685 | 74.0 | 24.5 | 1.4 | 0.1 | 79.3 | |
| 1,115 | 2,500 | 658 | 94.9 | 4.9 | 0.2 | 0.0 | 84.9 | |
| 2,959 | 14,162 | 4,223 | 77.7 | 20.7 | 1.5 | 0.1 | 81.3 | |
| 68,015 | 268,681 | 65,374 | 10.6 | 45.2 | 39.8 | 4.3 | 77.9 | |
| 16,617 | 6,132 | 2,198 | 88.5 | 11.1 | 0.4 | 0.0 | 77.5 | |
| 8,462 | 104,603 | 57,595 | 22.1 | 49.3 | 27.7 | 0.9 | 65.7 | |
| 6,078 | 2,942 | 938 | 94.5 | 5.4 | 0.2 | 0.0 | 80.8 | |
| 949 | 1,828 | 670 | 97.0 | 3.0 | 0.0 | 0.0 | 77.6 | |
| 497 | 12,280 | 4,637 | 74.0 | 24.6 | 1.4 | 0.0 | 76.5 | |
| 6,621 | 767 | 193 | 99.2 | 0.7 | 0.0 | 0.0 | 85.2 | |
| 6,292 | 503,335 | 173,768 | 13.7 | 23.7 | 54.3 | 8.3 | 74.6 | |
| 7,769 | 53,664 | 24,126 | 21.4 | 67.6 | 10.7 | 0.3 | 66.5 | |
| 255 | 337,787 | 231,462 | 6.0 | 18.0 | 70.7 | 5.3 | 50.9 | |
| 900,443 | 14,252 | 3,194 | 77.2 | 21.1 | 1.7 | 0.1 | 82.3 | |
| 180,782 | 17,693 | 4,693 | 67.2 | 30.8 | 1.9 | 0.1 | 77.7 | |
| 57,987 | 22,249 | 7,621 | 59.1 | 37.1 | 3.7 | 0.1 | 78.6 | |
| 21,247 | 14,506 | 6,378 | 68.3 | 30.1 | 1.6 | 0.1 | 71.0 | |
| 3,619 | 266,153 | 99,028 | 30.8 | 19.7 | 44.5 | 5.0 | 80.0 | |
| 5,626 | 228,268 | 80,315 | 15.8 | 41.2 | 40.1 | 2.9 | 73.4 | |
| 49,746 | 239,244 | 118,885 | 15.5 | 30.1 | 51.4 | 3.0 | 66.5 | |
| 2,041 | 19,893 | 5,976 | 66.7 | 30.3 | 2.9 | 0.1 | 82.0 | |
| 104,953 | 256,596 | 122,980 | 11.0 | 32.6 | 52.9 | 3.5 | 64.4 | |
| 5,866 | 28,316 | 10,842 | 48.3 | 47.1 | 4.5 | 0.2 | 75.9 | |
| 12,226 | 33,463 | 12,029 | 46.3 | 49.3 | 4.2 | 0.2 | 76.4 | |
| 27,473 | 12,313 | 3,683 | 79.6 | 18.8 | 1.5 | 0.1 | 82.2 | |
| 42,490 | 211,369 | 89,671 | 14.8 | 38.3 | 44.4 | 2.5 | 67.6 | |
| 3,146 | 129,890 | 28,698 | 42.8 | 44.0 | 10.7 | 2.5 | 86.5 | |
| 3,927 | 5,816 | 2,238 | 89.7 | 9.8 | 0.5 | 0.0 | 75.7 | |
| 4,288 | 7,379 | 1,610 | 91.6 | 7.0 | 1.3 | 0.0 | 87.9 | |
| 1,477 | 70,454 | 33,884 | 36.0 | 50.5 | 12.7 | 0.8 | 80.9 | |
| 4,548 | 55,007 | 18,159 | 40.6 | 50.5 | 8.4 | 0.5 | 79.7 | |
| 1,243 | 1,226 | 264 | 97.8 | 2.2 | 0.1 | 0.0 | 88.6 | |
| 2,502 | 4,453 | 1,464 | 91.9 | 7.8 | 0.3 | 0.0 | 80.1 | |
| 4,440 | 17,198 | 6,512 | 67.0 | 31.0 | 1.9 | 0.1 | 76.0 | |
| 2,166 | 63,500 | 29,679 | 29.3 | 58.0 | 12.2 | 0.5 | 71.0 | |
| 498 | 477,306 | 259,899 | 13.0 | 19.0 | 59.2 | 8.8 | 67.0 | |
| 13,812 | 1,962 | 666 | 96.9 | 3.0 | 0.1 | 0.0 | 79.3 | |
| 8,887 | 2,045 | 606 | 96.2 | 3.7 | 0.1 | 0.0 | 82.4 | |
| 22,315 | 29,287 | 8,583 | 55.0 | 41.1 | 3.7 | 0.2 | 82.9 | |
| 409 | 25,511 | 8,519 | 56.0 | 39.3 | 4.5 | 0.2 | 79.8 | |
| 8,625 | 2,424 | 869 | 96.0 | 3.9 | 0.1 | 0.0 | 77.6 | |
| 358 | 148,934 | 84,390 | 13.0 | 45.0 | 40.6 | 1.4 | 61.7 | |
| 2,370 | 2,788 | 1,037 | 95.2 | 4.7 | 0.1 | 0.0 | 76.3 | |
| 968 | 63,372 | 27,456 | 31.0 | 56.0 | 12.5 | 0.5 | 72.1 | |
| 711 | 31,106 | 12,183 | 46.0 | 48.6 | 5.2 | 0.2 | 75.8 | |
| 85,136 | 42,689 | 13,752 | 44.7 | 46.9 | 8.1 | 0.3 | 80.5 | |
| 341 | 13,193 | 4,876 | 74.0 | 23.9 | 2.1 | 0.0 | 77.9 | |
| 3,188 | 15,491 | 7,577 | 61.8 | 36.5 | 1.7 | 0.0 | 69.4 | |
| 2,053 | 6,324 | 2,546 | 88.0 | 11.5 | 0.5 | 0.0 | 74.4 | |
| 476 | 60,310 | 30,739 | 29.0 | 57.0 | 13.6 | 0.4 | 68.4 | |
| 24,654 | 13,459 | 3,874 | 78.4 | 19.7 | 1.9 | 0.1 | 81.9 | |
| 14,186 | 1,003 | 345 | 98.9 | 1.0 | 0.1 | 0.0 | 79.1 | |
| 35,734 | 5,025 | 2,458 | 91.7 | 8.0 | 0.3 | 0.0 | 67.0 | |
| 1,375 | 15,294 | 3,677 | 80.5 | 16.4 | 3.0 | 0.1 | 86.6 | |
| 17,887 | 4,056 | 1,437 | 93.3 | 6.3 | 0.3 | 0.0 | 78.1 | |
| 13,462 | 377,092 | 136,105 | 13.6 | 29.4 | 49.3 | 7.7 | 75.3 | |
| 3,600 | 348,198 | 171,624 | 21.2 | 20.0 | 52.5 | 6.3 | 69.9 | |
| 4,107 | 12,239 | 3,694 | 78.2 | 20.5 | 1.3 | 0.1 | 81.0 | |
| 9,739 | 1,287 | 492 | 98.7 | 1.3 | 0.1 | 0.0 | 75.6 | |
| 95,931 | 6,451 | 1,474 | 91.7 | 7.6 | 0.7 | 0.0 | 85.8 | |
| 4,184 | 275,880 | 117,798 | 28.0 | 19.0 | 48.8 | 4.2 | 78.5 | |
| 3,765 | 39,434 | 9,886 | 50.5 | 43.1 | 6.0 | 0.4 | 86.7 | |
| 123,522 | 5,258 | 2,187 | 90.5 | 9.2 | 0.4 | 0.0 | 73.2 | |
| 2,843 | 43,979 | 13,147 | 45.3 | 46.6 | 7.8 | 0.3 | 82.5 | |
| 4,941 | 6,710 | 1,790 | 91.3 | 7.7 | 1.0 | 0.0 | 84.3 | |
| 4,454 | 11,962 | 3,644 | 78.8 | 19.9 | 1.2 | 0.1 | 81.6 | |
| 22,530 | 17,017 | 5,445 | 70.4 | 27.4 | 2.1 | 0.1 | 80.1 | |
| 66,960 | 15,290 | 3,155 | 83.1 | 14.8 | 2.0 | 0.1 | 86.9 | |
| 30,315 | 67,477 | 23,550 | 19.8 | 64.8 | 14.9 | 0.5 | 70.7 | |
| 423 | 37,998 | 14,076 | 44.0 | 49.3 | 6.4 | 0.3 | 77.9 | |
| 8,339 | 142,537 | 61,306 | 23.2 | 45.1 | 30.0 | 1.6 | 70.5 | |
| 2,396 | 146,730 | 83,680 | 12.0 | 45.3 | 41.7 | 1.0 | 58.1 | |
| 15,208 | 50,009 | 23,675 | 32.1 | 58.5 | 9.1 | 0.3 | 70.1 | |
| 111,845 | 27,162 | 5,431 | 72.8 | 23.8 | 3.1 | 0.2 | 87.8 | |
| 6,581 | 4,188 | 1,266 | 92.8 | 6.9 | 0.3 | 0.0 | 81.9 | |
| 104 | 4,029 | 1,702 | 92.4 | 7.3 | 0.2 | 0.0 | 73.1 | |
| 24,186 | 68,697 | 15,495 | 46.4 | 44.4 | 8.2 | 1.0 | 86.7 | |
| 7,975 | 4,702 | 1,570 | 91.4 | 8.3 | 0.3 | 0.0 | 79.7 | |
| 5,480 | 31,705 | 14,954 | 41.7 | 52.9 | 5.3 | 0.1 | 70.6 | |
| 69 | 63,427 | 24,651 | 36.0 | 51.0 | 12.5 | 0.5 | 75.9 | |
| 3,937 | 995 | 370 | 99.0 | 0.9 | 0.0 | 0.0 | 76.7 | |
| 4,887 | 332,995 | 86,717 | 16.2 | 38.6 | 39.7 | 5.5 | 78.3 | |
| 4,346 | 68,059 | 45,853 | 11.6 | 69.8 | 18.4 | 0.2 | 50.3 | |
| 1,672 | 120,173 | 67,961 | 18.0 | 53.0 | 28.2 | 0.8 | 67.1 | |
| 37,590 | 20,308 | 4,523 | 75.8 | 20.2 | 3.9 | 0.2 | 88.0 | |
| 37,798 | 227,122 | 105,831 | 16.7 | 31.6 | 48.6 | 3.0 | 69.2 | |
| 14,732 | 23,832 | 8,802 | 54.3 | 42.0 | 3.7 | 0.1 | 76.8 | |
| 21,941 | 1,014 | 383 | 99.0 | 0.9 | 0.1 | 0.0 | 75.9 | |
| 382 | 5,644 | 1,349 | 91.2 | 8.1 | 0.7 | 0.0 | 87.1 | |
| 7,794 | 336,166 | 89,846 | 34.0 | 18.4 | 40.3 | 7.3 | 87.2 | |
| 6,958 | 673,962 | 146,733 | 11.9 | 33.7 | 49.3 | 11.2 | 78.1 | |
| 10,811 | 2,197 | 807 | 96.3 | 3.6 | 0.1 | 0.0 | 77.2 | |
| 19,633 | 238,862 | 93,044 | 13.9 | 38.6 | 44.4 | 3.1 | 70.8 | |
| 5,227 | 4,390 | 1,844 | 92.4 | 7.3 | 0.3 | 0.0 | 73.1 | |
| 27,744 | 3,647 | 1,433 | 93.7 | 6.1 | 0.2 | 0.0 | 74.5 | |
| 54,054 | 25,292 | 8,036 | 55.5 | 41.9 | 2.5 | 0.2 | 77.1 | |
| 689 | 5,185 | 2,838 | 91.4 | 8.3 | 0.3 | 0.0 | 62.6 | |
| 4,084 | 1,484 | 468 | 98.0 | 2.0 | 0.1 | 0.0 | 81.2 | |
| 1,032 | 44,182 | 15,649 | 42.5 | 49.0 | 8.2 | 0.3 | 78.0 | |
| 8,207 | 17,550 | 6,177 | 67.4 | 30.2 | 2.3 | 0.1 | 77.8 | |
| 57,768 | 27,466 | 8,001 | 57.6 | 38.8 | 3.4 | 0.2 | 81.8 | |
| 3,722 | 20,328 | 9,030 | 54.0 | 43.2 | 2.7 | 0.1 | 70.6 | |
| 19,830 | 1,994 | 646 | 96.6 | 3.3 | 0.1 | 0.0 | 80.4 | |
| 34,639 | 13,104 | 2,529 | 79.1 | 19.5 | 1.3 | 0.1 | 84.4 | |
| 8,053 | 115,476 | 21,613 | 45.1 | 46.0 | 6.8 | 2.1 | 88.8 | |
| 52,568 | 290,754 | 131,522 | 18.0 | 27.8 | 49.5 | 4.7 | 71.7 | |
| 249,969 | 505,421 | 79,274 | 26.3 | 28.5 | 36.4 | 8.8 | 85.0 | |
| 2,530 | 60,914 | 22,088 | 37.0 | 51.3 | 11.2 | 0.4 | 77.2 | |
| 18,359 | 21,040 | 7,341 | 60.5 | 36.8 | 2.5 | 0.1 | 78.1 | |
| 68,565 | 14,075 | 4,559 | 76.3 | 21.9 | 1.8 | 0.1 | 80.2 | |
| 15,281 | 5,581 | 1,223 | 93.0 | 6.2 | 0.8 | 0.0 | 88.0 | |
| 8,331 | 3,068 | 692 | 94.3 | 5.5 | 0.2 | 0.0 | 87.7 | |
| 7,086 | 7,131 | 2,356 | 86.9 | 12.5 | 0.6 | 0.0 | 79.8 | |
In the United States[]
Distribution of net worth in the United States (2007). The net wealth of many people in the lowest 20% is negative because of debt.[18]
According to PolitiFact, in 2011 the 400 wealthiest Americans "have more wealth than half of all Americans combined."[19][20][21][22] Inherited wealth may help explain why many Americans who have become rich may have had a "substantial head start".[23][24] In September 2012, according to the Institute for Policy Studies, "over 60 percent" of the Forbes richest 400 Americans "grew up in substantial privilege".[25]
In 2007, the richest 1% of the American population owned 34.6% of the country's total wealth (excluding human capital),[clarification needed] and the next 19% owned 50.5%. The top 20% of Americans owned 85% of the country's wealth and the bottom 80% of the population owned 15%. From 1922 to 2010, the share of the top 1% varied from 19.7% to 44.2%, the big drop being associated with the drop in the stock market in the late 1970s. Ignoring the period where the stock market was depressed (1976–1980) and the period when the stock market was overvalued (1929), the share of wealth of the richest 1% remained extremely stable, at about a third of the total wealth.[26] Financial inequality was greater than inequality in total wealth, with the top 1% of the population owning 42.7%, the next 19% of Americans owning 50.3%, and the bottom 80% owning 7%.[27] However, after the Great Recession which started in 2007, the share of total wealth owned by the top 1% of the population grew from 34.6% to 37.1%, and that owned by the top 20% of Americans grew from 85% to 87.7%. The Great Recession also caused a drop of 36.1% in median household wealth but a drop of only 11.1% for the top 1%, further widening the gap between the 1% and the 99%.[18][26][27] During the economic expansion between 2002 and 2007, the income of the top 1% grew 10 times faster than the income of the bottom 90%. In this period 66% of total income gains went to the 1%, who in 2007 had a larger share of total income than at any time since 1928.
Dan Ariely and Michael Norton show in a study (2011) that US citizens across the political spectrum significantly underestimate the current US wealth inequality and would prefer a more egalitarian distribution of wealth, raising questions about ideological disputes over issues like taxation and welfare.[28]
According to a 2020 study by the RAND Corporation, $2.5 trillion is redistributed from the bottom 90% of Americans to the wealthiest 1% of Americans every year.[29]
| Year | Bottom 99% |
Top 1% |
|---|---|---|
| 1922 | 63.3% | 36.7% |
| 1929 | 55.8% | 44.2% |
| 1933 | 66.7% | 33.3% |
| 1939 | 63.6% | 36.4% |
| 1945 | 70.2% | 29.8% |
| 1949 | 72.9% | 27.1% |
| 1953 | 68.8% | 31.2% |
| 1962 | 68.2% | 31.8% |
| 1965 | 65.6% | 34.4% |
| 1969 | 68.9% | 31.1% |
| 1972 | 70.9% | 29.1% |
| 1976 | 80.1% | 19.9% |
| 1979 | 79.5% | 20.5% |
| 1981 | 75.2% | 24.8% |
| 1983 | 69.1% | 30.9% |
| 1986 | 68.1% | 31.9% |
| 1989 | 64.3% | 35.7% |
| 1992 | 62.8% | 37.2% |
| 1995 | 61.5% | 38.5% |
| 1998 | 61.9% | 38.1% |
| 2001 | 66.6% | 33.4% |
| 2004 | 65.7% | 34.3% |
| 2007 | 65.4% | 34.6% |
| 2010 | 64.6% | 35.4% |

World distribution of wealth[]

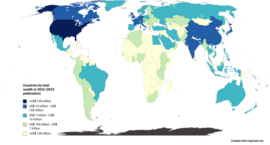
world distribution of wealth by country (PPP)

world distribution of wealth by region (PPP)

world distribution of wealth by country (exchange rates)

world distribution of wealth by region (exchange rates)


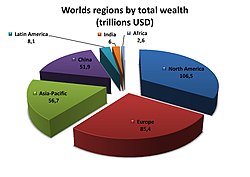
By region[]
| Region | Proportion of world (%)[26][32] | ||||
|---|---|---|---|---|---|
| Population | Net worth | GDP | |||
| PPP | Exchange rates | PPP | Exchange rates | ||
| North America | 5.2 | 27.1 | 34.4 | 23.9 | 33.7 |
| Central/South America | 8.5 | 6.5 | 4.3 | 8.5 | 6.4 |
| Europe | 9.6 | 26.4 | 29.2 | 22.8 | 32.4 |
| Africa | 10.7 | 1.5 | 0.5 | 2.4 | 1.0 |
| Middle East | 9.9 | 5.1 | 3.1 | 5.7 | 4.1 |
| Asia | 52.2 | 29.4 | 25.6 | 31.1 | 24.1 |
| Other | 3.2 | 3.7 | 2.6 | 5.4 | 3.4 |
| Totals (rounded) | 100% | 100% | 100% | 100% | 100% |
World distribution of financial wealth. In 2007, 147 companies controlled nearly 40 percent of the monetary value of all transnational corporations.[33]
Wealth concentration[]
Wealth concentration is a process by which created wealth, under some conditions, can become concentrated by individuals or entities. Those who hold wealth have the means to invest in newly created sources and structures of wealth, or to otherwise leverage the accumulation of wealth, and are thus the beneficiaries of even greater wealth.
Economic conditions[]

The first necessary condition for the phenomenon of wealth concentration to occur is an unequal initial distribution of wealth. The distribution of wealth throughout the population is often closely approximated by a Pareto distribution, with tails which decay as a power-law in wealth. (See also: Distribution of wealth and Economic inequality). According to PolitiFact and others, the 400 wealthiest Americans had "more wealth than half of all Americans combined."[19][20][21][22] Inherited wealth may help explain why many Americans who have become rich may have had a "substantial head start".[23][24] In September 2012, according to the Institute for Policy Studies, "over 60 percent" of the Forbes richest 400 Americans "grew up in substantial privilege".[25]
The second condition is that a small initial inequality must, over time, widen into a larger inequality. This is an example of positive feedback in an economic system. A team from Jagiellonian University produced statistical model economies showing that wealth condensation can occur whether or not total wealth is growing (if it is not, this implies that the poor could become poorer).[34]
Joseph E. Fargione, Clarence Lehman and Stephen Polasky demonstrated in 2011 that chance alone, combined with the deterministic effects of compounding returns, can lead to unlimited concentration of wealth, such that the percentage of all wealth owned by a few entrepreneurs eventually approaches 100%.[35][36]
Correlation between being rich and earning more[]
Given an initial condition in which wealth is unevenly distributed (i.e., a "wealth gap"[37]), several non-exclusive economic mechanisms for wealth condensation have been proposed:
- A correlation between being rich and being given high-paid employment (oligarchy).
- A marginal propensity to consume low enough that high incomes are correlated with people who have already made themselves rich (meritocracy).
- The ability of the rich to influence government disproportionately to their favor thereby increasing their wealth (plutocracy).[38]
In the first case, being wealthy gives one the opportunity to earn more through high paid employment (e.g., by going to elite schools). In the second case, having high paid employment gives one the opportunity to become rich (by saving your money). In the case of plutocracy, the wealthy exert power over the legislative process, which enables them to increase the wealth disparity.[39] An example of this is the high cost of political campaigning in some countries, in particular in the US (more generally, see also plutocratic finance).
Because these mechanisms are non-exclusive, it is possible for all three explanations to work together for a compounding effect, increasing wealth concentration even further. Obstacles to restoring wage growth might have more to do with the broader dysfunction of a dollar dominated system particular to the US than with the role of the extremely wealthy.[40]
Counterbalances to wealth concentration include certain forms of taxation, in particular wealth tax, inheritance tax and progressive taxation of income. However, concentrated wealth does not necessarily inhibit wage growth for ordinary workers.[41]
Markets with social influence[]
Product recommendations and information about past purchases have been shown to influence consumers choices significantly whether it is for music, movie, book, technological, and other type of products. Social influence often induces a rich-get-richer phenomenon (Matthew effect) where popular products tend to become even more popular.[42]
Redistribution of wealth and public policy[]
In many societies, attempts have been made, through property redistribution, taxation, or regulation, to redistribute wealth, sometimes in support of the upper class, and sometimes to diminish economic inequality.
Examples of this practice go back at least to the Roman republic in the third century B.C.,[43] when laws were passed limiting the amount of wealth or land that could be owned by any one family. Motivations for such limitations on wealth include the desire for equality of opportunity, a fear that great wealth leads to political corruption, to the belief that limiting wealth will gain the political favor of a voting bloc, or fear that extreme concentration of wealth results in rebellion.[44] Various forms of socialism attempt to diminish the unequal distribution of wealth and thus the conflicts and social problems arising from it.[45]
During the Age of Reason, Francis Bacon wrote "Above all things good policy is to be used so that the treasures and monies in a state be not gathered into a few hands… Money is like fertilizer, not good except it be spread."[46]
The rise of Communism as a political movement has partially been attributed to the distribution of wealth under capitalism in which a few lived in luxury while the masses lived in extreme poverty or deprivation. However, in the Critique of the Gotha Program, Marx and Engels criticized German Social Democrats for placing emphasis on issues of distribution instead of on production and ownership of productive property.[47] While the ideas of Marx have nominally influenced various states in the 20th century, the Marxist notions of socialism and communism remains elusive.[48][vague]
On the other hand, the combination of labor movements, technology, and social liberalism has diminished extreme poverty in the developed world today, though extremes of wealth and poverty continue in the Third World.[49]
In the Outlook on the Global Agenda 2014 from the World Economic Forum the widening income disparities come second as a worldwide risk.[50][51]
See also[]
- Distribution of wealth in Europe
- Generational accounting
- Gini coefficient
- Economic inequality
- Kinetic exchange models of markets
- List of countries by financial assets per capita
- List of countries by total wealth
- List of countries by wealth
- List of countries by wealth equality
- List of countries by wealth per adult
References[]
- ^ a b "62 people own same as half world – Oxfam | Press releases | Oxfam GB". Oxfam.org.uk. January 18, 2016. Retrieved September 10, 2016.
- ^ Davies, James B.; Sandström, Susanna; Shorrocks, Anthony F.; Wolff, Edward N. "Estimating the World Distribution of Household Wealth" (PDF). Institution/Country: University of Western Ontario, Canada; WIDER-UNU. Retrieved September 10, 2016.
- ^ "Free exchange: The real wealth of nations". The Economist. June 30, 2012. Retrieved July 14, 2012.
- ^ "Inclusive Wealth Report – IHDP". Ihdp.unu.edu. July 9, 2012. Archived from the original on June 30, 2012. Retrieved July 14, 2012.
- ^ "Why it is hard to share the wealth". New Scientist. March 12, 2005. Retrieved March 26, 2012.
- ^ a b c Davies, J.B.; Shorrocks, A.F. (2000). "The distribution of wealth". Handbook of Income Distribution. 1: 605–675. doi:10.1016/S1574-0056(00)80014-7.
- ^ Modigliani, F.; Brumberg, R. (1954). "Utility analysis and the consumption function: an interpretation of cross-section data". Franco Modigliani. 1: 388–436.
- ^ Ando, A.; Modigliani, F. (1963). "The" life cycle" hypothesis of saving: Aggregate implications and tests". The American Economic Review. 53: 55–84.
- ^ a b "Yes, Oxfam, the Richest 1% Have Most of the Wealth. But That Means Less Than You Think". Time. Archived from the original on January 21, 2015.
- ^ a b "Global Wealth Report 2013". credit-suisse.com. Archived from the original on February 14, 2015. Retrieved June 30, 2016.
- ^ "The World Factbook – Central Intelligence Agency". Cia.gov. Archived from the original on July 16, 2017. Retrieved September 10, 2016.
- ^ The World Distribution of Household Wealth. James B. Davies, Susanna Sandstrom, Anthony Shorrocks, and Edward N. Wolff. December 5, 2006.
- ^ The rich really do own the world December 5, 2006
- ^ Deborah Hardoon (16 January 2017). "An economy for the 99%: It's time to build a human economy that benefits everyone, not just the privileged few".
- ^ Aimee Picchi (January 17, 2017). "Meet the 8 men who are wealthier than half the globe". CBS News.
- ^ Kromkowski, "Who owns Baltimore", CSE/HGFA, 2007.
- ^ Source Credit Suisse, Research Institute – Global Wealth Databook 2021
- ^ a b Working Paper No. 589 Recent Trends in Household Wealth in the United States: Rising Debt and the Middle-Class Squeeze – an Update to 2007 by Edward N. Wolff, Levy Economics Institute of Bard College, March 2010
- ^ a b Kertscher, Tom; Borowski, Greg (March 10, 2011). "The Truth-O-Meter Says: True – Michael Moore says 400 Americans have more wealth than half of all Americans combined". PolitiFact. Retrieved August 11, 2013.
- ^ a b Moore, Michael (March 6, 2011). "America Is Not Broke". Huffington Post. Retrieved August 11, 2013.
- ^ a b Moore, Michael (March 7, 2011). "The Forbes 400 vs. Everybody Else". michaelmoore.com. Archived from the original on March 9, 2011. Retrieved August 11, 2013.
- ^ a b Pepitone, Julianne (September 22, 2010). "Forbes 400: The super-rich get richer". CNN. Retrieved August 11, 2013.
- ^ a b Bruenig, Matt (March 24, 2014). "You call this a meritocracy? How rich inheritance is poisoning the American economy". Salon. Retrieved August 24, 2014.
- ^ a b Staff (March 18, 2014). "Inequality – Inherited wealth". The Economist. Retrieved August 24, 2014.
- ^ a b Pizzigati, Sam (September 24, 2012). "The 'Self-Made' Hallucination of America's Rich". Institute for Policy Studies. Retrieved August 24, 2014.
- ^ a b c d Wealth, Income, and Power by G. William Domhoff of the UC-Santa Barbara Sociology Department
- ^ a b Occupy Wall Street And The Rhetoric of Equality Forbes November 1, 2011 by Deborah L. Jacobs
- ^ Norton, M. I., & Ariely, D., "Building a Better America – One Wealth Quintile at a Time", Perspectives on Psychological Science, January 2011 6: 9-12
- ^ "The Top 1% of Americans Have Taken $50 Trillion From the Bottom 90%—And That's Made the U.S. Less Secure". Time. September 14, 2020.
- ^ 1922–1989 data from Wolff (1996), 1992–2010 data from Wolff (2012)
- ^ "Trends in Family Wealth, 1989 to 2013". Congressional Budget Office. August 18, 2016.
- ^ Data for the following table obtained from UNU-WIDER World Distribution of Household Wealth Report (The University of California also hosts a copy of the report)
- ^ Financial world dominated by a few deep pockets. By Rachel Ehrenberg. September 24, 2011; Vol.180 #7 (p. 13). Science News. Citation is in the right sidebar. Paper is here [1] with PDF here [2].
- ^ Burdaa, Z.; et al. (January 22, 2001). "Wealth Condensation in Pareto Macro-Economies" (PDF). Physical Review E. 65 (2): 026102. arXiv:cond-mat/0101068. Bibcode:2002PhRvE..65b6102B. doi:10.1103/PhysRevE.65.026102. PMID 11863582. S2CID 8822002. Retrieved September 11, 2013.
- ^ Joseph E. Fargione et al.: Entrepreneurs, Chance, and the Deterministic Concentration of Wealth.
- ^ Simulation of wealth concentration according to Fargione, Lehman and Polasky
- ^ Rugaber, Christopher S.; Boak, Josh (January 27, 2014). "Wealth gap: A guide to what it is, why it matters". AP News. Retrieved January 27, 2014.
- ^ Batra, Ravi (2007). The New Golden Age: The Coming Revolution against Political Corruption and Economic Chaos. Palgrave Macmillan. ISBN 978-1-4039-7579-9. Retrieved October 21, 2011.
- ^ Channer, Harold Hudson (July 25, 2011). "TV interview with Dr. Ravi Batra". Retrieved October 21, 2011.
- ^ Bessen, James (2015). Learning by Doing: The Real Connection between Innovation, Wages, and Wealth. Yale University Press. pp. 226–27. ISBN 978-0300195668.
The obstacles to restoring wage growth might have more to do with the broader dysfunction of our dollar- dominated political system than with the particular role of the extremely wealthy.
- ^ Bessen, James (2015). Learning by Doing: The Real Connection between Innovation, Wages, and Wealth. Yale University Press. p. 3. ISBN 978-0300195668.
However, concentrated wealth does not necessarily inhibit wage growth.
- ^ Altszyler, E; Berbeglia, F.; Berbeglia, G.; Van Hentenryck, P. (2017). "Transient dynamics in trial-offer markets with social influence: Trade-offs between appeal and quality". PLOS ONE. 12 (7): e0180040. Bibcode:2017PLoSO..1280040A. doi:10.1371/journal.pone.0180040. PMC 5528888. PMID 28746334.
- ^ Livy, Rome and Italy: Books VI-X of the History of Rome from its Foundation, Penguin Classics, ISBN 0-14-044388-6
- ^ "… A perceived sense of inequity is a common ingredient of rebellion in societies …", Amartya Sen, 1973
- ^ "The Spirit Level" by Richard Wilkinson and Kate Pickett;Bloomsbury Press 2009
- ^ Francis Bacon, Of Seditions and Troubles
- ^ Critique of the Gotha Program, Karl Marx. Part I: "Quite apart from the analysis so far given, it was in general a mistake to make a fuss about so-called distribution and put the principal stress on it."
- ^ Archie Brown, The Rise and Fall of Communism, Ecco, 2009, ISBN 978-0-06-113879-9
- ^ Jeffrey D. Sachs, The End of Poverty, Penguin, 2006, ISBN 978-0-14-303658-6
- ^ "Outlook on the Global Agenda 2014 – Reports". Reports.weforum.org. World Economic Forum. Retrieved September 10, 2016.
- ^ "178 Oxfam Briefing Paoer" (PDF). Oxfam.org. January 20, 2014. Retrieved September 10, 2016.
External links[]
- U.N. statistics – Distribution of Income and Consumption; wealth and poverty
- Research on the World Distribution of Household Wealth (UNU-WIDER)
- CIA World Factbook: Field Listing – Distribution of family income – Gini index
- Annual income of richest 100 people enough to end global poverty four times over. Oxfam International, January 19, 2013.
Wealth surveys[]
Many countries have national wealth surveys, for example:
- The British Wealth and Assets Survey
- The Italian Survey on Household Income and Wealth
- The euro area Household Finance and Consumption Survey
- The US Survey of Consumer Finances
- The Canadian Survey of Financial Security
- The German Armuts- und Reichtumsbericht der Bundesregierung
Additional data, charts, and graphs[]
- Wealth, Income, and Power by G. William Domhoff
- PowerPoint presentation: Inequalities of Development – Lorenz curve and Gini coefficient
- Article on The World Distribution of Household Wealth report.
- The Federal Reserve Board – Survey of Consumer Finances
- Survey of Consumer Finances 1998–2004 charts – pdf
- Survey of Consumer Finances 1998–2004 data
and resulting Gini indices for mean incomes: 1989: 51.1, 1992: 47.8, 1995: 49.0, 1998: 50.4, 2001: 52.6, 2004: 51.4 - Changes in the Distribution of Wealth in the U.S., 1989–2001
- Report on Net Worth and Asset Ownership of Households
- Projections of the Number of Households in the U.S. 1995–2010
- The System of National Accounts (SNA): comparison of U.S. national accounts statistics with those of other countries
- World Trade Organization: Resources
- Champagne Glass infographic of global wealth distribution from Dalton Conley's You May Ask Yourself: An Introduction to Thinking Like a Sociologist textbook which was adapted from the 1992 UNDP original
- Distribution of wealth