List of countries by wealth per adult

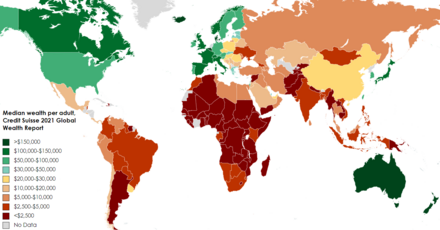
This is a list of countries of the world by wealth per adult from Credit Suisse's annual Global Wealth Databook.[1] Wealth includes both financial and non-financial assets. The list below includes mean and median wealth per adult.
Credit Suisse Global Wealth Databook's list of countries by wealth per adult (USD)
Credit Suisse publishes various statistics relevant for calculating net wealth. These figures are influenced by real estate prices, equity market prices, exchange rates, liabilities, debts, adult percentage of the population, human resources, natural resources and capital and technological advancements, which may create new assets or render others worthless in the future.
During periods of equity market growth, the relative national and per capita wealth of countries where people are more exposed to those markets, such as the United States and the United Kingdom, tends to rise. But when equity markets are down, the relative wealth of countries where people invest more in real estate or bonds, such as France and Italy, tends to rise instead. Countries with older populations, like Germany and Italy, would have higher relative wealth, if calculated per capita and not per adult.
Mean wealth is the amount obtained by dividing the total aggregate wealth by the number of adults. Median wealth is the amount that divides the population into two equal groups: half the adults have wealth above the median, and the other half below. In nations where wealth is highly concentrated in a small percentage of people, the mean can be much higher than the median (e.g. the United States). To see this, click on the header of the median wealth column and put it in descending order.
By region
* indicates "Wealth in COUNTRY" or "Economy of COUNTRY" links.
| Region | Median | Mean | Adults | Total Wealth |
|---|---|---|---|---|
| Northern America |
82,539 | 486,930 | 279,950,000 | 136,316,000 |
| Europe | 26,423 | 174,836 | 590,343,000 | 103,213,000 |
| 25,067 | 67,771 | 1,104,956,000 | 74,884,000 | |
| World | 7,522 | 79,952 | 5,232,383,000 | 418,342,000 |
| Asia-Pacific (excl. China and India) |
4,793 | 60,790 | 1,238,316,000 | 75,277,000 |
| Latin America | 4,466 | 24,301 | 447,376,000 | 10,872,000 |
| 3,194 | 14,252 | 900,443,000 | 12,833,000 | |
| Africa | 1,068 | 7,371 | 671,000,000 | 4,946,000 |
By country
Gini: Higher Gini coefficients signify greater inequality in wealth distribution, with 0 being complete equality, whereas a value near 100% can arise in a situation where everybody has zero wealth except a very small minority.
* indicates "Wealth in COUNTRY or AREA" or "Economy of COUNTRY or AREA" links.
| Country, region, or subnational area | Median | Mean | Gini % |
Adults |
|---|---|---|---|---|
| 259,899 | 477,306 | 67.0 | 498,000 | |
| 238,072 | 483,755 | 65.6 | 19,159,000 | |
| 231,462 | 337,787 | 50.9 | 255,000 | |
| 230,548 | 351,327 | 60.3 | 8,993,000 | |
| 173,768 | 503,335 | 74.6 | 6,292,000 | |
| 171,624 | 348,198 | 69.9 | 3,600,000 | |
| 165,622 | 376,069 | 73.6 | 4,557,000 | |
| 146,733 | 673,962 | 78.1 | 6,958,000 | |
| 136,105 | 377,092 | 75.3 | 13,462,000 | |
| 133,559 | 299,355 | 70.0 | 49,967,000 | |
| 131,522 | 290,754 | 71.7 | 52,568,000 | |
| 125,688 | 332,323 | 71.9 | 29,934,000 | |
| 122,980 | 256,596 | 64.4 | 104,953,000 | |
| 118,885 | 239,244 | 66.5 | 49,746,000 | |
| 117,798 | 275,880 | 78.5 | 4,184,000 | |
| 105,831 | 227,122 | 69.2 | 37,798,000 | |
| 99,028 | 266,153 | 80.0 | 3,619,000 | |
| 93,044 | 238,862 | 70.8 | 19,633,000 | |
| 91,833 | 290,348 | 73.5 | 7,271,000 | |
| 89,846 | 336,166 | 87.2 | 7,794,000 | |
| 89,671 | 211,369 | 67.6 | 42,490,000 | |
| 86,717 | 332,995 | 78.3 | 4,887,000 | |
| 84,390 | 148,934 | 61.7 | 358,000 | |
| 83,680 | 146,730 | 58.1 | 2,396,000 | |
| 80,315 | 228,268 | 73.4 | 5,626,000 | |
| 79,274 | 505,421 | 85.0 | 249,969,000 | |
| 73,775 | 167,711 | 74.0 | 4,373,000 | |
| 67,961 | 120,173 | 67.1 | 1,672,000 | |
| 65,374 | 268,681 | 77.9 | 68,015,000 | |
| 61,306 | 142,537 | 70.5 | 8,339,000 | |
| 57,595 | 104,603 | 65.7 | 8,462,000 | |
| 45,853 | 68,059 | 50.3 | 4,346,000 | |
| 38,901 | 77,817 | 73.8 | 1,044,000 | |
| 35,300 | 142,304 | 80.7 | 679,000 | |
| 34,945 | 69,140 | 68.5 | 3,303,000 | |
| 33,884 | 70,454 | 80.9 | 1,477,000 | |
| 30,739 | 60,310 | 68.4 | 476,000 | |
| 29,679 | 63,500 | 71.0 | 2,166,000 | |
| 28,698 | 129,890 | 86.5 | 3,146,000 | |
| 27,456 | 63,372 | 72.1 | 968,000 | |
| 24,651 | 63,427 | 75.9 | 69,000 | |
| 24,126 | 53,664 | 66.5 | 7,769,000 | |
| 24,067 | 67,771 | 70.4 | 1,104,956,000 | |
| 23,794 | 78,103 | 77.7 | 8,528,000 | |
| 23,740 | 68,443 | 73.8 | 631,000 | |
| 23,675 | 50,009 | 70.1 | 15,208,000 | |
| 23,550 | 67,477 | 70.7 | 30,315,000 | |
| 22,088 | 60,914 | 77.2 | 2,530,000 | |
| 21,613 | 115,476 | 88.8 | 8,053,000 | |
| 21,071 | 63,261 | 80.4 | 221,000 | |
| 18,159 | 55,007 | 79.7 | 4,548,000 | |
| 17,747 | 53,591 | 79.7 | 14,259,000 | |
| 17,403 | 36,443 | 70.1 | 5,586,000 | |
| 16,810 | 40,909 | 69.1 | 258,000 | |
| 15,649 | 44,182 | 78.0 | 1,032,000 | |
| 15,495 | 68,697 | 86.7 | 24,186,000 | |
| 15,363 | 30,524 | 68.2 | 2,187,000 | |
| 15,283 | 30,597 | 68.6 | 2,637,000 | |
| 14,954 | 31,705 | 70.6 | 5,480,000 | |
| 14,684 | 45,109 | 80.8 | 567,000 | |
| 14,662 | 44,337 | 79.9 | 3,696,000 | |
| 14,520 | 87,559 | 88.9 | 1,318,000 | |
| 14,076 | 37,998 | 77.9 | 423,000 | |
| 13,752 | 42,689 | 80.5 | 85,136,000 | |
| 13,147 | 43,979 | 82.5 | 2,843,000 | |
| 12,183 | 31,106 | 75.8 | 711,000 | |
| 12,168 | 23,278 | 66.7 | 7,367,000 | |
| 12,029 | 33,463 | 76.4 | 12,226,000 | |
| 11,372 | 34,003 | 79.1 | 4,201,000 | |
| 10,842 | 28,316 | 75.9 | 5,866,000 | |
| 9,886 | 39,434 | 86.7 | 3,765,000 | |
| 9,411 | 22,573 | 73.0 | 2,176,000 | |
| 9,030 | 20,328 | 70.6 | 3,722,000 | |
| 8,802 | 23,832 | 76.8 | 14,732,000 | |
| 8,583 | 29,287 | 82.9 | 22,315,000 | |
| 8,519 | 25,511 | 79.8 | 409,000 | |
| 8,036 | 25,292 | 77.1 | 54,054,000 | |
| 8,001 | 27,466 | 81.8 | 57,768,000 | |
| 7,621 | 22,249 | 78.6 | 57,987,000 | |
| 7,577 | 15,491 | 69.4 | 3,188,000 | |
| 7,507 | 56,737 | 91.4 | 278,000 | |
| 7,341 | 21,040 | 78.1 | 18,359,000 | |
| 6,512 | 17,198 | 76.0 | 4,440,000 | |
| 6,378 | 14,506 | 71.0 | 21,247,000 | |
| 6,329 | 19,468 | 79.2 | 59,547,000 | |
| 6,177 | 17,550 | 77.8 | 8,207,000 | |
| 5,976 | 19,893 | 82.0 | 2,041,000 | |
| 5,764 | 15,708 | 77.4 | 564,000 | |
| 5,445 | 17,017 | 80.1 | 22,530,000 | |
| 5,444 | 17,151 | 80.8 | 11,361,000 | |
| 5,431 | 27,162 | 87.8 | 111,845,000 | |
| 5,122 | 39,098 | 91.6 | 309,000 | |
| 5,022 | 11,926 | 72.7 | 7,155,000 | |
| 4,876 | 13,193 | 77.9 | 341,000 | |
| 4,854 | 16,928 | 82.7 | 35,612,000 | |
| 4,693 | 17,693 | 77.7 | 180,782,000 | |
| 4,685 | 13,696 | 79.3 | 1,216,000 | |
| 4,637 | 12,280 | 76.5 | 497,000 | |
| 4,561 | 18,246 | 86.3 | 776,000 | |
| 4,559 | 14,075 | 80.2 | 68,565,000 | |
| 4,523 | 20,308 | 88.0 | 37,590,000 | |
| 4,223 | 14,162 | 81.3 | 2,959,000 | |
| 3,874 | 13,459 | 81.9 | 24,654,000 | |
| 3,804 | 12,286 | 81.0 | 7,088,000 | |
| 3,694 | 12,239 | 81.0 | 4,107,000 | |
| 3,683 | 12,313 | 82.2 | 27,473,000 | |
| 3,680 | 15,598 | 87.3 | 1,358,000 | |
| 3,677 | 15,294 | 86.6 | 1,375,000 | |
| 3,644 | 11,962 | 81.6 | 4,454,000 | |
| 3,469 | 18,272 | 89.0 | 153,307,000 | |
| 3,194 | 14,252 | 82.3 | 900,443,000 | |
| 3,155 | 15,290 | 86.9 | 66,960,000 | |
| 3,062 | 7,837 | 75.2 | 106,060,000 | |
| 3,015 | 10,364 | 83.4 | 245,000 | |
| 2,838 | 5,185 | 62.6 | 689,000 | |
| 2,546 | 6,324 | 74.4 | 2,053,000 | |
| 2,529 | 13,104 | 84.4 | 34,639,000 | |
| 2,458 | 5,025 | 67.0 | 35,734,000 | |
| 2,356 | 7,131 | 79.8 | 7,086,000 | |
| 2,302 | 8,871 | 84.8 | 27,620,000 | |
| 2,238 | 5,816 | 75.7 | 3,927,000 | |
| 2,198 | 6,132 | 77.5 | 16,617,000 | |
| 2,187 | 5,258 | 73.2 | 123,522,000 | |
| 2,157 | 7,224 | 81.2 | 30,799,000 | |
| 2,031 | 5,895 | 78.7 | 10,180,000 | |
| 1,844 | 4,390 | 73.1 | 5,227,000 | |
| 1,790 | 6,710 | 84.3 | 4,941,000 | |
| 1,702 | 4,029 | 73.1 | 104,000 | |
| 1,610 | 7,379 | 87.9 | 4,288,000 | |
| 1,570 | 4,702 | 79.7 | 7,975,000 | |
| 1,527 | 3,540 | 71.1 | 57,104,000 | |
| 1,474 | 6,451 | 85.8 | 95,931,000 | |
| 1,466 | 5,397 | 84.8 | 447,000 | |
| 1,464 | 4,453 | 80.1 | 2,502,000 | |
| 1,437 | 4,056 | 78.1 | 17,887,000 | |
| 1,433 | 3,647 | 74.5 | 27,744,000 | |
| 1,349 | 5,644 | 87.1 | 382,000 | |
| 1,266 | 4,188 | 81.9 | 6,581,000 | |
| 1,223 | 5,581 | 88.0 | 15,281,000 | |
| 1,131 | 3,529 | 80.6 | 14,339,000 | |
| 1,086 | 2,846 | 75.7 | 1,728,000 | |
| 1,077 | 3,112 | 78.8 | 618,000 | |
| 1,037 | 2,788 | 76.3 | 2,370,000 | |
| 941 | 3,042 | 81.6 | 12,716,000 | |
| 938 | 2,942 | 80.8 | 6,078,000 | |
| 890 | 2,558 | 78.2 | 5,839,000 | |
| 869 | 2,424 | 77.6 | 8,625,000 | |
| 807 | 2,197 | 77.2 | 10,811,000 | |
| 734 | 1,744 | 72.8 | 18,356,000 | |
| 692 | 3,068 | 87.7 | 8,331,000 | |
| 670 | 1,828 | 77.6 | 949,000 | |
| 666 | 1,962 | 79.3 | 13,812,000 | |
| 658 | 2,500 | 84.9 | 1,115,000 | |
| 646 | 1,994 | 80.4 | 19,830,000 | |
| 622 | 1,681 | 76.8 | 9,480,000 | |
| 606 | 2,045 | 82.4 | 8,887,000 | |
| 582 | 2,180 | 84.7 | 2,707,000 | |
| 492 | 1,287 | 75.6 | 9,739,000 | |
| 468 | 1,484 | 81.2 | 4,084,000 | |
| 383 | 1,014 | 75.9 | 21,941,000 | |
| 370 | 995 | 76.7 | 3,937,000 | |
| 356 | 1,240 | 83.2 | 39,740,000 | |
| 355 | 1,117 | 80.6 | 7,059,000 | |
| 345 | 1,003 | 79.1 | 14,186,000 | |
| 281 | 728 | 75.1 | 5,381,000 | |
| 264 | 1,226 | 88.6 | 1,243,000 | |
| 212 | 840 | 85.9 | 2,161,000 | |
| 193 | 767 | 85.2 | 6,621,000 |
More countries. Rough estimates
For several countries, Credit Suisse could only provide rough estimates of mean wealth, with no information about the distribution of said wealth, citing poor data quality.[1]
* indicates "Income in COUNTRY or TERRITORY" or "Economy of COUNTRY or TERRITORY" links.
| Country or subnational area | Subregion | Mean |
|---|---|---|
| Western Europe | 998,694 | |
| Western Europe | 919,820 | |
| Southern Europe | 273,862 | |
| Eastern Asia | 271,679 | |
| Northern America | 207,714 | |
| Southern Europe | 196,188 | |
| Eastern Africa | 92,198 | |
| Caribbean | 78,695 | |
| Eastern Africa | 54,851 | |
| South America | 52,342 | |
| Southern Europe | 51,788 | |
| Eastern Europe | 46,087 | |
| Central America | 30,586 | |
| Caribbean | 22,701 | |
| Southern Asia | 18,875 | |
| Caribbean | 16,999 | |
| Central America | 15,380 | |
| Southern Africa | 13,834 | |
| Central Asia | 7,821 | |
| Western Africa | 6,621 | |
| Western Africa | 6,171 | |
| Eastern Asia | 5,291 | |
| Eastern Africa | 2,677 | |
| Eastern Africa | 573 |
See also
- Wealth distribution by country
- Wealth distribution in Europe
- Financial and social rankings of sovereign states in Europe
- High-net-worth individual
- List of countries by financial assets per capita
- List of countries by GDP (PPP) per capita
- List of countries by GNI (nominal) per capita
- List of countries by income equality
- List of countries by total wealth
- National wealth
- Ultra high-net-worth individual
- Wealth inequality in the United States
- Wealth
References
- ^ a b c d e "Global Wealth Databook 2021" (PDF). Credit Suisse. Archived (PDF) from the original on June 23, 2021. Retrieved June 24, 2021. See table 3-1 for all countries, on pages 115-118, for mean and median wealth, Gini coefficient, and number of adults. All of that info (except the Gini coefficient) is also in table 2-2 on pages 105-108. See the end of table 2-2 on page 108 for regional numbers. Page 5 mentions "26 countries for which it is difficult to estimate either the level of household wealth or the distribution of wealth, or both". Pages 21-24 then feature estimates for mean wealth per adult for said countries, with wealth data quality characterized as "poor" or "n.a.".
External links
| Wikimedia Commons has media related to Wealth statistics. |
- Where is the Wealth of Nations, World Bank 2006
- Animated Chart: Which Countries Have the Most Wealth Per Capita?
Economic classification of countries | |||||
|---|---|---|---|---|---|
| |||||
| Three-World Model |
| ||||
| Gross domestic product (GDP) |
| ||||
| Gross national income (GNI) |
| ||||
| Wages |
| ||||
| Wealth | |||||
| Other national accounts | |||||
| Human development |
| ||||
| Digital divide |
| ||||
| Net international investment position (NIIP) | |||||
- Lists of countries by per capita values