Factor market
| Part of a series on |
| Economics |
|---|
|
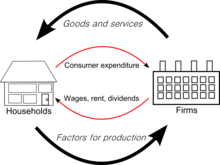
In economics, a factor market is a market where factors of production are bought and sold. Factor market allocates factors of production, including land, labour and capital, and distribute income to the owners of productive resources, such as wages, rents, etc.[1]
Firms buy productive resources in return for making factor payments at factor prices. The interaction between product and factor markets involves the principle of derived demand. A firm’s factors of production are gotten from its economic activities of supplying goods or services to another market.[2] Derived demand refers to the demand for productive resources, which is derived from the demand for final goods and services or output. For example, if consumer demand for new cars rises, producers will respond by increasing their demand for the productive inputs or resources used to produce new cars.
Production is the transformation of inputs into final products.[3] Firms obtain the inputs (factors of production) in the factor markets. The goods are sold in the products markets. In most respects these markets work in the same manner as each other. Price is determined by the interaction of supply and demand; firms attempt to maximize profits, and factors can influence and change the equilibrium price and quantities bought and sold, and the laws of supply and demand hold. In the product market, profit or cost is defined as a function of output. The equilibrium condition is that MR=MC, i.e. the marginal equality of benefits and costs. Since the goods produced are made up of factors, output is seen as a function of factor in factor markets.[4]
In perfectly competitive markets firms can "purchase" as many inputs as they need at the market rate. Because labor is the most important factor of production, this article will focus on the competitive labor market, although the analysis applies to all competitive factor markets. Labour markets are not quite the same as most other markets in the economy since the demand of labour is considered as a derived demand. It is important to note that as the number of workers increases, the marginal product of labour decreases, which implies that the process of output expresses diminishing marginal product. Each additional worker contributes less and less to output as the number of workers employed increases.[5]
The existence of factor markets for the allocation of the factors of production, particularly for capital goods, is one of the defining characteristics of a market economy. Traditional models of socialism were characterized by the replacement of factor markets with some kind of economic planning, under the assumption that market exchanges would be made redundant within the production process if capital goods were owned by a single entity representing society.[6]
Competitive factor markets[]
Assume the structure of both the product and factor markets are perfectly competitive. In both markets firms are price-takers. The price is set at the market level through the interaction of supply and demand. The firms can sell as much of the product as they want at the set price since they are price-takers.
Resource demand[]
The buyers in the factor markets are the firms that produce the final goods for the products markets. Each firm must decide how much labor to hire to maximize its profits. The decision is made through marginal analysis. The firm will hire a worker if the marginal benefits exceed the marginal costs.[7] The marginal benefit is the marginal revenue product of labor or MRPL. The MRPL is the marginal product of labor (MPL) times marginal revenue (MR) or, in a perfectly competitive market structure, simply the MPL times price.[8] The marginal revenue product of labor is the "amount for which [the manager] can sell the extra output [from adding another worker]".[9] The marginal costs are the wage rate.[10] The firm will continue to hire additional units of labor as long as MRPL > wage rate and will stop at the point at which MRPL = the wage rate.[11] Following this rule the firm is maximizing profits since MRPL = marginal product of labor (MCL) is equivalent to the profit maximization rule of MR = MC.[12]
Determinants of resource demand[]
The demand for inputs is a derived demand.[13] That is, the demand is determined by or originates from the demand for the product the inputs are used to produce.[14][15]
The labor market demand curve is the MRPL curve. The curve shows the relationship between the quantity demanded and the wage rate holding the marginal product of labor and the output price constant. The units of labor are on the horizontal axis and the price of labor, w (the wage rate) on the vertical axis. The price of labor and the quantity of labor demanded are inversely related. If the price of labor goes up the quantity of labor demanded goes down.[16] This change is reflected in a movement along the demand curve.[note 1] The curve will shift if either of its components MPL or MR change. Factors that can affect a shift of the curve are changes in (1) the price of the final product or output price (2) the productivity of the resource (3) the number of buyers of the resource and (4) the price of related resources.
- Changes in the output price - The MRPL is the MPL × the output price thus if the price of the output increases due to an increase in demand for the product the value of the marginal product of labor increases at every price and the resource demand curve shifts out.[17] For example, if the price of the output increases firms will react by producing more to meet the demand and that will cause the demand for the inputs to increase.
- Changes in productivity - Productivity changes affect the resource demand in several ways.[18] Technological changes increase the marginal product of labor which makes labor more valuable and causes the demand curve to shift out. The quantity of other resources can affect productivity. The more machines labor has to work with the greater the marginal product of labor which will cause the resource demand curve to shift out. The quality of the resource is an important factor in determining the value of labor as a resource. For example, a highly educated and experienced labor force is generally more productive. Conversely, technological changes also could lead to the reduction of the demand of labour.[19] The invention of cheap industrial robots, for example, may reduce the marginal production of labour, shifting the labour demand curve to the left. This phenomenon is known as labour-saving technological change. However, technological improvement is still primarily labour-augmenting.
- Changes in the number of buyers of the resource - As with any market, additional buyers will cause the demand curve to shift out.[20]
- Changes in the price of related resources - Related resources include complementary and substitute resources. A change in the price of a related resource will affect the demand for labor. For example, automobiles can be assembled with varying combinations of labor and machinery. If the price of machinery falls firms will tend to substitute machines for labor and the demand for labor will fall. If labor and machinery are used as complementary resources and the price of machinery falls then more machinery will be bought and more workers will be needed to run the new machines, causing the labor demand curve to shift out.
Price elasticity of resource demand (PERD)[]
As with the product market, a manager must not only know the direction of a change in demand but the magnitude of the change. That is, the manager must know how much to alter a resource's use if its price changes.
- Determinants of PERD
The price elasticity of resource demand is the percentage change in the demand for a resource in response to a 1% change in the price of the resource. PERD for a resource depends on:
- The PED of the product that the input is used to produce - The higher the PED for the product, the higher the PERD for the resource.[21] Coca-Cola has a relatively high PED. If the price of Coca-Cola rises, this will induce a substantial decline in the quantity of Coca-Cola demanded. The decline in quantity demanded for Coca-Cola will reduce the demand for all inputs used in the production of Coke.
- The importance of factor in production process[22] - The more important the factor, the less elastic is the PERD.[23]
- The number of substitutes for the resource - The more substitutes, the higher the PERD.[24]
- The time period - Time to discover other resources. The more time to adjust the higher the PERD.[25]
- The rate of decline of the MPP of the factor = The more rapidly the MPP declines, the more elastic the demand for the factor.[26]
Resource supply[]
Resources are supplied to the market by resource owners. The market supply curve is the summation of individual supply curves. The resource supply curve is similar to the products supply curve. The market supply curve is the summation of individual supply curves and is upward sloping. It shows the relationship between the resource price and the quantity of the resource that resource providers are willing to sell and able to sell.
The price paid for any factor of production is equal to the marginal production of that factor. The marginal production of any factor depends on the amount of that factor that is available. Due to diminishing marginal production, the marginal production of a factor that is in abundant supply is low, and hence the price is low, while the marginal production of a factor that is in scarce supply is high, and hence the price is high. Thus, when the supply of a factor decreases, its equilibrium price rises.[27]
Factors that will cause a shift in the factor supply curve include changes in tastes, number of suppliers and the prices of related resources. Factors that cause a shift in the labour supply curve include changes in preferences, availability of alternative opportunities and migration.[28]
- Changes in preferences - More women choose to work rather than stay at home to look after their children, increasing the supply of labour.
- Availability of alternative opportunities – The supply of labour depends on the opportunities available in other labour markets.
- Migration – Another important source of shrifts in the supply curve of labour lies in the movement of workers from on region/country to another.
Price elasticity of resource supply[]
The price elasticity of resource supply (PERS) equals the percentage change in the quantity of resource supplied induced by a percent change in price of the resource.
Monopolist factor demand[]
If the producer of a good is a monopoly, the factor demand curve is also the MRPL curve. The curve is downward sloping because both the marginal product of labor and marginal revenue fall as output increases. This contrasts with a competitive firm, for which marginal revenue is constant and the downward slope is due solely to the decreasing marginal product of labor. Therefore, the MRPL curve for a monopoly lies below the MRPL for a competitive firm. The implications are that a monopoly or any firm operating under imperfect market conditions will produce less and hire less labor than a perfectly competitive firm at a given price.
Monopsony and oligopsony[]
If the firm is the only buyer in a particular factor market, then it is a monopsonist. In this situation it sets the market price it will pay for the factor rather than taking it as market-determined, and the amount of the factor to purchase is chosen at the same time subject to the constraint that the price-and-quantity combination is a point on the market's factor supply curve. If the firm is one of several purchasers, then it is instead an .
See also[]
- Product markets
- Capital markets
- Market economy
Notes[]
- ^ Note that if the wage rate falls and all the firms in the industry hire more labor then output will increase which will cause the product market supply curve to shift out reducing the price of the product. Because the price of the product is a component of the MRPL then the factor demand curve will shift in. Therefore a simple summation of individual firm's demand curves to obtain a market demand curve works only if we assume that prices remain unchanged.
References[]
- ^ Rose and Marquis (2006). Money and capital markets. Boston: McGraw-Hill. p. 4.
- ^ Mankiw, N. Gregory (2015). Principles of economics. Cengage Learning. p. 374. ISBN 128516587X.
- ^ Boyes and Melvin (2002) p.
- ^ Samuelson & Nordhaus (2010). Economics 19th ed. McGraw-Hill. p. 29. ISBN 0073511293.
- ^ Mankiw (2015). Principles of economics. Cengage Learning. p. 376. ISBN 128516587X.
- ^ Steele, David Ramsay (September 1999). From Marx to Mises: Post Capitalist Society and the Challenge of Economic Calculation. Open Court. pp. 175–177. ISBN 978-0875484495.
Especially before the 1930s, many socialists and anti-socialists implicitly accepted some form of the following for the incompatibility of state-owned industry and factor markets. A market transaction is an exchange of property titles between two independent transactors. Thus internal market exchanges cease when all of industry is brought into the ownership of a single entity, whether the state or some other organization...the discussion applies equally to any form of social or community ownership, where the owning entity is conceived as a single organization or administration.
- ^ Boyes and Melvin (2002) p. 337.
- ^ Perloff (2009) p. 512.
- ^ Frank p. 460.
- ^ Frank (2008) p. 460.
- ^ Frank (2008) p. 460.
- ^ Perloff p. 514.
- ^ Negbenebor p.365.
- ^ Mankiw (2007) p. 379.
- ^ Colander (2005) p.376.
- ^ Colander p. 373.
- ^ Boyes and Melvin (2002) p. 333.
- ^ Mankiw (2007) p. 399-400.
- ^ Mankiw (2015). Principles of economics. . p. 379. ISBN 128516587X.
- ^ Boyes and Melvin (2002) p. 333.
- ^ Boyes and Melvin (2002) p. 331.
- ^ Colander (2005) p. 376.
- ^ Boyes and Melvin (2002) p. 332.
- ^ Boyes and Melvin (2002) p. 332.
- ^ Boyes and Melvin (2002) p. 332.
- ^ Willis p. 366.
- ^ Mankiw (2015). Principles of economics. Cengage Learning. pp. 388–389. ISBN 128516587X.
- ^ Mankiw (2015). Principles of economics. Cengage Learning. p. 381. ISBN 128516587X.
- Boyes, W. and Melvin. M. (2002) Microeconomics 5th ed. Houghton.
- Colander, David C. 2005 Microeconomics 7th ed. McGraw-Hill
- Frank, R., Microeconomics and Behavior 7th ed. (Mc-Graw-Hill) ISBN 978-0-07-126349-8.
- Mankiw, G. (2007) Principles of Microeconomics 4th ed. Thomson.
- Negbennebor, A: Microeconomics, The Freedom to Choose CAT 2001 ISBN 1-56226-485-0
- Perloff, J. (2009) Microeconomics 5th ed. Pearson.
- Pindyck, R & Rubinfeld, D: (2001) Microeconomics 5th ed. Page Prentice-Hall. ISBN 0-13-019673-8
- Samuelson, P. & Nordhaus, W.: Microeconomics, 17th ed. 2001 McGraw-Hill ISBN 0-07-231490-7
- Willis,J. Explorations in Microeconomics, 5th rd. 2002 North West.
External links[]
 Media related to Factor market at Wikimedia Commons
| show Authority control |
|---|
- Factors of production