Forest of Dean (UK Parliament constituency)
| Forest of Dean | |
|---|---|
| County constituency for the House of Commons | |
 Boundary of Forest of Dean in Gloucestershire for the 2010 general election | |
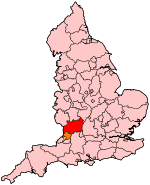 Location of Gloucestershire within England | |
| County | Gloucestershire |
| Electorate | 68,703 (December 2010)[1] |
| Current constituency | |
| Created | 1997 |
| Member of Parliament | Mark Harper (Conservative) |
| Number of members | One |
| Created from | West Gloucestershire |
| 1885–1950 | |
| Number of members | One |
| Replaced by | West Gloucestershire |
Forest of Dean is a parliamentary constituency[n 1] represented in the House of Commons of the UK Parliament since 2005 by Mark Harper, a Conservative.[n 2]
Boundaries[]

1885–1918: The Sessional Divisions of Coleford, Lydney, Newent, and Newnham.
1918–1950: The Urban Districts of Awre, Coleford, Newnham, and Westbury-on-Severn, the Rural Districts of East Dean and United Parishes, Lydney, Newent, and West Dean, and part of the Rural District of Gloucester.
1997–2010: The District of Forest of Dean, and the Borough of Tewkesbury wards of Haw Bridge and Highnam.
2010–present: The District of Forest of Dean, and the Borough of Tewkesbury ward of Highnam with Haw Bridge. The constituency boundaries remained unchanged.
History[]
This seat was created for the 1885 general election (replacing the two-seat constituency of West Gloucestershire under the Redistribution of Seats Act 1885), was redrawn for the 1918 general election, and abolished for the 1950 general election. It was re-created, with different boundaries, for the 1997 general election, and has thus far not undergone any boundary changes.
Constituency profile[]
The Forest of Dean constituency covers Gloucestershire west of the river Severn, and lies in the south west of England, near the Welsh border.
The core of the constituency consists of the Royal Forest of Dean itself, which was established by William the Conqueror nearly a thousand years ago and is one of the last surviving Royal Forests in England.[2] The seat has a rich industrial and mining history, evidenced by the market towns of Coleford and Cinderford, and the old port of Lydney from where coal mined in the Forest of Dean Coalfield would start its journey to all parts of the world.[3]
The Wye Valley forms the western border of the Forest and is an area of outstanding natural beauty, whilst the Leadon Valley forms the northern portion of the constituency. The Vale consists of countryside and farmland centred on the Tudor town of Newent, and also produces English wine.
The constituency also includes parishes from Tewkesbury district, including Forthampton, Chaceley Hole, Hasfield, Ashleworth and Highnam.
Members of Parliament[]
MPs 1885–1950[]
| Election | Member[4] | Party | |
|---|---|---|---|
| 1885 | Thomas Blake | Liberal | |
| 1887 | Godfrey Samuelson | Liberal | |
| 1892 | Sir Charles Dilke | Liberal | |
| 1911 | Sir Henry Webb | Liberal | |
| 1918 | James Wignall | Labour | |
| 1925 | A. A. Purcell | Labour | |
| 1929 | David Vaughan | Labour | |
| 1931 | John Worthington | National Labour | |
| 1935 | M. Philips Price | Labour | |
| 1950 | constituency abolished | ||
MPs since 1997[]
| Election | Member[4] | Party | |
|---|---|---|---|
| 1997 | Diana Organ | Labour | |
| 2005 | Mark Harper | Conservative | |
Elections[]
Elections in the 2010s[]
| Party | Candidate | Votes | % | ±% | |
|---|---|---|---|---|---|
| Conservative | Mark Harper | 30,680 | 59.6 | +5.3 | |
| Labour Co-op | Di Martin | 14,811 | 28.8 | -7.1 | |
| Green | Chris McFarling | 4,681 | 9.1 | +6.7 | |
| Independent | Julian Burrett | 1,303 | 2.5 | +1.4 | |
| Majority | 15,869 | 30.7 | +12.3 | ||
| Turnout | 51,703 | 72.4 | -0.6 | ||
| Registered electors | 71,438 | +0.7 | |||
| Conservative hold | Swing | +6.2 | |||
| Party | Candidate | Votes | % | ±% | |
|---|---|---|---|---|---|
| Conservative | Mark Harper | 28,096 | 54.3 | +7.5 | |
| Labour | Shaun Stammers | 18,594 | 35.9 | +11.3 | |
| Liberal Democrats | Janet Ellard | 2,029 | 3.9 | −1.4 | |
| Green | James Greenwood | 1,241 | 2.4 | −3.1 | |
| UKIP | Ernie Warrender | 1,237 | 2.4 | −15.4 | |
| Independent | Julian Burrett | 570 | 1.1 | N/A | |
| Majority | 9,502 | 18.4 | −3.8 | ||
| Turnout | 51,767 | 73.0 | +2.1 | ||
| Registered electors | 70,898 | +3.6 | |||
| Conservative hold | Swing | −1.9 | |||
| Party | Candidate | Votes | % | ±% | |
|---|---|---|---|---|---|
| Conservative | Mark Harper[9] | 23,191 | 46.8 | 0.0 | |
| Labour | Steve Parry-Hearn[9] | 12,204 | 24.6 | +0.5 | |
| UKIP | Steve Stanbury | 8,792 | 17.8 | +12.6 | |
| Green | James Greenwood | 2,703 | 5.5 | +3.6 | |
| Liberal Democrats | Christopher Coleman | 2,630 | 5.3 | −16.6 | |
| Majority | 10,987 | 22.2 | −0.5 | ||
| Turnout | 49,520 | 70.9 | −0.4 | ||
| Registered electors | 69,865 | +2.1 | |||
| Conservative hold | Swing | −0.3 | |||
| Party | Candidate | Votes | % | ±% | |
|---|---|---|---|---|---|
| Conservative | Mark Harper | 22,853 | 46.9 | +6.0 | |
| Labour | Bruce Hogan | 11,789 | 24.2 | −12.4 | |
| Liberal Democrats | Christopher Coleman | 10,676 | 21.9 | +4.7 | |
| UKIP | Tim Congdon | 2,522 | 5.2 | +2.8 | |
| Green | James Greenwood | 923 | 1.9 | −0.2 | |
| Majority | 11,064 | 22.7 | +18.4 | ||
| Turnout | 48,763 | 71.3 | +0.4 | ||
| Registered electors | 68,419 | +1.8 | |||
| Conservative hold | Swing | +9.2 | |||
Elections in the 2000s[]
| Party | Candidate | Votes | % | ±% | |
|---|---|---|---|---|---|
| Conservative | Mark Harper | 19,474 | 40.9 | +2.1 | |
| Labour | Isabel Owen | 17,425 | 36.6 | −6.8 | |
| Liberal Democrats | Christopher Coleman | 8,185 | 17.2 | +4.3 | |
| UKIP | Patricia Hill | 1,140 | 2.4 | +0.9 | |
| Green | Stephen Tweedie | 991 | 2.1 | −0.7 | |
| Independent | Anthony Reeve | 300 | 0.6 | - | |
| English Democrat | Gerald Morgan | 125 | 0.3 | −0.4 | |
| Majority | 2,049 | 4.3 | −0.3 | ||
| Turnout | 47,640 | 70.8 | +3.5 | ||
| Registered electors | 67,241 | +1.5 | |||
| Conservative gain from Labour | Swing | +4.4 | |||
| Party | Candidate | Votes | % | ±% | |
|---|---|---|---|---|---|
| Labour | Diana Organ | 19,350 | 43.4 | −4.8 | |
| Conservative | Mark Harper | 17,301 | 38.8 | +3.2 | |
| Liberal Democrats | David Gayler | 5,762 | 12.9 | +0.6 | |
| Green | Simon Pickering | 1,254 | 2.8 | - | |
| UKIP | Allen Prout | 661 | 1.5 | - | |
| Independent | Gerald Morgan | 279 | 0.6 | +0.2 | |
| Majority | 2,049 | 4.6 | -8.0 | ||
| Turnout | 44,607 | 67.3 | −11.7 | ||
| Registered electors | 66,240 | +4.4 | |||
| Labour hold | Swing | −4.0 | |||
Election in the 1990s[]
| Party | Candidate | Votes | % | ±% | |
|---|---|---|---|---|---|
| Labour | Diana Organ | 24,203 | 48.2 | +5.8 | |
| Conservative | Paul Marland | 17,860 | 35.6 | −5.5 | |
| Liberal Democrats | Anthony Lynch | 6,165 | 12.3 | −3.8 | |
| Referendum | Dominic Hopkins | 1,624 | 3.2 | - | |
| Independent | Gerald Morgan | 218 | 0.4 | - | |
| Independent | Colin Palmer | 80 | 0.2 | - | |
| Independent | Stephen Porter | 34 | 0.1 | - | |
| Majority | 6,343 | 12.6 | +11.2 | ||
| Turnout | 50,184 | 79.1 | −4.0 | ||
| Registered electors | 63,465 | +0.9 | |||
| Labour win (new seat) | |||||
Election in the 1940s[]
| Party | Candidate | Votes | % | ±% | |
|---|---|---|---|---|---|
| Labour | M. Philips Price | 19,721 | 65.2 | +7.6 | |
| Independent | John Brown | 10,529 | 34.8 | - | |
| Majority | 9,192 | 30.4 | +15.2 | ||
| Turnout | 30,250 | 70.9 | −6.4 | ||
| Registered electors | 42,667 | 13.3 | |||
| Labour hold | |||||
Elections in the 1930s[]
| Party | Candidate | Votes | % | ±% | |
|---|---|---|---|---|---|
| Labour | M. Philips Price | 16,768 | 57.6 | +10.3 | |
| National Labour | John Worthington | 12,337 | 42.4 | −10.3 | |
| Majority | 4,431 | 15.2 | +9.8 | ||
| Turnout | 29,105 | 77.3 | +0.4 | ||
| Registered electors | 37,643 | +3.0 | |||
| Labour gain from National Labour | Swing | +10.3 | |||
| Party | Candidate | Votes | % | ±% | |
|---|---|---|---|---|---|
| National Labour | John Worthington | 14,815 | 52.7 | - | |
| Labour | David Vaughan | 13,291 | 47.3 | −4.8 | |
| Majority | 1,524 | 5.4 | −20.3 | ||
| Turnout | 28,106 | 76.9 | +3.6 | ||
| Registered electors | 36,547 | 0.0 | |||
| National Labour gain from Labour | |||||
Elections in the 1920s[]
| Party | Candidate | Votes | % | ±% | |
|---|---|---|---|---|---|
| Labour | David Vaughan | 13,976 | 52.1 | +3.7 | |
| Unionist | 7,092 | 26.5 | −9.4 | ||
| Liberal | Joseph W Westwood | 5,738 | 21.4 | +5.7 | |
| Majority | 6,884 | 25.7 | +13.1 | ||
| Turnout | 26,806 | 73.3 | −7.5 | ||
| Registered electors | 36,563 | +23.1 | |||
| Labour hold | Swing | +6.5 | |||
| Party | Candidate | Votes | % | ±% | |
|---|---|---|---|---|---|
| Labour | A. A. Purcell | 11,629 | 48.4 | −4.7 | |
| Unionist | Michael Beaumont | 8,607 | 35.8 | −11.0 | |
| Liberal | W.H. West | 3,774 | 15.7 | - | |
| Majority | 3,022 | 12.6 | +6.3 | ||
| Turnout | 24,010 | 80.9 | +10.9 | ||
| Registered electors | 29,696 | 0.0 | |||
| Labour hold | Swing | +3.1 | |||
| Party | Candidate | Votes | % | ±% | |
|---|---|---|---|---|---|
| Labour | James Wignall | 11,048 | 53.1 | −7.7 | |
| Unionist | Michael Beaumont | 9,739 | 46.9 | +7.7 | |
| Majority | 1,309 | 6.2 | −15.4 | ||
| Turnout | 20,787 | 70.0 | +5.3 | ||
| Registered electors | 29,696 | +1.8 | |||
| Labour hold | Swing | −7.7 | |||
| Party | Candidate | Votes | % | ±% | |
|---|---|---|---|---|---|
| Labour | James Wignall | 11,486 | 60.9 | +8.5 | |
| Unionist | Augustus Dinnick | 7,383 | 39.1 | +10.2 | |
| Majority | 4,103 | 21.7 | −1.8 | ||
| Turnout | 18,869 | 64.7 | −7.3 | ||
| Registered electors | 29,174 | +1.7 | |||
| Labour hold | Swing | −0.9 | |||

| Party | Candidate | Votes | % | ±% | |
|---|---|---|---|---|---|
| Labour | James Wignall | 10,820 | 52.4 | −10.4 | |
| Ind. Conservative | Augustus Dinnick | 5,976 | 28.9 | - | |
| National Liberal | Winifred Coombe Tennant | 3,861 | 18.7 | - | |
| Majority | 4,854 | 23.5 | −2.1 | ||
| Turnout | 20,647 | 72.0 | +15.9 | ||
| Registered electors | 28,686 | +3.8 | |||
| Labour hold | |||||
Election results 1885-1918[]
Elections in the 1910s[]
| Party | Candidate | Votes | % | ±% | |
|---|---|---|---|---|---|
| Labour | James Wignall | 9,731 | 62.8 | N/A | |
| C | Liberal | Henry Webb | 5,765 | 37.2 | N/A |
| Majority | 3,966 | 25.6 | N/A | ||
| Turnout | 15,496 | 56.1 | N/A | ||
| Registered electors | 27,624 | N/A | |||
| Labour gain from Liberal | |||||
| C indicates candidate endorsed by the coalition government. | |||||
General Election 1914/15
A general election was due to take place by the end of 1915. By the autumn of 1914, the following candidates had been selected to contest that election. Due to the outbreak of war, the election never took place;
- Liberal Party: Henry Webb
- Labour Party: James Wignall
| Party | Candidate | Votes | % | ±% | |
|---|---|---|---|---|---|
| Liberal | Henry Webb | Unopposed | |||
| Liberal hold | |||||

| Party | Candidate | Votes | % | ±% | |
|---|---|---|---|---|---|
| Liberal | Henry Webb | 6,174 | 66.5 | +0.2 | |
| Conservative | 3,106 | 33.5 | −0.2 | ||
| Majority | 3,068 | 33.1 | +0.5 | ||
| Turnout | 9,280 | 82.8 | +5.9 | ||
| Registered electors | 11,214 | ||||
| Liberal hold | Swing | +0.2 | |||
| Party | Candidate | Votes | % | ±% | |
|---|---|---|---|---|---|
| Liberal | Charles Dilke | 5,544 | 66.3 | +1.1 | |
| Conservative | 2,820 | 33.7 | −1.1 | ||
| Majority | 2,724 | 32.6 | +2.2 | ||
| Turnout | 8,364 | 76.9 | −9.7 | ||
| Registered electors | 10,881 | 0.0 | |||
| Liberal hold | Swing | +1.1 | |||
| Party | Candidate | Votes | % | ±% | |
|---|---|---|---|---|---|
| Liberal | Charles Dilke | 6,141 | 65.2 | N/A | |
| Conservative | John Henry Renton | 3,279 | 34.8 | N/A | |
| Majority | 2,862 | 30.4 | N/A | ||
| Turnout | 9,420 | 86.6 | N/A | ||
| Registered electors | 10,881 | +8.9 | |||
| Liberal hold | |||||
Elections in the 1900s[]
| Party | Candidate | Votes | % | ±% | |
|---|---|---|---|---|---|
| Liberal | Charles Dilke | Unopposed | |||
| Liberal hold | |||||
| Party | Candidate | Votes | % | ±% | |
|---|---|---|---|---|---|
| Liberal | Charles Dilke | 4,972 | 66.4 | n/a | |
| Conservative | H Terrell | 2,520 | 33.6 | n/a | |
| Majority | 2,452 | 32.7 | n/a | ||
| Turnout | 7,492 | 75.0 | n/a | ||
| Registered electors | 9,993 | n/a | |||
| Liberal hold | |||||
Elections in the 1890s[]
| Party | Candidate | Votes | % | ±% | |
|---|---|---|---|---|---|
| Liberal | Charles Dilke | unopposed | n/a | n/a | |
| Liberal hold | |||||

| Party | Candidate | Votes | % | ±% | |
|---|---|---|---|---|---|
| Liberal | Charles Dilke | 5,360 | 64.6 | +3.5 | |
| Conservative | [21] | 2,942 | 35.4 | −3.5 | |
| Majority | 2,418 | 29.2 | +7.1 | ||
| Turnout | 8,302 | 77.0 | +7.0 | ||
| Registered electors | 10,782 | +7.5 | |||
| Liberal hold | Swing | +3.5 | |||
Elections in the 1880s[]
| Party | Candidate | Votes | % | ±% | |
|---|---|---|---|---|---|
| Liberal | Godfrey Samuelson | 4,286 | 61.0 | −7.0 | |
| Conservative | Edward Wyndham | 2,736 | 39.0 | +7.0 | |
| Majority | 1,550 | 22.1 | −14.0 | ||
| Turnout | 7,022 | 70.0 | −10.0 | ||
| Registered electors | 10,032 | ||||
| Liberal hold | Swing | −7.0 | |||
- Caused by Blake's resignation.
| Party | Candidate | Votes | % | ±% | |
|---|---|---|---|---|---|
| Liberal | Thomas Blake | 3,822 | 61.3 | −6.7 | |
| Liberal Unionist | Frederick Louis Lucas[23] | 2,415 | 38.7 | +6.7 | |
| Majority | 1,407 | 22.6 | −13.4 | ||
| Turnout | 6,237 | 65.9 | −14.1 | ||
| Registered electors | 9,458 | ||||
| Liberal hold | Swing | +6.7 | |||
| Party | Candidate | Votes | % | ±% | |
|---|---|---|---|---|---|
| Liberal | Thomas Blake | 5,143 | 68.0 | N/A | |
| Conservative | John Plunkett | 2,421 | 32.0 | N/A | |
| Majority | 2,722 | 36.0 | N/A | ||
| Turnout | 7,564 | 80.0 | N/A | ||
| Registered electors | 9,458 | ||||
| Liberal win (new seat) | |||||
Notes and references[]
Notes
References
- ^ "Electorate Figures – Boundary Commission for England". 2011 Electorate Figures. Boundary Commission for England. 4 March 2011. Archived from the original on 6 November 2010. Retrieved 13 March 2011.
- ^ "Forest of Dean". Gloucestershire Live. Archived from the original on 1 August 2020. Retrieved 21 August 2020.
- ^ A Glance Back at Lydney Docks, Neil Parkhouse ISBN 9781903599006
- ^ Jump up to: a b Leigh Rayment's Historical List of MPs – Constituencies beginning with "F"
- ^ "Forest of Dean parliamentary constituency". BBC News. Archived from the original on 2019-04-11. Retrieved 2018-06-22.
- ^ "Forest of Dean parliamentary constituency". BBC News. Archived from the original on 2019-04-11. Retrieved 2018-06-22.
- ^ "Election Data 2015". Electoral Calculus. Archived from the original on 17 October 2015. Retrieved 17 October 2015.
- ^ "Forest of Dean District Council – Page unavailable". www.fdean.gov.uk. Archived from the original on 2015-07-09. Retrieved 2015-07-08.
- ^ Jump up to: a b "FOREST OF DEAN 2015". electionresults.blogspot.co.uk. Archived from the original on 2014-12-05. Retrieved 2014-11-28.
- ^ "Election Data 2010". Electoral Calculus. Archived from the original on 26 July 2013. Retrieved 17 October 2015.
- ^ "Election Data 2005". Electoral Calculus. Archived from the original on 15 October 2011. Retrieved 18 October 2015.
- ^ "Election Data 2001". Electoral Calculus. Archived from the original on 15 October 2011. Retrieved 18 October 2015.
- ^ "Election Data 1997". Electoral Calculus. Archived from the original on 15 October 2011. Retrieved 18 October 2015.
- ^ Percentage change and swing for 1997 is calculated relative to the Rallings and Thrasher 1992 notional constituency result, not actual 1992 result. See C. Rallings & M. Thrasher, The Media Guide to the New Parliamentary Constituencies (Plymouth: LGC Elections Centre, 1995)
- ^ Jump up to: a b c d e f FWS Craig, British Parliamentary Election Results 1918–1949; Political Reference Publications, Glasgow 1949
- ^ "Forest of Dean Election". North Devon Journal. 16 July 1925. Archived from the original on 21 August 2020. Retrieved 13 October 2016 – via British Newspaper Archive.
- ^ Jump up to: a b c d e f g h i British Parliamentary Election Results 1885-1918, FWS Craig
- ^ Jump up to: a b Debrett's House of Commons & Judicial Bench, 1916
- ^ Jump up to: a b c d e f The Liberal Year Book, 1907
- ^ Jump up to: a b Debrett's House of Commons & Judicial Bench, 1901
- ^ ‘COLCHESTER WEMYSS, Maynard Willoughby’, Who Was Who, A & C Black, an imprint of Bloomsbury Publishing plc, 1920–2016; online edn, Oxford University Press, 2015 ; online edn, Feb 2015 accessed 19 Oct 2017 Archived 21 August 2020 at the Wayback Machine
- ^ The Constitutional Year Book, 1904, published by Conservative Central Office, page 144 (168 in web page), Gloucestershire
- ^ "The Contest in Dean Forest". Western Daily Press. 3 Jul 1886. p. 4. Archived from the original on 21 August 2020. Retrieved 26 November 2017 – via British Newspaper Archive.
- ^ Debrett's House of Commons & Judicial Bench, 1886
See also[]
- Forest of Dean
- Parliamentary constituencies in South West England
- Politics of Gloucestershire