Gene regulatory network


A gene (or genetic) regulatory network (GRN) is a collection of molecular regulators that interact with each other and with other substances in the cell to govern the gene expression levels of mRNA and proteins which, in turn, determine the function of the cell. GRN also play a central role in morphogenesis, the creation of body structures, which in turn is central to evolutionary developmental biology (evo-devo).
The regulator can be DNA, RNA, protein and complexes of these. The interaction can be direct or indirect (through transcribed RNA or translated protein). In general, each mRNA molecule goes on to make a specific protein (or set of proteins). In some cases this protein will be structural, and will accumulate at the cell membrane or within the cell to give it particular structural properties. In other cases the protein will be an enzyme, i.e., a micro-machine that catalyses a certain reaction, such as the breakdown of a food source or toxin. Some proteins though serve only to activate other genes, and these are the transcription factors that are the main players in regulatory networks or cascades. By binding to the promoter region at the start of other genes they turn them on, initiating the production of another protein, and so on. Some transcription factors are inhibitory.[1]
In single-celled organisms, regulatory networks respond to the external environment, optimising the cell at a given time for survival in this environment. Thus a yeast cell, finding itself in a sugar solution, will turn on genes to make enzymes that process the sugar to alcohol.[2] This process, which we associate with wine-making, is how the yeast cell makes its living, gaining energy to multiply, which under normal circumstances would enhance its survival prospects.
In multicellular animals the same principle has been put in the service of gene cascades that control body-shape.[3] Each time a cell divides, two cells result which, although they contain the same genome in full, can differ in which genes are turned on and making proteins. Sometimes a 'self-sustaining feedback loop' ensures that a cell maintains its identity and passes it on. Less understood is the mechanism of epigenetics by which chromatin modification may provide cellular memory by blocking or allowing transcription. A major feature of multicellular animals is the use of morphogen gradients, which in effect provide a positioning system that tells a cell where in the body it is, and hence what sort of cell to become. A gene that is turned on in one cell may make a product that leaves the cell and diffuses through adjacent cells, entering them and turning on genes only when it is present above a certain threshold level. These cells are thus induced into a new fate, and may even generate other morphogens that signal back to the original cell. Over longer distances morphogens may use the active process of signal transduction. Such signalling controls embryogenesis, the building of a body plan from scratch through a series of sequential steps. They also control and maintain adult bodies through feedback processes, and the loss of such feedback because of a mutation can be responsible for the cell proliferation that is seen in cancer. In parallel with this process of building structure, the gene cascade turns on genes that make structural proteins that give each cell the physical properties it needs.
Overview[]
At one level, biological cells can be thought of as "partially mixed bags" of biological chemicals – in the discussion of gene regulatory networks, these chemicals are mostly the messenger RNAs (mRNAs) and proteins that arise from gene expression. These mRNA and proteins interact with each other with various degrees of specificity. Some diffuse around the cell. Others are bound to cell membranes, interacting with molecules in the environment. Still others pass through cell membranes and mediate long range signals to other cells in a multi-cellular organism. These molecules and their interactions comprise a gene regulatory network. A typical gene regulatory network looks something like this:
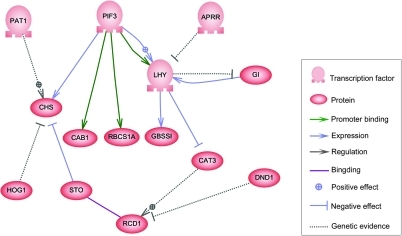
The nodes of this network can represent genes, proteins, mRNAs, protein/protein complexes or cellular processes. Nodes that are depicted as lying along vertical lines are associated with the cell/environment interfaces, while the others are free-floating and can diffuse. Edges between nodes represent interactions between the nodes, that can correspond to individual molecular reactions between DNA, mRNA, miRNA, proteins or molecular processes through which the products of one gene affect those of another, though the lack of experimentally obtained information often implies that some reactions are not modeled at such a fine level of detail. These interactions can be inductive (usually represented by arrowheads or the + sign), with an increase in the concentration of one leading to an increase in the other, inhibitory (represented with filled circles, blunt arrows or the minus sign), with an increase in one leading to a decrease in the other, or dual, when depending on the circumstances the regulator can activate or inhibit the target node. The nodes can regulate themselves directly or indirectly, creating feedback loops, which form cyclic chains of dependencies in the topological network. The network structure is an abstraction of the system's molecular or chemical dynamics, describing the manifold ways in which one substance affects all the others to which it is connected. In practice, such GRNs are inferred from the biological literature on a given system and represent a distillation of the collective knowledge about a set of related biochemical reactions. To speed up the manual curation of GRNs, some recent efforts try to use text mining, curated databases, network inference from massive data, model checking and other information extraction technologies for this purpose.[4]
Genes can be viewed as nodes in the network, with input being proteins such as transcription factors, and outputs being the level of gene expression. The value of the node depends on a function which depends on the value of its regulators in previous time steps (in the Boolean network described below these are Boolean functions, typically AND, OR, and NOT). These functions have been interpreted as performing a kind of information processing within the cell, which determines cellular behavior. The basic drivers within cells are concentrations of some proteins, which determine both spatial (location within the cell or tissue) and temporal (cell cycle or developmental stage) coordinates of the cell, as a kind of "cellular memory". The gene networks are only beginning to be understood, and it is a next step for biology to attempt to deduce the functions for each gene "node", to help understand the behavior of the system in increasing levels of complexity, from gene to signaling pathway, cell or tissue level.[5]
Mathematical models of GRNs have been developed to capture the behavior of the system being modeled, and in some cases generate predictions corresponding with experimental observations. In some other cases, models have proven to make accurate novel predictions, which can be tested experimentally, thus suggesting new approaches to explore in an experiment that sometimes wouldn't be considered in the design of the protocol of an experimental laboratory. Modeling techniques include differential equations (ODEs), Boolean networks, Petri nets, Bayesian networks, graphical Gaussian network models, Stochastic, and Process Calculi.[6] Conversely, techniques have been proposed for generating models of GRNs that best explain a set of time series observations. Recently it has been shown that ChIP-seq signal of histone modification are more correlated with transcription factor motifs at promoters in comparison to RNA level.[7] Hence it is proposed that time-series histone modification ChIP-seq could provide more reliable inference of gene-regulatory networks in comparison to methods based on expression levels.
Structure and evolution[]
Global feature[]
Gene regulatory networks are generally thought to be made up of a few highly connected nodes (hubs) and many poorly connected nodes nested within a hierarchical regulatory regime. Thus gene regulatory networks approximate a hierarchical scale free network topology.[8] This is consistent with the view that most genes have limited pleiotropy and operate within regulatory modules.[9] This structure is thought to evolve due to the preferential attachment of duplicated genes to more highly connected genes.[8] Recent work has also shown that natural selection tends to favor networks with sparse connectivity.[10]
There are primarily two ways that networks can evolve, both of which can occur simultaneously. The first is that network topology can be changed by the addition or subtraction of nodes (genes) or parts of the network (modules) may be expressed in different contexts. The Drosophila Hippo signaling pathway provides a good example. The Hippo signaling pathway controls both mitotic growth and post-mitotic cellular differentiation.[11] Recently it was found that the network the Hippo signaling pathway operates in differs between these two functions which in turn changes the behavior of the Hippo signaling pathway. This suggests that the Hippo signaling pathway operates as a conserved regulatory module that can be used for multiple functions depending on context.[11] Thus, changing network topology can allow a conserved module to serve multiple functions and alter the final output of the network. The second way networks can evolve is by changing the strength of interactions between nodes, such as how strongly a transcription factor may bind to a cis-regulatory element. Such variation in strength of network edges has been shown to underlie between species variation in vulva cell fate patterning of Caenorhabditis worms.[12]
Local feature[]

Another widely cited characteristic of gene regulatory network is their abundance of certain repetitive sub-networks known as network motifs. Network motifs can be regarded as repetitive topological patterns when dividing a big network into small blocks. Previous analysis found several types of motifs that appeared more often in gene regulatory networks than in randomly generated networks.[13][14][15] As an example, one such motif is called feed-forward loops, which consist three nodes. This motif is the most abundant among all possible motifs made up of three nodes, as is shown in the gene regulatory networks of fly, nematode, and human.[15]
The enriched motifs have been proposed to follow convergent evolution, suggesting they are "optimal designs" for certain regulatory purposes.[16] For example, modeling shows that feed-forward loops are able to coordinate the change in node A (in terms of concentration and activity) and the expression dynamics of node C, creating different input-output behaviors.[17][18] The galactose utilization system of E. coli contains a feed-forward loop which accelerates the activation of galactose utilization operon galETK, potentially facilitating the metabolic transition to galactose when glucose is depleted.[19] The feed-forward loop in the arabinose utilization systems of E.coli delays the activation of arabinose catabolism operon and transporters, potentially avoiding unnecessary metabolic transition due to temporary fluctuations in upstream signaling pathways.[20] Similarly in the Wnt signaling pathway of Xenopus, the feed-forward loop acts as a fold-change detector that responses to the fold change, rather than the absolute change, in the level of β-catenin, potentially increasing the resistance to fluctuations in β-catenin levels.[21] Following the convergent evolution hypothesis, the enrichment of feed-forward loops would be an adaptation for fast response and noise resistance. A recent research found that yeast grown in an environment of constant glucose developed mutations in glucose signaling pathways and growth regulation pathway, suggesting regulatory components responding to environmental changes are dispensable under constant environment.[22]
On the other hand, some researchers hypothesize that the enrichment of network motifs is non-adaptive.[23] In other words, gene regulatory networks can evolve to a similar structure without the specific selection on the proposed input-output behavior. Support for this hypothesis often comes from computational simulations. For example, fluctuations in the abundance of feed-forward loops in a model that simulates the evolution of gene regulatory networks by randomly rewiring nodes may suggest that the enrichment of feed-forward loops is a side-effect of evolution.[24] In another model of gene regulator networks evolution, the ratio of the frequencies of gene duplication and gene deletion show great influence on network topology: certain ratios lead to the enrichment of feed-forward loops and create networks that show features of hierarchical scale free networks. De novo evolution of coherent type 1 feed-forward loops has been demonstrated computationally in response to selection for their hypothesized function of filtering out a short spurious signal, supporting adaptive evolution, but for non-idealized noise, a dynamics-based system of feed-forward regulation with different topology was instead favored.[25]
Bacterial regulatory networks[]
Regulatory networks allow bacteria to adapt to almost every environmental niche on earth.[26][27] A network of interactions among diverse types of molecules including DNA, RNA, proteins and metabolites, is utilised by the bacteria to achieve regulation of gene expression. In bacteria, the principal function of regulatory networks is to control the response to environmental changes, for example nutritional status and environmental stress.[28] A complex organization of networks permits the microorganism to coordinate and integrate multiple environmental signals.[26]
Modelling[]
Coupled ordinary differential equations[]
It is common to model such a network with a set of coupled ordinary differential equations (ODEs) or SDEs, describing the reaction kinetics of the constituent parts. Suppose that our regulatory network has nodes, and let represent the concentrations of the corresponding substances at time . Then the temporal evolution of the system can be described approximately by


where the functions express the dependence of on the concentrations of other substances present in the cell. The functions are ultimately derived from basic principles of chemical kinetics or simple expressions derived from these e.g. Michaelis–Menten enzymatic kinetics. Hence, the functional forms of the are usually chosen as low-order polynomials or Hill functions that serve as an ansatz for the real molecular dynamics. Such models are then studied using the mathematics of nonlinear dynamics. System-specific information, like reaction rate constants and sensitivities, are encoded as constant parameters.[29]


By solving for the fixed point of the system:

for all , one obtains (possibly several) concentration profiles of proteins and mRNAs that are theoretically sustainable (though not necessarily stable). Steady states of kinetic equations thus correspond to potential cell types, and oscillatory solutions to the above equation to naturally cyclic cell types. Mathematical stability of these attractors can usually be characterized by the sign of higher derivatives at critical points, and then correspond to biochemical stability of the concentration profile. Critical points and bifurcations in the equations correspond to critical cell states in which small state or parameter perturbations could switch the system between one of several stable differentiation fates. Trajectories correspond to the unfolding of biological pathways and transients of the equations to short-term biological events. For a more mathematical discussion, see the articles on nonlinearity, dynamical systems, bifurcation theory, and chaos theory.

Boolean network[]
The following example illustrates how a Boolean network can model a GRN together with its gene products (the outputs) and the substances from the environment that affect it (the inputs). Stuart Kauffman was amongst the first biologists to use the metaphor of Boolean networks to model genetic regulatory networks.[30][31]
- Each gene, each input, and each output is represented by a node in a directed graph in which there is an arrow from one node to another if and only if there is a causal link between the two nodes.
- Each node in the graph can be in one of two states: on or off.
- For a gene, "on" corresponds to the gene being expressed; for inputs and outputs, "off" corresponds to the substance being present.
- Time is viewed as proceeding in discrete steps. At each step, the new state of a node is a Boolean function of the prior states of the nodes with arrows pointing towards it.
The validity of the model can be tested by comparing simulation results with time series observations. A partial validation of a Boolean network model can also come from testing the predicted existence of a yet unknown regulatory connection between two particular transcription factors that each are nodes of the model.[32]
Continuous networks[]
Continuous network models of GRNs are an extension of the boolean networks described above. Nodes still represent genes and connections between them regulatory influences on gene expression. Genes in biological systems display a continuous range of activity levels and it has been argued that using a continuous representation captures several properties of gene regulatory networks not present in the Boolean model.[33] Formally most of these approaches are similar to an artificial neural network, as inputs to a node are summed up and the result serves as input to a sigmoid function, e.g.,[34] but proteins do often control gene expression in a synergistic, i.e. non-linear, way.[35] However, there is now a continuous network model[36] that allows grouping of inputs to a node thus realizing another level of regulation. This model is formally closer to a higher order recurrent neural network. The same model has also been used to mimic the evolution of cellular differentiation[37] and even multicellular morphogenesis.[38]
Stochastic gene networks[]
Recent experimental results[39] [40] have demonstrated that gene expression is a stochastic process. Thus, many authors are now using the stochastic formalism, after the work by Arkin et al.[41] Works on single gene expression[42] and small synthetic genetic networks,[43][44] such as the genetic toggle switch of Tim Gardner and Jim Collins, provided additional experimental data on the phenotypic variability and the stochastic nature of gene expression. The first versions of stochastic models of gene expression involved only instantaneous reactions and were driven by the Gillespie algorithm.[45]
Since some processes, such as gene transcription, involve many reactions and could not be correctly modeled as an instantaneous reaction in a single step, it was proposed to model these reactions as single step multiple delayed reactions in order to account for the time it takes for the entire process to be complete.[46]
From here, a set of reactions were proposed[47] that allow generating GRNs. These are then simulated using a modified version of the Gillespie algorithm, that can simulate multiple time delayed reactions (chemical reactions where each of the products is provided a time delay that determines when will it be released in the system as a "finished product").
For example, basic transcription of a gene can be represented by the following single-step reaction (RNAP is the RNA polymerase, RBS is the RNA ribosome binding site, and Pro i is the promoter region of gene i):

Furthermore, there seems to be a trade-off between the noise in gene expression, the speed with which genes can switch, and the metabolic cost associated their functioning. More specifically, for any given level of metabolic cost, there is an optimal trade-off between noise and processing speed and increasing the metabolic cost leads to better speed-noise trade-offs.[48][49][50]
A recent work proposed a simulator (SGNSim, Stochastic Gene Networks Simulator),[51] that can model GRNs where transcription and translation are modeled as multiple time delayed events and its dynamics is driven by a stochastic simulation algorithm (SSA) able to deal with multiple time delayed events. The time delays can be drawn from several distributions and the reaction rates from complex functions or from physical parameters. SGNSim can generate ensembles of GRNs within a set of user-defined parameters, such as topology. It can also be used to model specific GRNs and systems of chemical reactions. Genetic perturbations such as gene deletions, gene over-expression, insertions, frame shift mutations can also be modeled as well.
The GRN is created from a graph with the desired topology, imposing in-degree and out-degree distributions. Gene promoter activities are affected by other genes expression products that act as inputs, in the form of monomers or combined into multimers and set as direct or indirect. Next, each direct input is assigned to an operator site and different transcription factors can be allowed, or not, to compete for the same operator site, while indirect inputs are given a target. Finally, a function is assigned to each gene, defining the gene's response to a combination of transcription factors (promoter state). The transfer functions (that is, how genes respond to a combination of inputs) can be assigned to each combination of promoter states as desired.
In other recent work, multiscale models of gene regulatory networks have been developed that focus on synthetic biology applications. Simulations have been used that model all biomolecular interactions in transcription, translation, regulation, and induction of gene regulatory networks, guiding the design of synthetic systems.[52]
Prediction[]
Other work has focused on predicting the gene expression levels in a gene regulatory network. The approaches used to model gene regulatory networks have been constrained to be interpretable and, as a result, are generally simplified versions of the network. For example, Boolean networks have been used due to their simplicity and ability to handle noisy data but lose data information by having a binary representation of the genes. Also, artificial neural networks omit using a hidden layer so that they can be interpreted, losing the ability to model higher order correlations in the data. Using a model that is not constrained to be interpretable, a more accurate model can be produced. Being able to predict gene expressions more accurately provides a way to explore how drugs affect a system of genes as well as for finding which genes are interrelated in a process. This has been encouraged by the DREAM competition[53] which promotes a competition for the best prediction algorithms.[54] Some other recent work has used artificial neural networks with a hidden layer.[55]
Applications[]
Multiple sclerosis[]
There are three classes of multiple sclerosis: relapsing-remitting (RRMS), primary progressive (PPMS) and secondary progressive (SPMS). Gene regulatory network (GRN) plays a vital role to understand the disease mechanism across these three different multiple sclerosis classes.[56]
See also[]
- Body plan
- Cis-regulatory module
- Genenetwork (database)
- Morphogen
- Operon
- Synexpression
- Systems biology
- Weighted gene co-expression network analysis
References[]
- ^ Latchman DS (September 1996). "Inhibitory transcription factors". The International Journal of Biochemistry & Cell Biology. 28 (9): 965–74. doi:10.1016/1357-2725(96)00039-8. PMID 8930119.
- ^ Lee TI, Rinaldi NJ, Robert F, Odom DT, Bar-Joseph Z, Gerber GK, et al. (October 2002). "Transcriptional regulatory networks in Saccharomyces cerevisiae". Science. Young Lab. 298 (5594): 799–804. Bibcode:2002Sci...298..799L. doi:10.1126/science.1075090. PMID 12399584. S2CID 4841222.
- ^ Davidson E, Levin M (April 2005). "Gene regulatory networks". Proceedings of the National Academy of Sciences of the United States of America. 102 (14): 4935. Bibcode:2005PNAS..102.4935D. doi:10.1073/pnas.0502024102. PMC 556010. PMID 15809445.
- ^ Leitner F, Krallinger M, Tripathi S, Kuiper M, Lægreid A, Valencia A (July 2013). "Mining cis-regulatory transcription networks from literature". Proceedings of BioLINK SIG 2013: 5–12.
- ^ Azpeitia E, Muñoz S, González-Tokman D, Martínez-Sánchez ME, Weinstein N, Naldi A, Álvarez-Buylla ER, Rosenblueth DA, Mendoza L (February 2017). "The combination of the functionalities of feedback circuits is determinant for the attractors' number and size in pathway-like Boolean networks". Scientific Reports. 7: 42023. Bibcode:2017NatSR...742023A. doi:10.1038/srep42023. PMC 5301197. PMID 28186191.
- ^ Banf, Michael; Rhee, Seung Y. (January 2017). "Computational inference of gene regulatory networks: Approaches, limitations and opportunities". Biochimica et Biophysica Acta (BBA) - Gene Regulatory Mechanisms. 1860 (1): 41–52. doi:10.1016/j.bbagrm.2016.09.003. ISSN 1874-9399. PMID 27641093.
- ^ Kumar V, Muratani M, Rayan NA, Kraus P, Lufkin T, Ng HH, Prabhakar S (July 2013). "Uniform, optimal signal processing of mapped deep-sequencing data". Nature Biotechnology. 31 (7): 615–22. doi:10.1038/nbt.2596. PMID 23770639.
- ^ a b Barabási AL, Oltvai ZN (February 2004). "Network biology: understanding the cell's functional organization". Nature Reviews. Genetics. 5 (2): 101–13. doi:10.1038/nrg1272. PMID 14735121. S2CID 10950726.
- ^ Wagner GP, Zhang J (March 2011). "The pleiotropic structure of the genotype–phenotype map: the evolvability of complex organisms". Nature Reviews. Genetics. 12 (3): 204–13. doi:10.1038/nrg2949. PMID 21331091. S2CID 8612268.
- ^ Leclerc RD (August 2008). "Survival of the sparsest: robust gene networks are parsimonious". Molecular Systems Biology. 4 (1): 213. doi:10.1038/msb.2008.52. PMC 2538912. PMID 18682703.
- ^ a b Jukam D, Xie B, Rister J, Terrell D, Charlton-Perkins M, Pistillo D, Gebelein B, Desplan C, Cook T (October 2013). "Opposite feedbacks in the Hippo pathway for growth control and neural fate". Science. 342 (6155): 1238016. doi:10.1126/science.1238016. PMC 3796000. PMID 23989952.
- ^ Hoyos E, Kim K, Milloz J, Barkoulas M, Pénigault JB, Munro E, Félix MA (April 2011). "Quantitative variation in autocrine signaling and pathway crosstalk in the Caenorhabditis vulval network". Current Biology. 21 (7): 527–38. doi:10.1016/j.cub.2011.02.040. PMC 3084603. PMID 21458263.
- ^ Shen-Orr SS, Milo R, Mangan S, Alon U (May 2002). "Network motifs in the transcriptional regulation network of Escherichia coli". Nature Genetics. 31 (1): 64–8. doi:10.1038/ng881. PMID 11967538. S2CID 2180121.
- ^ Lee TI, Rinaldi NJ, Robert F, Odom DT, Bar-Joseph Z, Gerber GK, Hannett NM, Harbison CT, Thompson CM, Simon I, Zeitlinger J, Jennings EG, Murray HL, Gordon DB, Ren B, Wyrick JJ, Tagne JB, Volkert TL, Fraenkel E, Gifford DK, Young RA (October 2002). "Transcriptional regulatory networks in Saccharomyces cerevisiae". Science. 298 (5594): 799–804. Bibcode:2002Sci...298..799L. doi:10.1126/science.1075090. PMID 12399584. S2CID 4841222.
- ^ a b Boyle AP, Araya CL, Brdlik C, Cayting P, Cheng C, Cheng Y, et al. (August 2014). "Comparative analysis of regulatory information and circuits across distant species". Nature. 512 (7515): 453–6. Bibcode:2014Natur.512..453B. doi:10.1038/nature13668. PMC 4336544. PMID 25164757.
- ^ Conant GC, Wagner A (July 2003). "Convergent evolution of gene circuits". Nature Genetics. 34 (3): 264–6. doi:10.1038/ng1181. PMID 12819781. S2CID 959172.
- ^ Mangan S, Alon U (October 2003). "Structure and function of the feed-forward loop network motif". Proceedings of the National Academy of Sciences of the United States of America. 100 (21): 11980–5. Bibcode:2003PNAS..10011980M. doi:10.1073/pnas.2133841100. PMC 218699. PMID 14530388.
- ^ Goentoro L, Shoval O, Kirschner MW, Alon U (December 2009). "The incoherent feedforward loop can provide fold-change detection in gene regulation". Molecular Cell. 36 (5): 894–9. doi:10.1016/j.molcel.2009.11.018. PMC 2896310. PMID 20005851.
- ^ Mangan S, Itzkovitz S, Zaslaver A, Alon U (March 2006). "The incoherent feed-forward loop accelerates the response-time of the gal system of Escherichia coli". Journal of Molecular Biology. 356 (5): 1073–81. CiteSeerX 10.1.1.184.8360. doi:10.1016/j.jmb.2005.12.003. PMID 16406067.
- ^ Mangan S, Zaslaver A, Alon U (November 2003). "The coherent feedforward loop serves as a sign-sensitive delay element in transcription networks". Journal of Molecular Biology. 334 (2): 197–204. CiteSeerX 10.1.1.110.4629. doi:10.1016/j.jmb.2003.09.049. PMID 14607112.
- ^ Goentoro L, Kirschner MW (December 2009). "Evidence that fold-change, and not absolute level, of beta-catenin dictates Wnt signaling". Molecular Cell. 36 (5): 872–84. doi:10.1016/j.molcel.2009.11.017. PMC 2921914. PMID 20005849.
- ^ Kvitek DJ, Sherlock G (November 2013). "Whole genome, whole population sequencing reveals that loss of signaling networks is the major adaptive strategy in a constant environment". PLOS Genetics. 9 (11): e1003972. doi:10.1371/journal.pgen.1003972. PMC 3836717. PMID 24278038.
- ^ Lynch M (October 2007). "The evolution of genetic networks by non-adaptive processes". Nature Reviews. Genetics. 8 (10): 803–13. doi:10.1038/nrg2192. PMID 17878896. S2CID 11839414.
- ^ Cordero OX, Hogeweg P (October 2006). "Feed-forward loop circuits as a side effect of genome evolution". Molecular Biology and Evolution. 23 (10): 1931–6. doi:10.1093/molbev/msl060. PMID 16840361.
- ^ Xiong, Kun; Lancaster, Alex K.; Siegal, Mark L.; Masel, Joanna (3 June 2019). "Feed-forward regulation adaptively evolves via dynamics rather than topology when there is intrinsic noise". Nature Communications. 10 (1): 2418. Bibcode:2019NatCo..10.2418X. doi:10.1038/s41467-019-10388-6. PMC 6546794. PMID 31160574.
- ^ a b Filloux AA, ed. (2012). Bacterial Regulatory Networks. Caister Academic Press. ISBN 978-1-908230-03-4.
- ^ Gross R, Beier D, eds. (2012). Two-Component Systems in Bacteria. Caister Academic Press. ISBN 978-1-908230-08-9.
- ^ Requena JM, ed. (2012). Stress Response in Microbiology. Caister Academic Press. ISBN 978-1-908230-04-1.
- ^ Chu D, Zabet NR, Mitavskiy B (April 2009). "Models of transcription factor binding: sensitivity of activation functions to model assumptions" (PDF). Journal of Theoretical Biology. 257 (3): 419–29. doi:10.1016/j.jtbi.2008.11.026. PMID 19121637.
- ^ Kauffman SA (1993). The Origins of Order. ISBN 978-0-19-505811-6.
- ^ Kauffman SA (March 1969). "Metabolic stability and epigenesis in randomly constructed genetic nets". Journal of Theoretical Biology. 22 (3): 437–67. doi:10.1016/0022-5193(69)90015-0. PMID 5803332.
- ^ Lovrics A, Gao Y, Juhász B, Bock I, Byrne HM, Dinnyés A, Kovács KA (November 2014). "Boolean modelling reveals new regulatory connections between transcription factors orchestrating the development of the ventral spinal cord". PLOS ONE. 9 (11): e111430. Bibcode:2014PLoSO...9k1430L. doi:10.1371/journal.pone.0111430. PMC 4232242. PMID 25398016.
- ^ Vohradsky J (September 2001). "Neural model of the genetic network". The Journal of Biological Chemistry. 276 (39): 36168–73. doi:10.1074/jbc.M104391200. PMID 11395518.
- ^ Geard N, Wiles J (2005). "A gene network model for developing cell lineages". Artificial Life. 11 (3): 249–67. CiteSeerX 10.1.1.1.4742. doi:10.1162/1064546054407202. PMID 16053570. S2CID 8664677.
- ^ Schilstra MJ, Bolouri H (2 January 2002). "Modelling the Regulation of Gene Expression in Genetic Regulatory Networks". Biocomputation group, University of Hertfordshire. Archived from the original on 13 October 2007.
- ^ Knabe JF, Nehaniv CL, Schilstra MJ, Quick T (2006). "Evolving Biological Clocks using Genetic Regulatory Networks". Proceedings of the Artificial Life X Conference (Alife 10). MIT Press. pp. 15–21. CiteSeerX 10.1.1.72.5016.
- ^ Knabe JF, Nehaniv CL, Schilstra MJ (2006). "Evolutionary Robustness of Differentiation in Genetic Regulatory Networks". Proceedings of the 7th German Workshop on Artificial Life 2006 (GWAL-7). Berlin: Akademische Verlagsgesellschaft AKA. pp. 75–84. CiteSeerX 10.1.1.71.8768.
- ^ Knabe JF, Schilstra MJ, Nehaniv CL (2008). "Evolution and Morphogenesis of Differentiated Multicellular Organisms: Autonomously Generated Diffusion Gradients for Positional Information" (PDF). Artificial Life XI: Proceedings of the Eleventh International Conference on the Simulation and Synthesis of Living Systems. MIT Press.
- ^ Elowitz MB, Levine AJ, Siggia ED, Swain PS (August 2002). "Stochastic gene expression in a single cell" (PDF). Science. 297 (5584): 1183–6. Bibcode:2002Sci...297.1183E. doi:10.1126/science.1070919. PMID 12183631. S2CID 10845628.
- ^ Blake WJ, KAErn M, Cantor CR, Collins JJ (April 2003). "Noise in eukaryotic gene expression". Nature. 422 (6932): 633–7. Bibcode:2003Natur.422..633B. doi:10.1038/nature01546. PMID 12687005. S2CID 4347106.
- ^ Arkin A, Ross J, McAdams HH (August 1998). "Stochastic kinetic analysis of developmental pathway bifurcation in phage lambda-infected Escherichia coli cells". Genetics. 149 (4): 1633–48. doi:10.1093/genetics/149.4.1633. PMC 1460268. PMID 9691025.
- ^ Raser JM, O'Shea EK (September 2005). "Noise in gene expression: origins, consequences, and control". Science. 309 (5743): 2010–3. Bibcode:2005Sci...309.2010R. doi:10.1126/science.1105891. PMC 1360161. PMID 16179466.
- ^ Elowitz MB, Leibler S (January 2000). "A synthetic oscillatory network of transcriptional regulators". Nature. 403 (6767): 335–8. Bibcode:2000Natur.403..335E. doi:10.1038/35002125. PMID 10659856. S2CID 41632754.
- ^ Gardner TS, Cantor CR, Collins JJ (January 2000). "Construction of a genetic toggle switch in Escherichia coli". Nature. 403 (6767): 339–42. Bibcode:2000Natur.403..339G. doi:10.1038/35002131. PMID 10659857. S2CID 345059.
- ^ Gillespie DT (1976). "A general method for numerically simulating the stochastic time evolution of coupled chemical reactions". J. Comput. Phys. 22 (4): 403–34. Bibcode:1976JCoPh..22..403G. doi:10.1016/0021-9991(76)90041-3.
- ^ Roussel MR, Zhu R (December 2006). "Validation of an algorithm for delay stochastic simulation of transcription and translation in prokaryotic gene expression". Physical Biology. 3 (4): 274–84. Bibcode:2006PhBio...3..274R. doi:10.1088/1478-3975/3/4/005. PMID 17200603.
- ^ Ribeiro A, Zhu R, Kauffman SA (November 2006). "A general modeling strategy for gene regulatory networks with stochastic dynamics". Journal of Computational Biology. 13 (9): 1630–9. doi:10.1089/cmb.2006.13.1630. PMID 17147485. S2CID 6629364.
- ^ Zabet NR, Chu DF (June 2010). "Computational limits to binary genes". Journal of the Royal Society, Interface. 7 (47): 945–54. doi:10.1098/rsif.2009.0474. PMC 2871807. PMID 20007173.
- ^ Chu DF, Zabet NR, Hone AN (May–June 2011). "Optimal parameter settings for information processing in gene regulatory networks" (PDF). Bio Systems. 104 (2–3): 99–108. doi:10.1016/j.biosystems.2011.01.006. PMID 21256918.
- ^ Zabet NR (September 2011). "Negative feedback and physical limits of genes". Journal of Theoretical Biology. 284 (1): 82–91. arXiv:1408.1869. doi:10.1016/j.jtbi.2011.06.021. PMID 21723295. S2CID 14274912.
- ^ Ribeiro AS, Lloyd-Price J (March 2007). "SGN Sim, a stochastic genetic networks simulator". Bioinformatics. 23 (6): 777–9. doi:10.1093/bioinformatics/btm004. PMID 17267430.
- ^ Kaznessis YN (November 2007). "Models for synthetic biology". BMC Systems Biology. 1: 47. doi:10.1186/1752-0509-1-47. PMC 2194732. PMID 17986347.
- ^ "The DREAM Project". Columbia University Center for Multiscale Analysis Genomic and Cellular Networks (MAGNet).
- ^ Gustafsson M, Hörnquist M (February 2010). "Gene expression prediction by soft integration and the elastic net-best performance of the DREAM3 gene expression challenge". PLOS ONE. 5 (2): e9134. Bibcode:2010PLoSO...5.9134G. doi:10.1371/journal.pone.0009134. PMC 2821917. PMID 20169069.
- ^ Smith MR, Clement M, Martinez T, Snell Q (2010). "Time Series Gene Expression Prediction using Neural Networks with Hidden Layers" (PDF). Proceedings of the 7th Biotechnology and Bioinformatics Symposium (BIOT 2010). pp. 67–69.
- ^ Gnanakkumaar, Perumal; Murugesan, Ram; Ahmed, Shiek S. S. J. (4 September 2019). "Gene Regulatory Networks in Peripheral Mononuclear Cells Reveals Critical Regulatory Modules and Regulators of Multiple Sclerosis". Scientific Reports. 9 (1): 12732. Bibcode:2019NatSR...912732G. doi:10.1038/s41598-019-49124-x. PMC 6726613. PMID 31484947.
Further reading[]
- Bolouri H, Bower JM (2001). Computational modeling of genetic and biochemical networks. Cambridge, Mass: MIT Press. ISBN 978-0-262-02481-5.
- Kauffman SA (March 1969). "Metabolic stability and epigenesis in randomly constructed genetic nets". Journal of Theoretical Biology. 22 (3): 437–67. doi:10.1016/0022-5193(69)90015-0. PMID 5803332.
External links[]
- Plant Transcription Factor Database and Plant Transcriptional Regulation Data and Analysis Platform
- Open source web service for GRN analysis
- BIB: Yeast Biological Interaction Browser
- Graphical Gaussian models for genome data – Inference of gene association networks with GGMs
- A bibliography on learning causal networks of gene interactions – regularly updated, contains hundreds of links to papers from bioinformatics, statistics, machine learning.
- https://web.archive.org/web/20060907074456/http://mips.gsf.de/proj/biorel/ BIOREL is a web-based resource for quantitative estimation of the gene network bias in relation to available database information about gene activity/function/properties/associations/interactio.
- Evolving Biological Clocks using Genetic Regulatory Networks – Information page with model source code and Java applet.
- Engineered Gene Networks
- Tutorial: Genetic Algorithms and their Application to the Artificial Evolution of Genetic Regulatory Networks
- BEN: a web-based resource for exploring the connections between genes, diseases, and other biomedical entities
- Global protein-protein interaction and gene regulation network of Arabidopsis thaliana
- Gene expression
- Networks
- Systems biology
- Evolutionary developmental biology