Great Pacific garbage patch

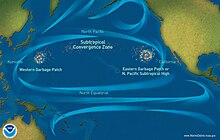
The Great Pacific garbage patch (also Pacific trash vortex) is a garbage patch, a gyre of marine debris particles, in the central North Pacific Ocean. It is located roughly from 135°W to 155°W and 35°N to 42°N.[1] The collection of plastic and floating trash originates from the Pacific Rim, including countries in Asia, North America, and South America.[2] The gyre is divided into two areas, the "Eastern Garbage Patch" from California to Hawaii, and the "Western Garbage Patch" extending from Hawaii to Japan.
Despite the common public perception of the patch existing as giant islands of floating garbage, its low density (4 particles per cubic metre (3.1/cu yd)) prevents detection by satellite imagery, or even by casual boaters or divers in the area. This is because the patch is a widely dispersed area consisting primarily of suspended "fingernail-sized or smaller"—often microscopic—particles in the upper water column known as microplastics.[3] Researchers from The Ocean Cleanup project claimed that the patch covers 1.6 million square kilometres (620 thousand square miles).[4] Some of the plastic in the patch is over 50 years old, and includes items (and fragments of items) such as "plastic lighters, toothbrushes, water bottles, pens, baby bottles, cell phones, plastic bags, and nurdles." The small fibers of wood pulp found throughout the patch are "believed to originate from the thousands of tons of toilet paper flushed into the oceans daily."[3]
Research indicates that the patch is rapidly accumulating.[5] The patch is believed to have increased "10-fold each decade" since 1945.[6] Estimated to be double the size of Texas, the area contains more than 3 million short tons (2.7 million metric tons) of plastic.[7] The gyre contains approximately six pounds of plastic for every pound of plankton.[8] A similar patch of floating plastic debris is found in the Atlantic Ocean, called the North Atlantic garbage patch.[9][10] This growing patch contributes to other environmental damage to marine ecosystems and species.
History[]
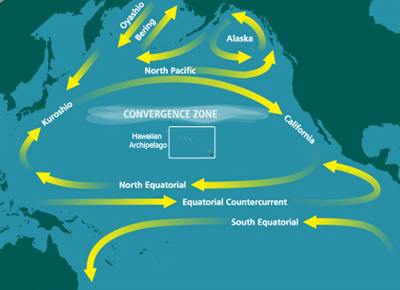
The patch was described in a 1988 paper published by the National Oceanic and Atmospheric Administration (NOAA). The description was based on research by several Alaska-based researchers in 1988 who measured neustonic plastic in the North Pacific Ocean.[11] Researchers found relatively high concentrations of marine debris accumulating in regions governed by ocean currents. Extrapolating from findings in the Sea of Japan, the researchers hypothesized that similar conditions would occur in other parts of the Pacific where prevailing currents were favorable to the creation of relatively stable waters. They specifically indicated the North Pacific Gyre.[12]
Charles J. Moore, returning home through the North Pacific Gyre after competing in the Transpacific Yacht Race in 1997, claimed to have come upon an enormous stretch of floating debris. Moore alerted the oceanographer Curtis Ebbesmeyer, who subsequently dubbed the region the "Eastern Garbage Patch" (EGP).[13] The area is frequently featured in media reports as an exceptional example of marine pollution.[14]
The JUNK Raft Project was a 2008 trans-Pacific sailing voyage made to highlight the plastic in the patch, organized by the Algalita Marine Research Foundation.[15][16][17]
In 2009, two project vessels from Project Kaisei/Ocean Voyages Institute; the New Horizon and the Kaisei, embarked on a voyage to research the patch and determine the feasibility of commercial scale collection and recycling.[18] The Scripps Institute of Oceanography's 2009 SEAPLEX expedition in part funded by Ocean Voyages Institute/Project Kaisei[19] also researched the patch. Researchers were also looking at the impact of plastic on mesopelagic fish, such as lanternfish.[20][21]
In 2010, Ocean Voyages Institute conducted a 30-day expedition in the gyre which continued the science from the 2009 expeditions and tested prototype cleanup devices.[22]
in July/August 2012 Ocean Voyages Institute conducted a voyage from San Francisco to the Eastern limits of the North Pacific Gyre north, (ultimately ending in Richmond British Columbia) and then made a return voyage which also visited the Gyre. The focus on this expedition was surveying the extent of tsunami debris from the Japanese earthquake-tsunami.[23][24]
Sources of the plastic[]
In 2015, a study published in the journal Science sought to discover where exactly all of this garbage is coming from. According to the researchers, the discarded plastics and other debris floats eastward out of countries in Asia from six primary sources: China, Indonesia, the Philippines, Vietnam, Sri Lanka and Thailand.[25][26] In fact, the Ocean Conservancy reported that China, Indonesia, Philippines, Thailand, and Vietnam dump more plastic in the sea than all other countries combined.[27] China alone is responsible for 30% of worldwide plastic ocean pollution (China has approximately 18% of the world's population).[28] Efforts to slow land generated debris and consequent marine debris accumulations have been undertaken by the Coastal Conservancy, Earth Day, and World Cleanup Day.[29][30][31][32]
According to National Geographic, "80 percent of plastic in the ocean is estimated to come from land-based sources, with the remaining 20 percent coming from boats and other marine sources. These percentages vary by region, however. A 2018 study found that synthetic fishing nets made up nearly half the mass of the Great Pacific Garbage Patch, due largely to ocean current dynamics and increased fishing activity in the Pacific Ocean."[33][34]
In September 2019, when research revealed that much ocean plastic pollution comes from Chinese cargo ships,[35] an Ocean Cleanup spokesperson said: "Everyone talks about saving the oceans by stopping using plastic bags, straws and single-use packaging. That's important, but when we head out on the ocean, that's not necessarily what we find."[36]
Constitution[]
The Great Pacific garbage patch formed gradually as a result of ocean or marine pollution gathered by ocean currents.[37] It occupies a relatively stationary region of the North Pacific Ocean bounded by the North Pacific Gyre in the horse latitudes. The gyre's rotational pattern draws in waste material from across the North Pacific, incorporating coastal waters off North America and Japan. As the material is captured in the currents, wind-driven surface currents gradually move debris toward the center, trapping it.
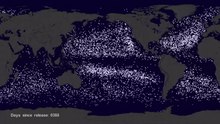
In a 2014 study[38] researchers sampled 1571 locations throughout the world's oceans and determined that discarded fishing gear such as buoys, lines and nets accounted for more than 60%[38] of the mass of plastic marine debris. According to a 2011 EPA report, "The primary source of marine debris is the improper waste disposal or management of trash and manufacturing products, including plastics (e.g., littering, illegal dumping) ... Debris is generated on land at marinas, ports, rivers, harbors, docks, and storm drains. Debris is generated at sea from fishing vessels, stationary platforms, and cargo ships."[39] Constituents range in size from miles-long abandoned fishing nets to micro-pellets used in cosmetics and abrasive cleaners.[40] A computer model predicts that a hypothetical piece of debris from the U.S. west coast would head for Asia, and return to the U.S. in six years;[13] debris from the east coast of Asia would reach the U.S. in a year or less.[41][42] While microplastics make up 94% of the estimated 1.8 trillion plastic pieces, they amount to only 8% of the 79,000 metric tons of plastic there, with most of the rest coming from the fishing industry.[43]
A 2017 study concluded that of the 9.1 billion tons of plastic produced since 1950, close to 7 billion tons are no longer in use.[44] The authors estimate that 9% was recycled, 12% was incinerated, and the remaining 5.5 billion tons are in the oceans and land.[44]
Size estimates[]
The size of the patch is indefinite, as is the precise distribution of debris because large items are uncommon.[45] Most debris consists of small plastic particles suspended at or just below the surface, evading detection by aircraft or satellite. Instead, the size of the patch is determined by sampling. Estimates of size range from 700,000 square kilometres (270,000 sq mi) (about the size of Texas) to more than 15,000,000 square kilometres (5,800,000 sq mi) (about the size of Russia). Such estimates, however, are conjectural given the complexities of sampling and the need to assess findings against other areas. Further, although the size of the patch is determined by a higher-than-normal degree of concentration of pelagic debris, there is no standard for determining the boundary between "normal" and "elevated" levels of pollutants to provide a firm estimate of the affected area.
Net-based surveys are less subjective than direct observations but are limited regarding the area that can be sampled (net apertures 1–2 m and ships typically have to slow down to deploy nets, requiring dedicated ship's time). The plastic debris sampled is determined by net mesh size, with similar mesh sizes required to make meaningful comparisons among studies. Floating debris typically is sampled with a neuston or manta trawl net lined with 0.33 mm mesh. Given the very high level of spatial clumping in marine litter, large numbers of net tows are required to adequately characterize the average abundance of litter at sea. Long-term changes in plastic meso-litter have been reported using surface net tows: in the North Pacific Subtropical Gyre in 1999, plastic abundance was 335,000 items/km2 and 5.1 kg/km2, roughly an order of magnitude greater than samples collected in the 1980s. Similar dramatic increases in plastic debris have been reported off Japan. However, caution is needed in interpreting such findings, because of the problems of extreme spatial heterogeneity, and the need to compare samples from equivalent water masses, which is to say that, if an examination of the same parcel of water a week apart is conducted, an order of magnitude change in plastic concentration could be observed.[46]
— Ryan et al
In August 2009, the Scripps Institution of Oceanography/Project Kaisei SEAPLEX survey mission of the Gyre found that plastic debris was present in 100 consecutive samples taken at varying depths and net sizes along a path of 1,700 miles (2,700 km) through the patch. The survey found that, although the patch contains large pieces, it is on the whole made up of smaller items that increase in concentration toward the gyre's centre, and these 'confetti-like' pieces that are visible just beneath the surface suggests the affected area may be much smaller.[46][48][49] 2009 data collected from Pacific albatross populations suggest the presence of two distinct debris zones.[50]
In March 2018, The Ocean Cleanup published a paper summarizing their findings from the Mega- (2015) and Aerial Expedition (2016). In 2015, the organization crossed the Great Pacific garbage patch with 30 vessels, to make observations and take samples with 652 survey nets. They collected a total of 1.2 million pieces, which they counted and categorized into their respective size classes. In order to also account for the larger, but more rare debris, they also overflew the patch in 2016 with a C-130 Hercules aircraft, equipped with LiDAR sensors. The findings from the two expeditions, found that the patch covers 1.6 million square kilometers with a concentration of 10–100 kilograms per square kilometer. They estimate an 80,000 metric tons in the patch, with 1.8 trillion plastic pieces, out of which 92% of the mass is to be found in objects larger than 0.5 centimeters.[51][52][5]
NOAA stated:
While "Great Pacific Garbage Patch" is a term often used by the media, it does not paint an accurate picture of the marine debris problem in the North Pacific Ocean. The name "Pacific Garbage Patch" has led many to believe that this area is a large and continuous patch of easily visible marine debris items such as bottles and other litter – akin to a literal island of trash that should be visible with satellite or aerial photographs. This is not the case.
— Ocean Facts, National Ocean Service[53]
In a 2001 study, researchers[54] found concentrations of plastic particles at 334,721 pieces per km2 with a mean mass of 5.1 kg (11.3 lbs) per km2, in the neuston. The overall concentration of plastics was seven times greater than the concentration of zooplankton in many of the sampled areas. Samples collected deeper in the water column found much lower concentrations of plastic particles (primarily monofilament fishing line pieces).[55]
Environmental issues[]
Debris removal[]
The 2012 Algalita/5 Gyres Asia Pacific Expedition began in the Marshall Islands on 1 May, investigated the patch, collecting samples for the 5 Gyres Institute, Algalita Marine Research Foundation, and several other institutions, including NOAA, Scripps, IPRC and Woods Hole Oceanographic Institute. In 2012, the Sea Education Association (SEA) conducted research expeditions in the gyre. One hundred and eighteen net tows were conducted and nearly 70,000 pieces of plastic were counted.[56]
In 2012, researchers Goldstein, Rosenberg and Cheng found that microplastic concentrations in the gyre had increased by two orders of magnitude in the prior four decades.[57]
On 11 April 2013, artist Maria Cristina Finucci founded The Garbage Patch State at UNESCO – Paris[58] in front of Director General Irina Bokova.[59]
On 9 September 2018, the first collection system was deployed to the gyre to begin the collection task.[60] This initial trial run of the Ocean Cleanup Project started towing its "Ocean Cleanup System 001" from San Francisco to a trial site some 240 nautical miles (260 miles) away.[61] The initial trial of the "Ocean Cleanup System 001" ran for four months and provided the research team with valuable information relevant to the designing of the "System 001/B".[62]
In 2021, The Ocean Cleanup collected 63,182 pounds (28,658 kg) of plastic using their "System 002". The mission started in July 2021 and concluded on October 14, 2021. [63]
See also[]
- Ecosystem of the North Pacific Subtropical Gyre
- Indian Ocean garbage patch
- North Atlantic garbage patch
- Ocean Conservancy
- Plastisphere
- South Pacific garbage patch
- World Cleanup Day
References[]
Notes
- ^ See the relevant sections below for specific references concerning the discovery and history of the patch. A general overview is provided in Dautel, Susan L. "Transoceanic Trash: International and United States Strategies for the Great Pacific Garbage Patch", 3 Golden Gate U. Envtl. L.J. 181 (2007).
- ^ "World's largest collection of ocean garbage is twice the size of Texas". USA Today. Retrieved 29 April 2018.
- ^ a b Philp, Richard B. (2013). Ecosystems and Human Health: Toxicology and Environmental Hazards, Third Edition. CRC Press. p. 116. ISBN 978-1466567214.
- ^ Albeck-Ripka, Livia (22 March 2018). "The 'Great Pacific Garbage Patch' Is Ballooning, 87,000,000,000 Tons of Plastic and Counting". The New York Times. ISSN 0362-4331. Retrieved 26 February 2020.
- ^ a b Lebreton, L.; Slat, B.; Ferrari, F.; Sainte-Rose, B.; Aitken, J.; Marthouse, R.; Hajbane, S.; Cunsolo, S.; Schwarz, A. (22 March 2018). "Evidence that the Great Pacific Garbage Patch is rapidly accumulating plastic". Scientific Reports. 8 (1): 4666. Bibcode:2018NatSR...8.4666L. doi:10.1038/s41598-018-22939-w. ISSN 2045-2322. PMC 5864935. PMID 29568057.
- ^ Maser, Chris (2014). Interactions of Land, Ocean and Humans: A Global Perspective. CRC Press. pp. 147–48. ISBN 978-1482226393.
- ^ "Congress acts to clean up the ocean – A garbage patch in the Pacific is at least triple the size of Texas, but some estimates put it larger than the continental United States". The Christian Science Monitor. Archived from the original on 5 October 2008. Retrieved 10 October 2008.
- ^ "Great Pacific garbage patch: Plastic turning vast area of ocean into ecological nightmare". Santa Barbara News-Press. Archived from the original on 12 September 2015. Retrieved 13 October 2008.
- ^ Lovett, Richard A. (2 March 2010). "Huge Garbage Patch Found in Atlantic Too". National Geographic News. National Geographic Society.
- ^ Victoria Gill (24 February 2010). "Plastic rubbish blights Atlantic Ocean". BBC. Retrieved 16 March 2010.
- ^ Day, Robert H.; Shaw, David G.; Ignell, Steven E. (1988). "The Quantitative Distribution and Characteristics of Neuston Plastic in the North Pacific Ocean, 1985–88. (Final Report to U.S. Department of Commerce, National Marine Fisheries Service, Auke Bay Laboratory. Auke Bay, Alaska)" (PDF). pp. 247–66.
- ^ "After entering the ocean, however, neuston plastic is redistributed by currents and winds. For example, plastic entering the ocean in Korea is moved eastward by the Subarctic Current (in Subarctic Water) and the Kuroshio (in Transitional Water, Kawai 1972; Favorite et al. 1976; Nagata et al. 1986). In this way, the plastic is transported from high-density areas to low-density areas. In addition to this eastward movement, Ekman stress from winds tends to move surface waters from the subarctic and the subtropics toward the Transitional Water mass as a whole (see Roden 1970: fig. 5). Because of the convergent nature of this Ekman flow, densities tend to be high in Transitional Water. Also, the generally convergent nature of water in the North Pacific Central Gyre (Masuzawa 1972) should result in high densities there also." (Day, et al. 1988, p. 261) (Emphasis added)
- ^ a b Moore, Charles (November 2003). "Natural History Magazine". www.naturalhistorymag.com. Retrieved 17 September 2021.
- ^ Berton, Justin (19 October 2007). "Continent-size toxic stew of plastic trash fouling swath of Pacific Ocean". San Francisco Chronicle. p. W-8. Archived from the original on 21 October 2007. Retrieved 22 October 2007.
- ^ Yap, Britt (28 August 2008). "A raft made of junk crosses Pacific in 3 months". USA Today. Archived from the original on 30 September 2009. Retrieved 30 September 2009.
- ^ "Raft made of junk bottles crosses Pacific". NBC News. 28 August 2008. Retrieved 30 September 2009.
- ^ Jeavans, Christine (20 August 2008). "Mid-ocean dinner date saves rower". BBC News. Archived from the original on 30 September 2009. Retrieved 30 September 2009.
- ^ Walsh, Bryan (1 August 2009). "Expedition Sets Sail to the Great Plastic Vortex". Time. Archived from the original on 4 August 2009. Retrieved 2 August 2009.
- ^ Goldstein Miriam C.; Rosenberg Marci; Cheng Lanna (2012). "Increased oceanic microplastic debris enhances oviposition in an endemic pelagic insect". Biology Letters. 8 (5): 817–20. doi:10.1098/rsbl.2012.0298. PMC 3440973. PMID 22573831.
- ^ Alison Cawood (12 August 2009). "SEAPLEX Day 11 Part 1: Midwater Fish". SEAPLEX. Archived from the original on 8 October 2009. Retrieved 2 June 2016.CS1 maint: unfit URL (link)
- ^ "Scientists Find 'Great Pacific Ocean Garbage Patch'" (Press release). National Science Foundation. 27 August 2009. Archived from the original on 23 April 2012. Retrieved 8 August 2013. Alt URL
- ^ Schwartz, Ariel (19 November 2010). "This Is What It's Like to Sail in the Pacific Trash Vortex". Fast Company.
- ^ "Pacific Ocean garbage mostly from home, not Japan tsunami". Canadian Broadcast News.
- ^ Bigmuddygirl (14 August 2012). "Plastic problem plagues Pacific, researchers say". Plastic Soup News.
- ^ "Where did the trash in the Great Pacific Garbage Patch come from? How do we stop it?". USA Today.
- ^ Law, Kara Lavender; Narayan, Ramani; Andrady, Anthony; Perryman, Miriam; Siegler, Theodore R.; Wilcox, Chris; Geyer, Roland; Jambeck, Jenna R. (13 February 2015). "Plastic waste inputs from land into the ocean". Science. 347 (6223): 768–71. Bibcode:2015Sci...347..768J. doi:10.1126/science.1260352. PMID 25678662. S2CID 206562155.
- ^ Hannah Leung (21 April 2018). "Five Asian Countries Dump More Plastic into Oceans Than Anyone Else Combined: How You Can Help". Forbes. Retrieved 23 June 2019.
China, Indonesia, Philippines, Thailand, and Vietnam are dumping more plastic into oceans than the rest of the world combined, according to a 2017 report by Ocean Conservancy
- ^ Will Dunham (12 February 2019). "World's Oceans Clogged by Millions of Tons of Plastic Trash". Scientific American. Retrieved 31 July 2019.
China was responsible for the most ocean plastic pollution per year with an estimated 2.4 million tons, about 30 percent of the global total, followed by Indonesia, the Philippines, Vietnam, Sri Lanka, Thailand, Egypt, Malaysia, Nigeria and Bangladesh.
- ^ "500,000 Volunteers Take Part in Earth Day 2019 Cleanup". Earth Day Network. 26 April 2019.
- ^ "Our progress so far..." TIDES. Ocean Conservancy.
- ^ "Earth Day Network Launches Great Global Clean Up". snews (Press release). 4 April 2019.
- ^ Olivia Rosane (12 September 2018). "Cleanup Day Is Saturday Around the World: Here's How to Help". EcoWatch.
- ^ Society, National Geographic (5 July 2019). "Great Pacific Garbage Patch". National Geographic Society. Retrieved 10 June 2020.
- ^ Lebreton, L.; Slat, B.; Ferrari, F.; Sainte-Rose, B.; Aitken, J.; Marthouse, R.; Hajbane, S.; Cunsolo, S.; Schwarz, A.; Levivier, A.; Noble, K. (22 March 2018). "Evidence that the Great Pacific Garbage Patch is rapidly accumulating plastic". Scientific Reports. 8 (1): 4666. Bibcode:2018NatSR...8.4666L. doi:10.1038/s41598-018-22939-w. ISSN 2045-2322. PMC 5864935. PMID 29568057.
Over three-quarters of the GPGP mass was carried by debris larger than 5 cm and at least 46% was comprised of fishing nets.
- ^ Ryan, Peter G.; Dilley, Ben J.; Ronconi, Robert A.; Connan, Maëlle (25 September 2019). "Rapid increase in Asian bottles in the South Atlantic Ocean indicates major debris inputs from ships". Proceedings of the National Academy of Sciences. 116 (42): 20892–97. Bibcode:2019PNAS..11620892R. doi:10.1073/pnas.1909816116. PMC 6800376. PMID 31570571.
- ^ "Ocean plastic waste probably comes from ships, report says". Agence France-Presse. 16 January 2012.
- ^ For this and what follows, see Karl, David M. (May–June 1999). "A Sea of Change: Biogeochemical Variability in the North Pacific Subtropical Gyre". Ecosystems. 2 (3): 181–214. doi:10.1007/s100219900068. S2CID 46309501. For gyres generally, see Sverdrup HU, Johnson MW, Fleming RH (1946). The oceans, their physics, chemistry, and general biology. New York: Prentice-Hall.
- ^ a b Eriksen, Marcus; Lebreton, Laurent C. M.; Carson, Henry S.; Thiel, Martin; Moore, Charles J.; Borerro, Jose C.; Galgani, Francois; Ryan, Peter G.; Reisser, Julia (10 December 2014). "Plastic Pollution in the World's Oceans: More than 5 Trillion Plastic Pieces Weighing over 250,000 Tons Afloat at Sea". PLOS ONE. 9 (12). e111913. Bibcode:2014PLoSO...9k1913E. doi:10.1371/journal.pone.0111913. ISSN 1932-6203. PMC 4262196. PMID 25494041.
- ^ "Marine Debris in the North Pacific: A Summary of Existing Information and Identification of Data Gaps" (PDF). US Environmental Protection Agency. November 2011. Archived from the original (PDF) on 14 January 2016.
- ^ Ferris, David (May–June 2009). "Message in a bottle". Sierra. San Francisco: Sierra Club. Retrieved 13 August 2009.
- ^ Faris, J.; Hart, K. (1994). "Seas of Debris: A Summary of the Third International Conference on Marine Debris". N.C. Sea Grant College Program and NOAA. Cite journal requires
|journal=(help) - ^ "Garbage Mass Is Growing in the Pacific". NPR. 28 March 2008. Cite journal requires
|journal=(help) - ^ Parker, Laura (22 March 2018). "The Great Pacific Garbage Patch Isn't What You Think it Is". National Geographic News.
- ^ a b "Plastic pollution threatens to smother our planet". NewsComAu. Retrieved 21 July 2017.
- ^ Brassey, Dr Charlotte (16 July 2017). "A mission to the Pacific plastic patch". BBC News. Retrieved 21 July 2017.
- ^ a b Ryan, P. G.; Moore, C. J.; Van Franeker, J. A.; Moloney, C. L. (2009). "Monitoring the abundance of plastic debris in the marine environment". Philosophical Transactions of the Royal Society B: Biological Sciences. 364 (1526): 1999–2012. doi:10.1098/rstb.2008.0207. JSTOR 40485978. PMC 2873010. PMID 19528052.
- ^ "Great Pacific Garbage Patch". Marine Debris Division – Office of Response and Restoration. NOAA. 11 July 2013. Archived from the original on 17 April 2014. Retrieved 2 September 2019.
- ^ "OSU: Reports of giant ocean 'garbage patch' are exaggerated". KATU.com. Associated Press. 4 January 2011. Archived from the original on 14 February 2011.
- ^ "Oceanic 'garbage patch' not nearly as big as portrayed in media". Newsroom. Oregon State University. 4 January 2011.
- ^ Young, Lindsay C.; Vanderlip, Cynthia; Duffy, David C.; Afanasyev, Vsevolod; Shaffer, Scott A. (2009). Ropert-Coudert, Yan (ed.). "Bringing Home the Trash: Do Colony-Based Differences in Foraging Distribution Lead to Increased Plastic Ingestion in Laysan Albatrosses?". PLOS ONE. 4 (10): e7623. Bibcode:2009PLoSO...4.7623Y. doi:10.1371/journal.pone.0007623. PMC 2762601. PMID 19862322.
- ^ "The Great Pacific Garbage Patch". The Ocean Cleanup. Retrieved 8 May 2018.
- ^ Lebreton, Laurent (22 March 2018). "The Exponential Increase of the Great Pacific Garbage Patch". The Ocean Cleanup. Retrieved 8 May 2018.
- ^ "What is the Great Pacific Garbage Patch?". National Ocean Service. NOAA. Retrieved 25 August 2017.
- ^ Moore, Charles (November 2003). "Across the Pacific Ocean, plastics, plastics, everywhere". Natural History Magazine.
- ^ Moore, C.J; Moore, S.L; Leecaster, M.K; Weisberg, S.B (2001). "A Comparison of Plastic and Plankton in the North Pacific Central Gyre". Marine Pollution Bulletin. 42 (12): 1297–300. doi:10.1016/S0025-326X(01)00114-X. PMID 11827116.
- ^ Emelia DeForce (9 November 2012). "The Final Science Report". Plastics at SEA North Pacific Expedition. Sea Education Association.
- ^ Goldstein, M. C.; Rosenberg, M.; Cheng, L. (2012). "Increased oceanic microplastic debris enhances oviposition in an endemic pelagic insect". Biology Letters. 8 (5): 817–20. doi:10.1098/rsbl.2012.0298. PMC 3440973. PMID 22573831.
- ^ "The garbage patch territory turns into a new state". United Nations Educational, Scientific and Cultural Organization. 22 May 2019.
- ^ "Rifiuti diventano stato, Unesco riconosce 'Garbage Patch'". SITI. L'Associazione Città e Siti Italiani – Patrimonio Mondiale UNESCO. ISSN 2038-7237. Archived from the original on 3 November 2014 – via rivistasitiunesco.it.
- ^ Lavars, Nick (17 October 2018). "Ocean Cleanup system installed and ready for work at the Great Pacific Garbage Patch". newatlas.com.
- ^ Dent, Steve (11 September 2018). "A project to remove 88,000 tons of plastic from the Pacific has begun". Engadget.
- ^ "System 001". The Ocean Cleanup. Retrieved 17 September 2021.
- ^ "More than 63,000 pounds of trash removed from one of the biggest accumulations of ocean plastic in the world". www.cbsnews.com. Retrieved 5 November 2021.
Further reading
- Oliver J. Dameron; Michael Parke; Mark A. Albins; Russell Brainard (April 2007). "Marine debris accumulation in the Northwestern Hawaiian Islands: An examination of rates and processes". Marine Pollution Bulletin. 54 (4): 423–33. doi:10.1016/j.marpolbul.2006.11.019. PMID 17217968.
- Rei Yamashita; Atsushi Tanimura (2007). "Floating plastic in the Kuroshio Current area, western North Pacific Ocean". Marine Pollution Bulletin. 54 (4): 485–88. doi:10.1016/j.marpolbul.2006.11.012. PMID 17275038.
- Masahisa Kubota; Katsumi Takayama; Noriyuki Horii (2000). "Movement and accumulation of floating marine debris simulated by surface currents derived from satellite data" (PDF). School of Marine Science and Technology, Tokai University.
- Gregory, M.R.; Ryan, P.G. (1997). "Pelagic plastics and other seaborne persistent synthetic debris: a review of Southern Hemisphere perspectives". In Coe, J.M.; Rogers, D.B. (eds.). Marine Debris: Sources, Impacts, Solutions. New York: Springer-Verlag. pp. 49–66.
- Moore, Charles G.; Phillips, Cassandra (2011). Plastic Ocean. Penguin Group. ISBN 978-1452601465.
- Density of plastic particles found in zooplankton trawls from coastal waters of California to the North Pacific Central Gyre – Charles J Moore, Gwen L Lattin and Ann F Zellers (2005)
- H. Day, Robert; Shaw, David; E. Ignell, Steven (1 January 1990). "The quantitative distribution and characteristics of neuston plastic in the North Pacific Ocean, 19841988" (PDF). Cite journal requires
|journal=(help) - Morton, Thomas (2007). "Oh, This is Great, Humans Have Finally Ruined the Ocean". Vice magazine. Vol. 6 no. 2. pp. 78–81. Archived from the original on 25 July 2008.
- Hohn, Donovan (2011). Moby-Duck: The True Story of 28,800 Bath Toys Lost at Sea. Viking. ISBN 978-0670022199.
- Hoshaw, Lindsey (9 November 2009). "Afloat in the Ocean, Expanding Islands of Trash". The New York Times. Retrieved 10 November 2009.
- Newman, Patricia (2014). Plastic, Ahoy!: Investigating the Great Pacific Garbage Patch. Millbrook Press. ISBN 978-1467725415.
External links[]
| Wikimedia Commons has media related to Great Pacific Garbage Patch. |
- Pacific Garbage Patch – Smithsonian Ocean Portal
- "Plastic Surf" The Unhealthful Afterlife of Toys and Packaging: Small remnants of toys, bottles and packaging persist in the ocean, harming marine life and possibly even us by Jennifer Ackerman, Scientific American August 2010
- Plastic Paradise Movie – independent documentary by Angela Sun uncovering the mystery of the Great Pacific Garbage Patch known as the Plastic Paradise
- The source of the garbage patches, pictures
- Irish Examiner article
- Mega Expedition Departs Honolulu on YouTube
- Midway, a plastic island on YouTube
- Climate change, meet your apocalyptic twin: oceans poisoned by plastic. Public Radio International. 13 December 2016
- By 2050, the oceans could have more plastic than fish. Business Insider. 27 January 2017.
- The Ocean Cleanup. "Scientific publications". Retrieved 21 October 2018.
- Dunning, Brian (16 December 2008). "Skeptoid #132: The Sargasso Sea and the Pacific Garbage Patch". Skeptoid.
- "The Ocean Cleanup in One Year".
- L. Lebreton (2017). "Evidence that the Great Pacific Garbage Patch is rapidly accumulating plastic". Scientific Reports (1st ed.). 8 (1): 4666. doi:10.1038/s41598-018-22939-w. PMC 5864935. PMID 29568057.
Coordinates: 38°N 145°W / 38°N 145°W

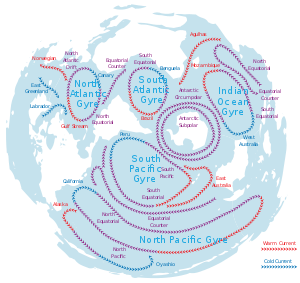
Ocean currents and gyres | |||||||||||
|---|---|---|---|---|---|---|---|---|---|---|---|
| Currents |
| ||||||||||
| Gyres |
| ||||||||||
| Related | |||||||||||
- Marine garbage patches
- Pacific Ocean
- Plastics and the environment