Indian Ocean garbage patch
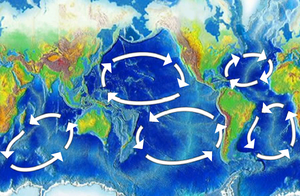

The Indian Ocean garbage patch, discovered in 2010, is a marine garbage patch, a gyre of marine litter, suspended in the upper water column of the central Indian Ocean, specifically the Indian Ocean Gyre, one of the five major oceanic gyres.[1][2][3][4][5][6] The patch does not appear as a continuous debris field. As with other patches in each of the five oceanic gyres, the plastics in it break down to ever smaller particles, and to constituent polymers.[7] As with the other patches, the field constitutes an elevated level of pelagic plastics, chemical sludge, and other debris; primarily particles that are invisible to the naked eye. The concentration of particle debris has been estimated to be approximately 10,000 particles per square kilometer.[8][9][10][11]
Discovery[]
The existence of the Great Pacific garbage patch, the first to be discovered, was predicted in a 1988 paper published by the National Oceanic and Atmospheric Administration (NOAA) of the United States. The prediction was based on results obtained by several Alaska-based researchers between 1985 and 1988 that measured neustonic plastic in the North Pacific Ocean.[12]
Research studying trash washed onto beaches in and around the Indian Ocean suggested that there would be plastics found in the water column in the Indian Ocean as well.[3]
In 2010, the 5 Gyres Project set off on the first of its planned series of transoceanic voyages to determine whether the South Atlantic, South Pacific, and Indian Ocean gyres were affected in the same way as the North Pacific and North Atlantic gyres.[2][3][5][6] On the Indian Ocean leg of their trip, they travelled between Perth, Australia, and Port Louis, Mauritius (east of Madagascar); each of the water samples they collected in the 4,800 km (3,000 mi) between contained plastic.[3] They found that the South Atlantic, South Pacific, and Indian Ocean gyres were affected in the same way as the North Pacific and North Atlantic gyres.[2][3][5][6] Anna Cummins, cofounder of 5 Gyres Institute called the pollution they found "a thin plastic soup".[3]
Sources[]
Of the top 10 ocean plastic polluters (of which China is No.1 worldwide with 30%), the Indian Ocean features five: Indonesia (No. 2); Sri Lanka (No.5); Thailand (No. 6); Malaysia (No. 8), and Bangladesh (No. 10).[13]
Ten rivers carry 90% of the total plastic pollution in the oceans. Of these, two are in the Indian Ocean: the Indus (No. 2 worldwide with most plastic) and Ganges (No. 6).[14][15]
Action for creating awareness[]
On April 11, 2013, in order to create awareness, artist Maria Cristina Finucci founded the garbage patch state at UNESCO[16] – Paris, in front of Director General Irina Bokova, the first of a series of events under the patronage of UNESCO and of Italian Ministry of the Environment.[17]
See also[]
References[]
- ^ "Ocean Geography ~ MarineBio Conservation Society". Retrieved 17 September 2021.
- ^ Jump up to: a b c First Voyage to South Atlantic Pollution Site SustainableBusiness.com News
- ^ Jump up to: a b c d e f New garbage patch discovered in Indian Ocean, Lori Bongiorno, Green Yahoo, 27 July 2010]
- ^ Opinion: Islands are 'natural nets' for plastic-choked seas Archived 6 October 2012 at the Wayback Machine Marcus Eriksen for CNN, Petroleum, CNN Tech 24 June 2010
- ^ Jump up to: a b c Our Ocean Backyard: Exploring plastic seas Archived 20 June 2010 at the Wayback Machine, Dan Haifley, 15 May 2010, Santa Cruz Sentinel
- ^ Jump up to: a b c Life aquatic choked by plastic 14 November 2010, Times Live
- ^ Moore, Charles (November 2003). "Across the Pacific Ocean, plastics, plastics, everywhere". Natural History Magazine. Archived from the original on 6 July 2009.
- ^ Sesini, Marzia (August 2011). "The Garbage Patch In The Oceans: The Problem And Possible Solutions" (PDF). Columbia University.
- ^ For a discussion of the current sampling techniques and particle size, see Peter Ryan, Charles Moore et al., Monitoring the abundance of plastic debris in the marine environment. Phil. Trans. R. Soc. B 27 July 2009 vol. 364 no. 1526 1999–2012, doi:10.1098/rstb.2008.0207
- ^ "Archived copy". Archived from the original on 14 February 2011. Retrieved 7 January 2011.CS1 maint: archived copy as title (link)
- ^ Transoceanic Trash: International and United States Strategies for the Great Pacific Garbage Patch, Susan L. Dautel, 3 Golden Gate U. Envtl. L.J. 181 (2009)
- ^ Day, Robert H.; Shaw, David G.; Ignell, Steven E. (April 1988). "Quantitative distribution and characteristics of neustonic plastic in the North Pacific Ocean. Final Report to US Department of Commerce, National Marine Fisheries Service, Auke Bay Laboratory. Auke Bay, AK" (PDF). pp. 247–266.
- ^ Will Dunham (12 February 2019). "World's Oceans Clogged by Millions of Tons of Plastic Trash". Scientific American. Retrieved 31 July 2019.
China was responsible for the most ocean plastic pollution per year with an estimated 2.4 million tons, about 30 percent of the global total, followed by Indonesia, the Philippines, Vietnam, Sri Lanka, Thailand, Egypt, Malaysia, Nigeria and Bangladesh.
- ^ Christian Schmidt; Tobias Krauth; Stephan Wagner (11 October 2017). "Export of Plastic Debris by Rivers into the Sea". Environmental Science & Technology. 51 (21): 12246–12253. Bibcode:2017EnST...5112246S. doi:10.1021/acs.est.7b02368. PMID 29019247.
The 10 top-ranked rivers transport 88–95% of the global load into the sea
- ^ Harald Franzen (30 November 2017). "Almost all plastic in the ocean comes from just 10 rivers". Deutsche Welle. Retrieved 18 December 2018.
It turns out that about 90 percent of all the plastic that reaches the world's oceans gets flushed through just 10 rivers: The Yangtze, the Indus, Yellow River, Hai River, the Nile, the Ganges, Pearl River, Amur River, the Niger, and the Mekong (in that order).
- ^ "The garbage patch territory turns into a new state". unesco.org. UNESCO Office in Venice. 11 April 2013. Retrieved 20 April 2018.
- ^ "Rifiuti diventano stato, Unesco riconosce 'Garbage Patch'". www.rivistasitiunesco.it (in Italian). 14 July 2014. Archived from the original on 14 July 2014.
Further reading[]
- Gregory, M.R.; Ryan, P.G. (1997). "Pelagic plastics and other seaborne persistent synthetic debris: a review of Southern Hemisphere perspectives". In Coe, J.M.; Rogers, D.B. (eds.). Marine Debris: Sources, Impacts, Solutions. New York: Springer-Verlag. pp. 49–66.
- Masahisa Kubota; Katsumi Takayama; Noriyuki Horii (2000). "Movement and accumulation of floating marine debris simulated by surface currents derived from satellite data" (PDF). School of Marine Science and Technology, Tokai University.
External links[]
- Pacific Garbage Patch – Smithsonian Ocean Portal
- "Plastic Surf" The Unhealthful Afterlife of Toys and Packaging: Small remnants of toys, bottles and packaging persist in the ocean, harming marine life and possibly even us by Jennifer Ackerman Scientific American August 2010
- photographer Chris Jordan, who recently traveled to a remote part of the Pacific Ocean to document effects of the world’s largest known mass of garbage. in Seed Boustead, Greg (18 February 2010). "§ Appetite for Destruction". Seedmagazine.com. Archived from the original on 18 July 2010. Retrieved 28 July 2010.CS1 maint: unfit URL (link)
- Scripps Environmental Accumulation of Plastic Expedition (SEAPLEX) – Scripps Institution of Oceanography, UC San Diego
- The Project Kaisei Voyage Tracker – Project Kaisei and Ojingolabs
- 5 Gyres – Understanding Plastic Marine Pollution – Algalita, Livable Legacy
- The trash vortex – Greenpeace
- Navigating the Pacific's 'Garbage Patch' – National Public Radio and me
- Marine Research, Education and Restoration – Algalita Marine Research Foundation
- Images & video from the North Pacific gyre – WordPress.com
- Sea of Trash – New York Times Magazine
- Captain Charles Moore on the seas of plastic
- Charles Moore: Sailing the Great Pacific Garbage Patch – TED Conference talk (2009)
- Marine garbage patches
- Indian Ocean
- Plastics and the environment
- 2010 in the environment