Dead zone (ecology)
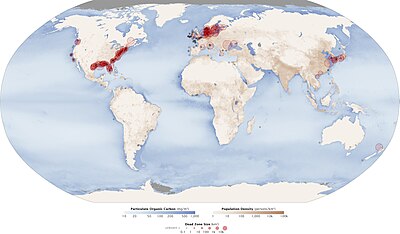
Black dots show dead zones of unknown size.
The size and number of marine dead zones—areas where the deep water is so low in dissolved oxygen that sea creatures can't survive—have grown explosively in the past half-century. – NASA Earth Observatory (2008)[1]
Dead zones are hypoxic (low-oxygen) areas in the world's oceans and large lakes. Hypoxia occurs when dissolved oxygen (DO) concentration falls to or below 2ml of O2/liter.[2] When a body of water experiences hypoxic conditions, aquatic flora and fauna begin to change behavior in order to reach sections of water with higher oxygen levels. Once DO declines below 0.5 ml O2/liter in a body of water, mass mortality occurs. With such low concentration of DO, these bodies of water fail to support the aquatic life living there.[3] Historically, many of these sites were naturally occurring. However, in the 1970s, oceanographers began noting increased instances and expanses of dead zones. These occur near inhabited coastlines, where aquatic life is most concentrated.

In March 2004, when the recently established UN Environment Programme published its first Global Environment Outlook Year Book (GEO Year Book 2003), it reported 146 dead zones in the world's oceans where marine life could not be supported due to depleted oxygen levels. Some of these were as small as a square kilometer (0.4 mi²), but the largest dead zone covered 70,000 square kilometers (27,000 mi²). A 2008 study counted 405 dead zones worldwide.[4][2]
Causes[]


Aquatic and marine dead zones can be caused by an increase in nutrients (particularly nitrogen and phosphorus) in the water, known as eutrophication. These nutrients are the fundamental building blocks of single-celled, plant-like organisms that live in the water column, and whose growth is limited in part by the availability of these materials. With more available nutrients, single-celled aquatic organisms (such as algae and cyanobacteria) have the resources necessary to exceed their previous growth limit and begin to multiply at an exponential rate. Exponential growth leads to rapid increases in the density of certain types of these phytoplankton, a phenomenon known as an algal bloom.[citation needed]
Limnologist Dr. David Schindler, whose research at the Experimental Lakes Area led to the banning of harmful phosphates in detergents, warned about algal blooms and dead zones,
"The fish-killing blooms that devastated the Great Lakes in the 1960s and 1970s haven't gone away; they've moved west into an arid world in which people, industry, and agriculture are increasingly taxing the quality of what little freshwater there is to be had here....This isn't just a prairie problem. Global expansion of dead zones caused by algal blooms is rising rapidly."[6]
The major groups of algae are Cyanobacteria, green algae, Dinoflagellates, Coccolithophores and Diatom algae. An increase in the input of nitrogen and phosphorus generally causes Cyanobacteria to bloom. Other algae are consumed and thus do not accumulate to the same extent as Cyanobacteria.[citation needed] Cyanobacteria are not good food for zooplankton and fish and hence accumulate in water, die, and then decompose. The bacterial degradation of their biomass consumes the oxygen in the water, thereby creating the state of hypoxia.
Dead zones can be caused by natural and by anthropogenic factors. Natural causes include coastal upwelling, changes in wind, and water circulation patterns. Other environmental factors that determine the occurrence or intensity of a dead zone include long water residence times, high temperatures, and high levels of sunlight penetration through the water column.[7]
Additionally, natural oceanographic phenomena can cause deoxygenation of parts of the water column. For example, enclosed bodies of water, such as fjords or the Black Sea, have shallow sills at their entrances, causing water to be stagnant there for a long time.[citation needed] The eastern tropical Pacific Ocean and northern Indian Ocean have lowered oxygen concentrations which are thought to be in regions where there is minimal circulation to replace the oxygen that is consumed.[8] These areas are also known as oxygen minimum zones (OMZ). In many cases, OMZs are permanent or semi-permanent areas.[citation needed]
Remains of organisms found within sediment layers near the mouth of the Mississippi River indicate four hypoxic events before the advent of synthetic fertilizer. In these sediment layers, anoxia-tolerant species are the most prevalent remains found. The periods indicated by the sediment record correspond to historic records of high river flow recorded by instruments at Vicksburg, Mississippi.[citation needed]
Changes in ocean circulation triggered by ongoing climate change could also add or magnify other causes of oxygen reductions in the ocean.[9]
Anthropogenic causes include use of chemical fertilizers and their subsequent presence in water runoff and groundwater, direct sewage discharge into rivers and lakes, and nutrient discharge into groundwater from large, accumulated quantities of animal waste. Use of chemical fertilizers is considered the major human-related cause of dead zones around the world. However, runoff from sewage, urban land use, and fertilizers can also contribute to eutrophication.[10]
In August 2017, a report suggested that the US meat industry and agroeconomic system are predominantly responsible for the largest-ever dead zone in the Gulf of Mexico.[11] Soil runoff and leached nitrate, exacerbated by agricultural land management and tillage practices as well as manure and synthetic fertilizer usage, contaminated water from the Heartland to the Gulf of Mexico. A large portion of the crops grown in this region are used as major feed components in the production of meat animals for agribusiness companies, like Tyson and Smithfield Foods.[12]
Notable dead zones in the United States include the northern Gulf of Mexico region,[5] surrounding the outfall of the Mississippi River, the coastal regions of the Pacific Northwest, and the Elizabeth River in Virginia Beach, all of which have been shown to be recurring events over the last several years. Around the world, dead zones have developed in continental seas, such as the Baltic, Kattegat, Black Sea, Gulf of Mexico, and East China Sea, all of which are major fishery areas.[2]
Types[]
Dead zones can be classified by type, and are identified by the length of their occurrence:[13]
- Permanent dead zones are deep water occurrences that rarely exceed 2 milligrams per liter.
- Temporary dead zones are short lived dead zones lasting hours or days.
- Seasonal dead zones are annually occurring, typically in warm months of summer and autumn.
- Diel cycling hypoxia is a specific seasonal dead zone that only becomes hypoxic during the night
The type of dead zone can, in some ways, be categorized by the time required for the water to return to full health. This time frame depends on the intensity of eutrophication and level of oxygen depletion. A water body that sinks to anoxic conditions and experiences extreme reduction in community diversity will have to travel a much longer path to return to full health. A water body that only experiences mild hypoxia and maintains community diversity and maturity will require a much shorter path length to return to full health.[2]
Effects[]

The most notable effects of eutrophication are vegetal blooms, sometimes toxic, loss of biodiversity and anoxia, which can lead to the massive death of aquatic organisms.[7]
Due to the hypoxic conditions present in dead zones, marine life within these areas tends to be scarce. Most fish and motile organisms tend to emigrate out to the zone as oxygen concentrations fall, and benthic populations may experience severe losses in when oxygen concentrations are below 0.5 mg l−1 O2.[14] In severe anoxic conditions, microbial life may experience dramatic shifts in community identity as well, resulting in an increased abundance of anaerobic organisms as aerobic microbes decrease in number and switch energy sources for oxidation such as nitrate, sulfate, or iron reduction. Sulfur reduction is a particular concern as Hydrogen sulfide is toxic and stresses most organisms within the zone further, exacerbating mortality risks.[15]
Low oxygen levels can have severe effects on survivability of organisms inside the area while above lethal anoxic conditions. Studies conducted along the Gulf Coast of North America have shown hypoxic conditions lead to reduction of reproductive rates and growth rates in a variety of organisms including fish and benthic invertebrates. Organisms able to leave the area typically do so when oxygen concentrations decrease to less than 2 mg l−1.[14] At these oxygen concentrations and below, organisms that survive inside the oxygen deficient environment and are unable to escape the area will often exhibit progressively worsening stress behavior and die. Surviving organisms tolerant of hypoxic conditions often exhibit physiological adaptations appropriate for persisting within hypoxic environments. Examples of such adaptations include increased efficiency of oxygen intake and use, lowering required amount of oxygen intake through reduced growth rates or dormancy, and increasing the usage of anaerobic metabolic pathways.[14]
Community composition in benthic communities is dramatically disrupted by periodic oxygen depletion events, such as those of Seasonal Dead Zones and occurring as a result of Diel Cycles. The longterm effects of such hypoxic conditions result in a shift in communities, most commonly manifest as a decrease in species diversity through mass mortality events. Reestablishment of benthic communities depend upon composition of adjacent communities for larval recruitment.[14] This results in a shift towards faster establishing colonizers with shorter and more opportunistic life strategies, potentially disrupting historic benthic compositions.
The influence of dead zones on fisheries and other marine commercial activities varies by the length of occurrence and location. Dead zones are often accompanied by a decrease in biodiversity and collapse in benthic populations, lowering the diversity of yield in commercial fishing operations, but in cases of eutrophication-related dead zone formations, the increase in nutrient availability can lead to temporary rises in select yields among pelagic populations, such as Anchovies.[14] However, studies estimate that the increased production in the surrounding areas do not offset the net decrease in productivity resulting from the dead zone. For instance, an estimated 17,000 MT of carbon in the form of prey for fisheries has been lost as a result of Dead Zones in the Gulf of Mexico.[2] Additionally, many stressors in fisheries are worsened by hypoxic conditions. Indirect factors such as increased success by invasive species and increased pandemic intensity in stressed species such as oysters both lead to losses in revenue and ecological stability in affected regions.[16]
Despite most other life forms being killed by the lack of oxygen, jellyfish can thrive and are sometimes present in dead zones in vast numbers. Jellyfish blooms produce large quantities of mucus, leading to major changes in food webs in the ocean since few organisms feed on them. The organic carbon in mucus is metabolized by bacteria which return it to the atmosphere in the form of carbon dioxide in what has been termed a "jelly carbon shunt".[17] The potential worsening of Jellyfish Blooms as a result of human activities has driven new research into the influence of dead zones on jelly populations. The primary concern is the potential for dead zones to serve as breeding grounds for jelly populations as a result of the hypoxic conditions driving away competition for resources and common predators of jellyfish.[18] The increased population of jellyfish could have high commercial costs with loss of fisheries, destruction and contamination of trawling nets and fishing vessels, and lowered tourism revenue in coastal systems.[18]
In addition to environmental impacts, eutrophication also poses a threat to society and human health. In a review on eutrophication, researchers wrote,
"Eutrophication poses a threat to the environment, the economy (e.g. impact on shellfish production, fishing, tourism), but also to human health (Von Blottnitz et al., 2006; Sutton et al., 2011). Attempts to evaluate the monetary impacts of eutrophication have been made over the last two decades, mainly in the United States and in the Baltic Sea (Dodds et al., 2009; Gren et al., 1997). These studies indicate a variety of impacts and costs which are quantifiable fairly directly, for instance when cities of hundreds of thousands of people are deprived of drinking water for several days. One example is the toxic algal bloom in the western Lake Erie basin in 2014, which led to disruption of water supplies to 400,000 people (Smith et al., 2015) On the other hand, integrating all the environmental, health and socio-economic impacts in the calculations of indirect effects, poses more of a challenge (Folke et al., 1994; Romstad, 2014)."[7]
Locations[]
In the 1970s, marine dead zones were first noted in settled areas where intensive economic use stimulated scientific scrutiny: in the U.S. East Coast's Chesapeake Bay, in Scandinavia's strait called the Kattegat, which is the mouth of the Baltic Sea and in other important Baltic Sea fishing grounds, in the Black Sea, and in the northern Adriatic.[19]

Other marine dead zones have appeared in coastal waters of South America, China, Japan, and New Zealand. A 2008 study counted 405 dead zones worldwide.[4][2]
Baltic Sea[]
Researchers from Baltic Nest Institute published in one of PNAS issues reports that the dead zones in the Baltic Sea have grown from approximately 5,000 km2 to more than 60,000 km2 in recent years.
Some of the causes behind the elevated increase of dead zones can be attributed to the use of fertilizers, large animal farms, the burning of fossil fuels, and effluents from municipal wastewater treatment plants.[20]
With its massive size, the Baltic Sea is best analyzed in sub-areas rather than as a whole. In a paper published in 2004, researchers specifically divided the Baltic Sea into 9 sub-areas, each having its own specific characteristics.[21] The 9 sub-areas are discerned as follows: Gulf of Bothnia, Archipelago region, Gulf of Finland, Gulf of Riga, Gulf of Gdansk, Swedish East-coast, Central Baltic, Belt Sea region, and Kattegat.[21] Each sub-area has responded differently to nutrient additions and eutrophication; however, there are a few general patterns and measures for the Baltic Sea as a whole.[21] As the researchers Rönnberg and Bonsdorff state,
“Irrespective of the area-specific effects of the increased loads of nutrients to the Baltic Sea, the sources are more or less similar in the whole region. The extent and the severity of the discharges may differ, however. As is seen in e.g. HELCOM (1996) and Rönnberg (2001), the major sources in the input of nutrients are derived from agriculture, industry, municipal sewage and transports. Nitrogen emissions in form of atmospheric depositions are also important, as well as local point sources, such as aquaculture and leakage from forestry.”[21]
In general, each area of the Baltic Sea is experiencing similar anthropogenic effects. As Rönnberg and Bonsdorff state, "Eutrophication is a serious problem in the Baltic Sea area."[21] However, when it comes to implementation of water revival programs, each area likely will need to be handled on a local level.
This section needs expansion. You can help by . (August 2013) |
Chesapeake Bay[]
As reported by the National Geographic "The Chesapeake Bay, on the East Coast of the United States, has one of the first dead zones ever identified, in the 1970s. The Chesapeake's high levels of nitrogen are caused by two factors: urbanization and agriculture. The western part of the bay is full of factories and urban centers that emit nitrogen into the air. Atmospheric nitrogen accounts for about a third of the nitrogen that enters the bay. The eastern part of the bay is a center of poultry farming, which produces large amounts of manure."[22]
The National Geographic further stated "Since 1967, the Chesapeake Bay Foundation has led a number of programs that aim to improve the bay's water quality and curb pollution runoff. The Chesapeake still has a dead zone, whose size varies with the season and weather."[22]
Elizabeth River, Virginia[]
The Elizabeth River estuary is important for Norfolk, Virginia, Chesapeake, Virginia, Virginia Beach, Virginia and Portsmouth, Virginia. It has been polluted by nitrogen and phosphorus, but also toxic deposits from the shipbuilding industry, the military, the world's largest coal export facility, refineries, loading docks, container-repair facilities and others, so fish had been "offlimits since the 1920s". In 1993, a group formed to clean it up, adopting the mummichog as a mascot, and has removed thousands of tons of contaminated sediment. In 2006, a 35-acre biological dead zone called Money Point was dredged out, and this let fish return, and the wetland recover.[23]
Lake Erie[]
A dead zone exists in the central part of Lake Erie from east of Point Pelee to Long Point and stretches to shores in Canada and the United States.[24] The zone has been noticed since the 1950s to 1960s, but efforts since the 1970s have been made by Canada and the US to reduce runoff pollution into the lake as means to reverse the dead zone growth. Overall the lake's oxygen level is poor with only a small area to the east of Long Point that has better levels. The biggest impact of the poor oxygen levels is to lacustrine life and fisheries industry.
Lower St. Lawrence Estuary[]
A dead zone exists in the Lower St. Lawrence River area from east the Saguenay River to east of Baie Comeau, greatest at depths over 275 metres (902 ft) and noticed since the 1930s.[25] The main concerns for Canadian scientists is the impact of fish found in the area.
Oregon[]
Off the coast of Cape Perpetua, Oregon, there is also a dead zone with a 2006 reported size of 300 square miles (780 km²).[citation needed] This dead zone only exists during the summer, perhaps due to wind patterns. The Oregon coast has also seen hypoxic water transporting itself from the continental shelf to the coastal embayments. This has seemed to cause intensity in several areas of Oregon's climate such as upwelled water containing oxygen concentration and upwelled winds.[26][27]
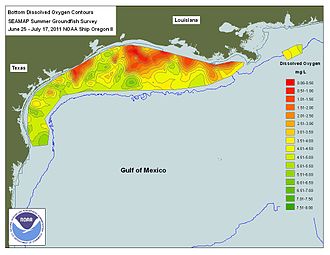
Gulf of Mexico 'dead zone'[]
The area of temporary hypoxic bottom water that occurs most summers off the coast of Louisiana in the Gulf of Mexico[28] is the largest recurring hypoxic zone in the United States.[29] It occurs only during the summer months of the year due to summer warming, regional circulation, wind mixing and high freshwater discharge.[30] The Mississippi River, which is the drainage area for 41% of the continental United States, dumps high-nutrient runoff such as nitrogen and phosphorus into the Gulf of Mexico. According to a 2009 fact sheet created by NOAA, "seventy percent of nutrient loads that cause hypoxia are a result of this vast drainage basin".[31] which includes the heart of U.S. agribusiness, the Midwest. The condition is brief and seasonal, but is depicted on maps as persistent for maximum policy impact. The discharge of treated sewage from urban areas (pop. c 12 million in 2009) combined with agricultural runoff deliver c. 1.7 million tons of phosphorus and nitrogen into the Gulf of Mexico every year.[31] Nitrogen is indeed needed to increase crop yields, but plants are inefficient at taking it up, and often more fertilizers are used than plants actually need. Therefore, only a percentage of applied nitrogen ends up in the crops; and in some areas that number is less than 20%.[32] Even though Iowa occupies less than 5% of the Mississippi River drainage basin, average annual nitrate discharge from surface water in Iowa is about 204,000 to 222,000 metric tonnes, or 25% of all the nitrate which the Mississippi River delivers to the Gulf of Mexico.[33] Export from the Raccoon River Watershed is among the highest in the United States with annual yields at 26.1 kg/ha/year which ranked as the highest loss of nitrate out of 42 Mississippi subwatersheds evaluated for a Gulf of Mexico hypoxia report.[34][35] In 2012, Iowa introduced the Iowa Nutrient Reduction Strategy, which "is a science and technology-based framework to assess and reduce nutrients to Iowa waters and the Gulf of Mexico. It is designed to direct efforts to reduce nutrients in surface water from both point and nonpoint sources in a scientific, reasonable and cost effective manner."[36] The strategy continues to evolve, using voluntary methods to reduce Iowa's negative contributions through outreach, research, and implementation of nutrient holding practices. In order to help reduce agricultural runoff into the Mississippi Basin, Minnesota passed MN Statute 103F.48 in 2015, also known as the "Buffer Law", which was designed to implement mandatory riparian buffers between farmland and public waterways across the State of Minnesota. The Minnesota Board of Water and Soil Resources (BWSR) issued a January 2019 report stating that compliance with the 'Buffer Law' has reached 99%.
Size[]
The area of hypoxic bottom water that occurs for several weeks each summer in the Gulf of Mexico has been mapped most years from 1985 through 2017. The size varies annually from a record high in 2017 when it encompassed more than 22,730 square kilometers (8,776 square miles) to a record low in 1988 of 39 square kilometers (15 square miles).[37][28][38] The 2015 dead zone measured 16,760 square kilometers (6,474 square miles).[39] Nancy Rabalais of the Louisiana Universities Marine Consortium in Cocodrie, Louisiana predicted the dead zone or hypoxic zone in 2012 will cover an area of 17,353 square kilometers (6,700 square miles) which is larger than Connecticut; however, when the measurements were completed, the area of hypoxic bottom water in 2012 only totaled 7,480 square kilometers. The models using the nitrogen flux from the Mississippi River to predict the "dead zone" areas have been criticized for being systematically high from 2006 to 2014, having predicted record areas in 2007, 2008, 2009, 2011, and 2013 that were never realized.[40]
In late summer 1988 the dead zone disappeared as the great drought caused the flow of Mississippi to fall to its lowest level since 1933. During times of heavy flooding in the Mississippi River Basin, as in 1993, ""the "dead zone" dramatically increased in size, approximately 5,000 km (3,107 mi) larger than the previous year".[41]
Economic impact[]
Some assert that the dead zone threatens lucrative commercial and recreational fisheries in the Gulf of Mexico. "In 2009, the dockside value of commercial fisheries in the Gulf was $629 million. Nearly three million recreational fishers further contributed about $10 billion to the Gulf economy, taking 22 million fishing trips."[42] Scientists are not in universal agreement that nutrient loading has a negative impact on fisheries. Grimes makes a case that nutrient loading enhances the fisheries in the Gulf of Mexico.[43] Courtney et al. hypothesize, that nutrient loading may have contributed to the increases in red snapper in the northern and western Gulf of Mexico.[44]
In 2017, Tulane University offered a $1 million challenge grant for growing crops with less fertilizer.[45]
History[]
Shrimp trawlers first reported a 'dead zone' in the Gulf of Mexico in 1950, but it was not until 1970 when the size of the hypoxic zone had increased that scientists began to investigate.[46]
After 1950, the conversion of forests and wetlands for agricultural and urban developments accelerated. "Missouri River Basin has had hundreds of thousands of acres of forests and wetlands (66,000,000 acres) replaced with agriculture activity [. . .] In the Lower Mississippi one-third of the valley's forests were converted to agriculture between 1950 and 1976."[46]
In July 2007, a dead zone was discovered off the coast of Texas where the Brazos River empties into the Gulf.[47]
Energy Independence and Security Act of 2007[]
The Energy Independence and Security Act of 2007 calls for the production of 36 billion US gallons (140,000,000 m3) of renewable fuels by 2022, including 15 billion US gallons (57,000,000 m3) of corn-based ethanol, a tripling of current production that would require a similar increase in corn production.[48] Unfortunately, the plan poses a new problem; the increase in demand for corn production results in a proportional increase in nitrogen runoff. Although nitrogen, which makes up 78% of the Earth's atmosphere, is an inert gas, it has more reactive forms, two of which (nitrate and ammonia) are used to make fertilizer.[49]
According to Fred Below, a professor of crop physiology at the University of Illinois at Urbana-Champaign, corn requires more nitrogen-based fertilizer because it produces a higher grain per unit area than other crops and, unlike other crops, corn is completely dependent on available nitrogen in soil. The results, reported 18 March 2008 in Proceedings of the National Academy of Sciences, showed that scaling up corn production to meet the 15-billion-US-gallon (57,000,000 m3) goal would increase nitrogen loading in the Dead Zone by 10–18%. This would boost nitrogen levels to twice the level recommended by the Mississippi Basin/Gulf of Mexico Water Nutrient Task Force (Mississippi River Watershed Conservation Programs), a coalition of federal, state, and tribal agencies that have monitored the dead zone since 1997. The task force says a 30% reduction of nitrogen runoff is needed if the dead zone is to shrink.[48]
Reversal[]
The recovery of benthic communities is primarily dependent upon the length and severity of hypoxic conditions inside the hypoxic zone. Less severe conditions and temporary depletion of oxygen allow rapid recovery of benthic communities in the area due to reestablishment by benthic larvae from adjacent areas, with longer conditions of hypoxia and more severe oxygen depletion leading to longer reestablishment periods.[2] Recovery also depends upon stratification levels within the area, so heavily stratified areas in warmer waters are less likely to recover from anoxic or hypoxic conditions in addition to being more susceptible to eutrophication driven hypoxia.[2] The difference in recovery ability and susceptibility to hypoxia in stratified marine environments is expected to complicate recovery efforts of dead zones in the future if ocean warming continues.
Small scale hypoxic systems with rich surrounding communities are the most likely to recover after nutrient influxes leading to eutrophication stop. However, depending on the extent of damage and characteristics of the zone, large scale hypoxic condition could also potentially recover after a period of a decade. For example, the Black Sea dead zone, previously the largest in the world, largely disappeared between 1991 and 2001 after fertilizers became too costly to use following the collapse of the Soviet Union and the demise of centrally planned economies in Eastern and Central Europe. Fishing has again become a major economic activity in the region.[50]
While the Black Sea "cleanup" was largely unintentional and involved a drop in hard-to-control fertilizer usage, the U.N. has advocated other cleanups by reducing large industrial emissions.[50] From 1985 to 2000, the North Sea dead zone had nitrogen reduced by 37% when policy efforts by countries on the Rhine River reduced sewage and industrial emissions of nitrogen into the water. Other cleanups have taken place along the Hudson River[51] and San Francisco Bay.[4]
Other methods of reversal can be found here.
See also[]
- Algal bloom
- Anoxic event
- Anoxic waters
- Cultural eutrophication
- Eutrophication
- Fish kill
- Hypoxia
- Marine pollution
- Ocean deoxygenation
- Oxygen minimum zone
- Shutdown of thermohaline circulation
Notes[]
- ^ Aquatic Dead Zones NASA Earth Observatory. Revised 17 July 2010. Retrieved 17 January 2010.
- ^ Jump up to: a b c d e f g h Diaz, R. J.; Rosenberg, R. (2008-08-15). "Spreading Dead Zones and Consequences for Marine Ecosystems". Science. 321 (5891): 926–929. Bibcode:2008Sci...321..926D. doi:10.1126/science.1156401. ISSN 0036-8075. PMID 18703733. S2CID 32818786.
- ^ "NOAA: Gulf of Mexico 'dead zone' predictions feature uncertainty". National Oceanic and Atmospheric Administration (NOAA). June 21, 2012. Retrieved June 23, 2012.
- ^ Jump up to: a b c Perlman, David (15 August 2008). "Scientists alarmed by ocean dead-zone growth". SFGate.
- ^ Jump up to: a b "Blooming horrible: Nutrient pollution is a growing problem all along the Mississippi". The Economist. 2012-06-23. Retrieved June 23, 2012.
- ^ David W. Schindler; John R. Vallentyne (2008). The Algal Bowl: Overfertilization of the World's Freshwaters and Estuaries. Edmonton, Alberta: University of Alberta Press. ISBN 978-0888644848.
- ^ Jump up to: a b c Le Moal, Morgane, Gascuel-Odoux, Chantal, Ménesguen, Alain, Souchon, Yves, Étrillard, Levain, Alix, … Pinay, Gilles (2019). Eutrophication: A new wine in an old bottle? Elsevier, Science of the Total Environment 651:1-11.
- ^ Pickard, G.L. and Emery, W.J. 1982. Description Physical Oceanography: An Introduction. Pergamon Press, Oxford, page 47.
- ^ Mora, C.; et al. (2013). "Biotic and Human Vulnerability to Projected Changes in Ocean Biogeochemistry over the 21st Century". PLOS Biology. 11 (10): e1001682. doi:10.1371/journal.pbio.1001682. PMC 3797030. PMID 24143135.
- ^ Corn boom could expand 'dead zone' in Gulf NBC News.msn.com
- ^ Milman, Oliver (2017-08-01). "Meat industry blamed for largest-ever 'dead zone' in Gulf of Mexico". The Guardian. ISSN 0261-3077. Retrieved 2017-08-04.
- ^ von Reusner, Lucia (August 1, 2017). "Mystery Meat II: The Industry Behind the Quiet Destruction of the American Heartland" (PDF). Mighty Earth. Retrieved August 4, 2017.
- ^ Helmenstine, Anne Marie (May 10, 2018). "What You Need to Know About Dead Zones in the Ocean". ThoughtCo.
- ^ Jump up to: a b c d e Rabalais, Nancy N.; Turner, R. Eugene; Wiseman, William J. (2002). "Gulf of Mexico Hypoxia, A.K.A. "The Dead Zone"". Annual Review of Ecology and Systematics. 33 (1): 235–263. doi:10.1146/annurev.ecolsys.33.010802.150513. ISSN 0066-4162.
- ^ Diaz, Robert; Rosenberg, Rutger (1995-01-01). "Marine benthic hypoxia: A review of its ecological effects and the behavioural response of benthic macrofauna". Oceanography and marine biology. An annual review [Oceanogr. Mar. Biol. Annu. Rev.] 33: 245–303.
- ^ Anderson, R. S.; Brubacher, L. L.; Calvo, L. Ragone; Unger, M. A.; Burreson, E. M. (1998). "Effects of tributyltin and hypoxia on the progression of Perkinsus marinus infections and host defence mechanisms in oyster, Crassostrea virginica (Gmelin)". Journal of Fish Diseases. 21 (5): 371–380. doi:10.1046/j.1365-2761.1998.00128.x. ISSN 0140-7775.
- ^ Yong, Ed (6 June 2011). "Jellyfish shift ocean food webs by feeding bacteria with mucus and excrement". Discover Magazine. Retrieved 4 October 2018.
- ^ Jump up to: a b Richardson, Anthony J.; Bakun, Andrew; Hays, Graeme C.; Gibbons, Mark J. (2009-06-01). "The jellyfish joyride: causes, consequences and management responses to a more gelatinous future". Trends in Ecology & Evolution. 24 (6): 312–322. doi:10.1016/j.tree.2009.01.010. ISSN 0169-5347. PMID 19324452.
- ^ Karleskint; Turner; Small (2013). Introduction to Marine Biology (4 ed.). Brooks/Cole. p. 4. ISBN 978-1133364467.
- ^ "Dead zones have increased by more than 10-fold in the last century - Baltic Nest Institute". www.balticnest.org. 2014-04-01. Retrieved 2018-06-04.
- ^ Jump up to: a b c d e Ronnberg, C., & Bonsdorff, E. (2004, Feb). Baltic Sea eutrophication: area-specific ecological consequences [Article; Proceedings Paper]. Hydrobiologia, 514(1-3), 227-241. https://doi.org/10.1023/B:HYDR.0000019238.84989.7f
- ^ Jump up to: a b "Dead zone". 2011-01-21.
- ^ Kobell, Rona (July 1, 2011). "Elizabeth River rises from the depths". Bay Journal.
- ^ "Dead Zones".
- ^ "Will "Dead Zones" Spread in the St. Lawrence River?". Archived from the original on 2013-06-26.
- ^ Griffis, Roger; Howard, Jennifer, eds. (2013). Oceans and Marine Resources in a Changing Climate: A Technical Input to the 2013 National Climate Assessment. Island Press. ISBN 978-1-61091-480-2.[page needed]
- ^ Chan, F.; Barth, J. A.; Lubchenco, J.; Kirincich, A.; Weeks, H.; Peterson, W. T.; Menge, B. A. (15 February 2008). "Emergence of Anoxia in the California Current Large Marine Ecosystem". Science. 319 (5865): 920. Bibcode:2008Sci...319..920C. doi:10.1126/science.1149016. PMID 18276882. S2CID 43714208.
- ^ Jump up to: a b "NOAA: Gulf of Mexico 'Dead Zone' Predictions Feature Uncertainty". U.S. Geological Survey (USGS). June 21, 2012. Archived from the original on 2016-04-11. Retrieved June 23, 2012.
- ^ "What is hypoxia?". Louisiana Universities Marine Consortium (LUMCON). Archived from the original on June 12, 2013. Retrieved May 18, 2013.
- ^ Rabalais, Nancy (August 14, 2002). "Gulf of Mexico Hypoxia, A.K.A. "The Dead Zone". Annual Review of Ecology and Systematics. 33 (1): 235–263. doi:10.1146/annurev.ecolsys.33.010802.150513.
- ^ Jump up to: a b "Dead Zone: Hypoxia in the Gulf of Mexico" (PDF). NOAA. 2009. Retrieved June 23, 2012.
- ^ Dybas, Cheryl Lyn (July 2005). "Dead Zones Spreading in World Oceans". BioScience. 55 (7): 552–557. doi:10.1641/0006-3568(2005)055[0552:DZSIWO]2.0.CO;2.
- ^ Schilling, Keith E.; Libra, Robert D. (2000). "The Relationship of Nitrate Concentrations in Streams to Row Crop Land Use in Iowa". Journal of Environmental Quality. 29 (6): 1846. doi:10.2134/jeq2000.00472425002900060016x.
- ^ Goolsby, Donald A.; Battaglin, William A.; Aulenbach, Brent T.; Hooper, Richard P. (2001). "Nitrogen Input to the Gulf of Mexico". Journal of Environmental Quality. 30 (2): 329–36. doi:10.2134/jeq2001.302329x. PMID 11285892.
- ^ "Board of Water Works Trustees of the City of Des Moines, Iowa, Plaintiff vs. Sac County Board of Supervisors et al" (PDF). United States District Court for The Northern District of Iowa, Western Division. March 16, 2015. Archived from the original (PDF) on August 5, 2016. Retrieved March 9, 2017.
 This article incorporates text from this source, which is in the public domain.
- ^ "Iowa Nutrient Reduction Strategy | Iowa Nutrient Reduction Strategy". www.nutrientstrategy.iastate.edu. Retrieved 2018-10-16.
- ^ "NOAA: Gulf of Mexico 'dead zone' is the largest ever measured". National Oceanic and Atmospheric Administration (NOAA). August 3, 2017. Archived from the original on August 2, 2017. Retrieved August 3, 2017.
- ^ Lochhead, Carolyn (2010-07-06). "Dead zone in gulf linked to ethanol production". San Francisco Chronicle. Retrieved 2010-07-28.
- ^ 2015 Gulf of Mexico Hypoxic Zone Size, Mississippi River/Gulf of Mexico Hypoxia Task Force, EPA, n.d.
- ^ Courtney, Michael W.; Courtney, Joshua M. (2013). "Predictions Wrong Again on Dead Zone Area -- Gulf of Mexico Gaining Resistance to Nutrient Loading". arXiv:1307.8064 [q-bio.QM].
- ^ Lisa M. Fairchild (2005). The influence of stakeholder groups on the decision-making process regarding the dead zone associated with the Mississippi river discharge (Master of Science). University of South Florida (USF). p. 14.
- ^ "Gulf of Mexico 'Dead Zone' Predictions Feature Uncertainty" (Press release). NOAA. June 21, 2012. Retrieved September 25, 2019.
- ^ Grimes, Churchill B. (August 2001). "Fishery Production and the Mississippi River Discharge". Fisheries. 26 (8): 17–26. doi:10.1577/1548-8446(2001)026<0017:FPATMR>2.0.CO;2.
- ^ Courtney, Joshua M.; Courtney, Amy C.; Courtney, Michael W. (21 June 2013). "Nutrient Loading Increases Red Snapper Production in the Gulf of Mexico". Hypotheses in the Life Sciences. 3 (1): 7–14–14. arXiv:1306.5114. Bibcode:2013arXiv1306.5114C.
- ^ "Adapt-N Wins Tulane Nitrogen Reduction Challenge to Reduce Dead Zones: What's Next?". 19 December 2017.
- ^ Jump up to: a b Jennie Biewald; Annie Rossetti; Joseph Stevens; Wei Cheih Wong. The Gulf of Mexico's Hypoxic Zone (Report).
- ^ Cox, Tony (2007-07-23). "Exclusive". Bloomberg. Archived from the original on 2010-06-09. Retrieved 2010-08-03.
- ^ Jump up to: a b Potera, Carol (2008). "Fuels: Corn Ethanol Goal Revives Dead Zone Concerns". Environmental Health Perspectives. 116 (6): A242–A243. doi:10.1289/ehp.116-a242. PMC 2430248. PMID 18560496.
- ^ "Dead Water". Economist. May 2008.
- ^ Jump up to: a b Mee, Laurence (November 2006). "Reviving Dead Zones". Scientific American.
- ^ 'Dead Zones' Multiplying In World's Oceans by John Nielsen. 15 Aug 2008, Morning Edition, NPR.
References[]
- Diaz, R. J.; Rosenberg, R. (15 August 2008). "Spreading Dead Zones and Consequences for Marine Ecosystems". Science. 321 (5891): 926–929. Bibcode:2008Sci...321..926D. doi:10.1126/science.1156401. PMID 18703733. S2CID 32818786.
- Osterman, Lisa E.; Poore, Richard Z.; Swarzenski, Peter W.; Turner, R. Eugene (2005). "Reconstructing a 180 yr record of natural and anthropogenic induced low-oxygen conditions from Louisiana continental shelf sediments". Geology. 33 (4): 329. Bibcode:2005Geo....33..329O. doi:10.1130/G21341.1. S2CID 55361042.
- Taylor, F. J.; Taylor, N. J.; Walsby, J. R. (1985). "A Bloom of the Planktonic Diatom,Cerataulina pelagica, off the Coast of Northeastern New Zealand in 1983, and its Contribution to an Associated Mortality of Fish and Benthic Fauna". Internationale Revue der gesamten Hydrobiologie und Hydrographie. 70 (6): 773–795. doi:10.1002/iroh.19850700602.
- Morrisey, D.J; Gibbs, M.M; Pickmere, S.E; Cole, R.G (May 2000). "Predicting impacts and recovery of marine-farm sites in Stewart Island, New Zealand, from the Findlay–Watling model". Aquaculture. 185 (3–4): 257–271. doi:10.1016/s0044-8486(99)00360-9.
- Potera, Carol (June 2008). "Fuels: Corn Ethanol Goal Revives Dead Zone Concerns". Environmental Health Perspectives. 116 (6): A242-3. doi:10.1289/ehp.116-a242. PMC 2430248. PMID 18560496.
- Minnesota Board of Water and Soil Resources (BWSR, 2018), http://bwsr.state.mn.us/buffers/
- Minnesota 'Buffer Law' statute: MN Statute 103F.48
- BWSR Update, January 2019: http://bwsr.state.mn.us/buffers/Buffers_Public_Waters_Progress_Map.pdf
- Ronnberg, C., & Bonsdorff, E. (2004, Feb). Baltic Sea eutrophication: area-specific ecological consequences [Article; Proceedings Paper]. Hydrobiologia, 514(1-3), 227-241. https://doi.org/10.1023/B:HYDR.0000019238.84989.7f
- Le Moal, Morgane, Gascuel-Odoux, Chantal, Ménesguen, Alain, Souchon, Yves, Étrillard, Levain, Alix, … Pinay, Gilles (2019). Eutrophication: A new wine in an old bottle? Elsevier, Science of the Total Environment 651:1-11.
Further reading[]
- Growing 'dead zone' Confirmed by Underwater Robots in the Gulf of Oman, phys.org, April 2018
- Hendy, Ian (August 2017), Gulf of Mexico 'dead zone' is already a disaster – but it could get worse, The Conversation
- Bryant, Lee (April 2015), Ocean 'dead zones' are spreading – and that spells disaster for fish, The Conversation
- David Stauth (Oregon State University), "Hypoxic "dead zone" growing off the Oregon Coast", July 31, 2006 at archive.today (archived 2013-01-29)
- Suzie Greenhalgh and Amanda Sauer (WRI), "Awakening the 'Dead Zone': An investment for agriculture, water quality, and climate change" 2003
- Reyes Tirado (July 2008) Dead Zones: How Agricultural Fertilizers are Killing our Rivers, Lakes and Oceans. Greenpeace publications. See also: "Dead Zones: How Agricultural Fertilizers are Killing our Rivers, Lakes and Oceans". Greenpeace Canada. 2008-07-07. Archived from the original on 2010-09-08. Retrieved 2010-08-03.
- MSNBC report on dead zones, March 29, 2004
- Joel Achenbach, "A 'Dead Zone' in The Gulf of Mexico: Scientists Say Area That Cannot Support Some Marine Life Is Near Record Size", The Washington Post, July 31, 2008
- Joel Achenbach, "'Dead Zones' Appear In Waters Worldwide: New Study Estimates More Than 400", The Washington Post, August 15, 2008
External links[]
- Louisiana Universities Marine Consortium
- UN Geo Yearbook 2003 report on nitrogen and dead zones at the Library of Congress Web Archives (archived 2005-08-02)
- NASA on dead zones (Satellite pictures)
- Gulf of Mexico Dead Zone – multimedia
- Gulf of Mexico Hypoxia Watch, NOAA, Joel Achenbach at the Wayback Machine (archived 2007-10-09)
- NutrientNet at the Wayback Machine (archived 2010-07-11), an online nutrient trading tool developed by the World Resources Institute, designed to address issues of eutrophication. See also the PA NutrientNet website designed for Pennsylvania's nutrient trading program.


| show Authority control |
|---|
- Aquatic ecology
- Chemical oceanography
- Ecotoxicology
- Environmental issues with water
- Fishing industry
- Ocean pollution
- Oceanographical terminology
- Water pollution
- Algal blooms