Nutrient pollution
Nutrient pollution, a form of water pollution, refers to contamination by excessive inputs of nutrients. It is a primary cause of eutrophication of surface waters, in which excess nutrients, usually nitrogen or phosphorus, stimulate algal growth. Sources of nutrient pollution include surface runoff from farm fields and pastures, discharges from septic tanks and feedlots, and emissions from combustion. Raw sewage is a large contributor to cultural eutrophication since sewage is high in nutrients. Releasing raw sewage into a large water body is referred to as sewage dumping, and still occurs all over the world. Excess reactive nitrogen compounds in the environment are associated with many large-scale environmental concerns. These include eutrophication of surface waters, harmful algal blooms, hypoxia, acid rain, nitrogen saturation in forests, and climate change.[1]
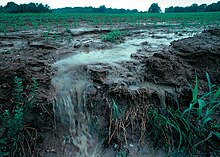
Since the agricultural boom in the 1910s and again in the 1940s to match the increase in food demand, agricultural production relies heavily on the use of fertilizers.[2] Fertilizer is a natural or chemically modified substance that helps soil become more fertile. These fertilizers contain high amounts of phosphorus and nitrogen, which results in excess amounts of nutrients entering the soil. Nitrogen, phosphorus and potassium are the "Big 3" primary nutrients in commercial fertilizers, each of these fundamental nutrients play a key role in plant nutrition.[3] When nitrogen and phosphorus are not fully utilized by the growing plants, they can be lost from the farm fields and negatively impact air and downstream water quality.[4] These nutrients can eventually end up in aquatic ecosystems and are a contributor to increased eutrophication.[5] When farmers spread their fertilizer whether it is organic or synthetically made most of the fertilizer will turn into runoff that collects downstream generating cultural eutrophication.[6]
Mitigation approaches to reduce nutrient pollutant discharges include nutrient remediation, nutrient trading and nutrient source apportionment.
Nutrients[]
| Part of a series on |
| Pollution |
|---|
 |
| WikiProject Environment WikiProject Ecology |
|
Category (By country)
|
| Food types | Eutrophying emissions (g PO43-eq per 100g protein) |
|---|---|
| Beef | 365.3
|
| Farmed fish | 235.1
|
| Farmed crustaceans | 227.2
|
| Cheese | 98.4
|
| Lamb and mutton | 97.1
|
| Pork | 76.4
|
| Poultry | 48.7
|
| Eggs | 21.8
|
| Groundnuts | 14.1
|
| Peas | 7.5
|
| Tofu | 6.2
|

Nitrogen[]
Use of synthetic fertilizers, burning of fossil fuels, and agricultural animal production, especially concentrated animal feeding operations (CAFO), have added large quantities of reactive nitrogen to the biosphere.[8] Globally, nitrogen balances are quite inefficiently distributed with some countries having surpluses and others deficits, causing especially a range of environmental issues in the former.[9] For most countries around the world, the trade-off between closing yield gaps and mitigating nitrogen pollution is small or non-existent[10]
Phosphorus[]
Phosphorus pollution is caused by excessive use of fertilizers and manure, particularly when compounded by soil erosion. Phosphorus is also discharged by municipal sewage treatment plants and some industries.[11]
Humankind has increased the rate of phosphorus cycling on Earth by four times, mainly due to agricultural fertilizer production and application. Between 1950 and 1995, an estimated 600,000,000 tonnes of phosphorus was applied to Earth's surface, primarily on croplands.
Environmental impacts[]
Excess nutrients have been summarized as potentially leading to:
- Population effects: excess growth of algae (harmful algal blooms);[12]
- Community effects: species composition shifts (dominant taxa);
- Ecological effects: food web changes, light limitation;
- Biogeochemical effects: excess organic carbon (eutrophication); dissolved oxygen deficits (environmental hypoxia); toxin production;[13]
- Human health effects: excess nitrate in drinking water (blue baby syndrome); disinfection by-products in drinking water;[14]
- Biodiversity effects: excessive algae blooms (biodiversity loss).[15]
Sources of high nutrient runoff[]
The principal source(s) of nutrient pollution in an individual watershed depend on the prevailing land uses. The sources may be point sources, nonpoint sources, or both:
- Agriculture: animal production or crops
- Urban/suburban: stormwater runoff from roads and parking lots; excessive fertilizer use on lawns; municipal sewage treatment plants; motor vehicle emissions
- Industrial: air pollution emissions (e.g. electric power plants), wastewater discharges from various industries.[16]
Nutrient pollution from some air pollution sources may occur independently of the local land uses, due to long-range transport of air pollutants from distant sources.[13]
In order to gauge how to best prevent eutrophication from occurring, specific sources that contribute to nutrient loading must be identified. There are two common sources of nutrients and organic matter: point and nonpoint sources.
Point sources[]
Point sources are directly attributable to one influence. In point sources the nutrient waste travels directly from source to water. Point sources are relatively easy to regulate.
Nonpoint sources[]
Nonpoint source pollution (also known as 'diffuse' or 'runoff' pollution) is that which comes from ill-defined and diffuse sources. Nonpoint sources are difficult to regulate and usually vary spatially and temporally (with season, precipitation, and other irregular events).
It has been shown that nitrogen transport is correlated with various indices of human activity in watersheds,[17][18] including the amount of development.[19] Ploughing in agriculture and development are activities that contribute most to nutrient loading.
Soil retention[]
Nutrients from human activities tend to accumulate in soils and remain there for years. It has been shown[20] that the amount of phosphorus lost to surface waters increases linearly with the amount of phosphorus in the soil. Thus much of the nutrient loading in soil eventually makes its way to water. Nitrogen, similarly, has a turnover time of decades.
Runoff to surface water[]
Nutrients from human activities tend to travel from land to either surface or ground water. Nitrogen in particular is removed through storm drains, sewage pipes, and other forms of surface runoff. Nutrient losses in runoff and leachate are often associated with agriculture. Modern agriculture often involves the application of nutrients onto fields in order to maximize production. However, farmers frequently apply more nutrients than are taken up by crops[21] or pastures. Regulations aimed at minimizing nutrient exports from agriculture are typically far less stringent than those placed on sewage treatment plants[22] and other point source polluters. It should be also noted that lakes within forested land are also under surface runoff influences. Runoff can wash out the mineral nitrogen and phosphorus from detritus and in consequence supply the water bodies leading to slow, natural eutrophication.[23]
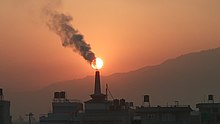
Atmospheric deposition[]
Nitrogen is released into the air because of ammonia volatilization and nitrous oxide production. The combustion of fossil fuels is a large human-initiated contributor to atmospheric nitrogen pollution. Atmospheric nitrogen reaches the ground by two different processes, the first being wet deposition such as rain or snow, and the second being dry deposition which is particles and gases found in the air.[24] Atmospheric deposition (e.g., in the form of acid rain) can also affect nutrient concentration in water,[25] especially in highly industrialized regions.
Other sources[]
Any factor that causes increased nutrient concentrations can potentially lead to eutrophication. In modeling eutrophication, the rate of water renewal plays a critical role; stagnant water is allowed to collect more nutrients than bodies with replenished water supplies. It has also been shown that the drying of wetlands causes an increase in nutrient concentration and subsequent eutrophication blooms.[26]
Mitigation of nutrient pollutant discharges[]
Nutrient remediation[]

Innovative solutions have been conceived to deal with nutrient pollution in aquatic systems by altering or enhancing natural processes to shift nutrient effects away from detrimental ecological impacts.[citation needed] Nutrient remediation is a form of environmental remediation, but concerns only biologically active nutrients such as nitrogen and phosphorus. “Remediation” refers to the removal of pollution or contaminants, generally for the protection of human health. In environmental remediation nutrient removal technologies include biofiltration, which uses living material to capture and biologically degrade pollutants. Examples include green belts, riparian areas, natural and constructed wetlands, and treatment ponds. These areas most commonly capture anthropogenic discharges such as wastewater, stormwater runoff, or sewage treatment, for land reclamation after mining, refinery activity, or land development.[citation needed] Biofiltration utilizes biological assimilation to capture, absorb, and eventually incorporate the pollutants (including nutrients) into living tissue. Another form of nutrient removal is bioremediation, which uses microorganisms to remove pollutants. Bioremediation can occur on its own as natural attenuation or intrinsic bioremediation or can be encouraged by the addition of fertilizers, a strategy called biostimulation.[citation needed]
Nutrient bioextraction is bioremediation involving cultured plants and animals. Nutrient bioextraction or bioharvesting is the practice of farming and harvesting shellfish and seaweed for the purpose of removing nitrogen and other nutrients from natural water bodies.[27] It has been suggested that nitrogen removal by oyster reefs could generate net benefits for sources facing nitrogen emission restrictions, similar to other nutrient trading scenarios. Specifically, if oysters maintain nitrogen levels in estuaries below thresholds that would lead to the imposition of emission limits, oysters effectively save the sources the compliance costs they otherwise would incur.[28] Several studies have shown that oysters and mussels have the capacity to dramatically impact nitrogen levels in estuaries.[29][30][31] Additionally, studies have demonstrated seaweed's potential to improve nitrogen levels.[32]
Nutrient trading[]
Nutrient trading is a type of water quality trading, a market-based policy instrument used to improve or maintain water quality. Water quality trading arose around 2005 and is based on the fact that different pollution sources in a watershed can face very different costs to control the same pollutant.[33] Water quality trading involves the voluntary exchange of pollution reduction credits from sources with low costs of pollution control to those with high costs of pollution control, and the same principles apply to nutrient water quality trading. The underlying principle is “polluter pays”, usually linked with a regulatory requirement for participating in the trading program.[34]
A 2013 Forest Trends report summarized water quality trading programs and found three main types of funders: beneficiaries of watershed protection, polluters compensating for their impacts and "public good payers" that may not directly benefit, but fund the pollution reduction credits on behalf of a government or NGO. As of 2013, payments were overwhelmingly initiated by public good payers like governments and NGOs.[34]: 11
Nutrient source apportionment[]
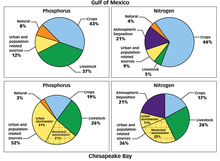
Nutrient source apportionment is used to estimate the nutrient load from various sectors entering water bodies, following attenuation or treatment. Agriculture is typically the principal source of nitrogen in water bodies in Europe, whereas in many countries households and industries tend to be the dominant contributors of phosphorus.[35] Where water quality is impacted by excess nutrients, load source apportionment models can support the proportional and pragmatic management of water resources by identifying the pollution sources. There are two broad approaches to load apportionment modelling, (i) load-orientated approaches which apportion origin based on in-stream monitoring data[36][37] and (ii) source-orientated approaches where amounts of diffuse, or nonpoint source pollution, emissions are calculated using models typically based on export coefficients from catchments with similar characteristics.[38][39] For example, the Source Load Apportionment Model (SLAM) takes the latter approach, estimating the relative contribution of sources of nitrogen and phosphorus to surface waters in Irish catchments without in-stream monitoring data by integrating information on point discharges (urban wastewater, industry and septic tank systems), diffuse sources (pasture, arable, forestry, etc.), and catchment data, including hydrogeological characteristics.[40]
Country examples[]
United States[]
Agricultural nonpoint source (NPS) pollution is the largest source of water quality impairments throughout the U.S., based on surveys by state environmental agencies.[41]: 10 NPS pollution is not subject to discharge permits under the federal Clean Water Act (CWA).[42] EPA and states have used grants, partnerships and demonstration projects to create incentives for farmers to adjust their practices and reduce surface runoff.[41]: 10–11
Development of nutrient policy[]
The basic requirements for states to develop nutrient criteria and standards were mandated in the 1972 Clean Water Act. Implementing this water quality program has been a major scientific, technical and resource-intensive challenge for both EPA and the states, and development is continuing well into the 21st century.
EPA published a wastewater management regulation in 1978 to begin to address the national nitrogen pollution problem, which had been increasing for decades.[43] In 1998, the agency published a National Nutrient Strategy with a focus on developing nutrient criteria.[44]
Between 2000 and 2010 EPA published federal-level nutrient criteria for rivers/streams, lakes/reservoirs, estuaries and wetlands; and related guidance. "Ecoregional" nutrient criteria for 14 ecoregions across the U.S. were included in these publications. While states may directly adopt the EPA-published criteria, in many cases the states need to modfiy the criteria to reflect site-specific conditions. In 2004, EPA stated its expectations for numeric criteria (as opposed to less-specific narrative criteria) for total nitrogen (TN), total phosphorus (TP), chlorophyll a(chl-a), and clarity, and established "mutually-agreed upon plans" for state criteria development. In 2007, the agency stated that progress among the states on developing nutrient criteria had been uneven. EPA reiterated its expectations for numeric criteria and promised its support for state efforts to develop their own criteria.[45]
After the EPA had introduced watershed-based NPDES permitting in 2007,[46] interest in nutrient removal and achieving regional TMDLs led to the development of nutrient trading schemes.
In 2008 EPA published a progress report on state efforts to develop nutrient standards. A majority of states had not developed numeric nutrient criteria for rivers and streams; lakes and reservoirs; wetlands and estuaries (for those states that have estuaries).[47] In the same year, EPA also established a Nutrient Innovations Task Group (NITG), composed of state and EPA experts, to monitor and evaluate the progress of reducing nutrient pollution.[48] In 2009 the NTIG issued a report, "An Urgent Call to Action," expressing concern that water quality continued to deteriorate nationwide due to increasing nutrient pollution, and recommending more vigorous development of nutrient standards by the states.[49]
In 2011 EPA reiterated the need for states to fully develop their nutrient standards, noting that drinking water violations for nitrates had doubled in eight years, that half of all streams nationwide had medium to high levels of nitrogen and phosphorus, and harmful algal blooms were increasing. The agency set out a framework for states to develop priorities and watershed-level goals for reductions of nutrients.[50]
Discharge permits[]
Many point source dischargers in the U.S., while not necessarily the largest sources of nutrients in their respective watersheds, are required to comply with nutrient effluent limitations in their permits, which are issued through the National Pollutant Discharge Elimination System (NPDES), pursuant to the CWA.[51] Some large municipal sewage treatment plants, such as the Blue Plains Advanced Wastewater Treatment Plant in Washington, D.C. have installed biological nutrient removal (BNR) systems to comply with regulatory requirements.[52] Other municipalities have made adjustments to the operational practices of their existing secondary treatment systems to control nutrients.[53]
Discharges from large livestock facilities (CAFO) are also regulated by NPDES permits.[54] Surface runoff from farm fields, the principal source of nutrients in many watersheds,[55] is classified as NPS pollution and is not regulated by NPDES permits.[42]
TMDL program[]
A Total Maximum Daily Load (TMDL) is a regulatory plan that prescribes the maximum amount of a pollutant (including nutrients) that a body of water can receive while still meeting CWA water quality standards.[56] Specifically, Section 303 of the Act requires each state to generate a TMDL report for each body of water impaired by pollutants. TMDL reports identify pollutant levels and strategies to accomplish pollutant reduction goals. EPA has described TMDLs as establishing a "pollutant budget" with allocations to each of the pollutant's sources.[57] For many coastal water bodies, the main pollutant issue is excess nutrients, also termed nutrient over-enrichment.[58]
A TMDL can prescribe the minimum level of dissolved oxygen (DO) available in a body of water, which is directly related to nutrient levels. (See Aquatic Hypoxia.) In 2010, 18 percent of TMDLs nationwide were related to nutrient levels including organic enrichment/oxygen depletion, noxious plants, algal growth, and ammonia.[59]
TMDLs identify all point source and nonpoint source pollutants within a watershed. To implement TMDLs with point sources, wasteload allocations are incorporated into their NPDES permits.[60] NPS discharges are generally in a voluntary compliance scenario.[56]
In Long Island Sound, the TMDL development process enabled the Connecticut Department of Energy and Environmental Protection and the New York State Department of Environmental Conservation to incorporate a 58.5 percent nitrogen reduction target into a regulatory and legal framework.[57]
See also[]
References[]
- ^ EPA. "Reactive Nitrogen in the United States: An Analysis of Inputs, Flows, Consequences, and Management Options, A Report of the Science Advisory Board EPA-SAB-11-013" (PDF). Archived from the original (PDF) on February 19, 2013.
- ^ Seo Seongwon; Aramaki Toshiya; Hwang Yongwoo; Hanaki Keisuke (2004-01-01). "Environmental Impact of Solid Waste Treatment Methods in Korea". Journal of Environmental Engineering. 130 (1): 81–89. doi:10.1061/(ASCE)0733-9372(2004)130:1(81).
- ^ "Fertilizer 101: The Big Three - Nitrogen, Phosphorus and Potassium". 2014-05-07.
- ^ "The Sources and Solutions: Agriculture". United States EPA. 2013-03-12.
- ^ Huang, Jing; Xu, Chang-chun; Ridoutt, Bradley; Wang, Xue-chun; Ren, Pin-an (August 2017). "Nitrogen and phosphorus losses and eutrophication potential associated with fertilizer application to cropland in China". Journal of Cleaner Production. 159: 171–179. doi:10.1016/j.jclepro.2017.05.008.
- ^ Carpenter, S. R.; Caraco, N. F.; Correll, D. L.; Howarth, R. W.; Sharpley, A. N.; Smith, V. H. (August 1998). "Nonpoint Pollution of Surface Waters with Phosphorus and Nitrogen". Ecological Applications. 8 (3): 559. doi:10.2307/2641247. hdl:1813/60811. JSTOR 2641247.
- ^ Nemecek, T.; Poore, J. (2018-06-01). "Reducing food's environmental impacts through producers and consumers". Science. 360 (6392): 987–992. Bibcode:2018Sci...360..987P. doi:10.1126/science.aaq0216. ISSN 0036-8075. PMID 29853680.
- ^ Galloway, J.N.; et al. (September 2004). "Nitrogen Cycles: Past, Present, and Future". Biogeochemistry. 70 (2): 153–226. doi:10.1007/s10533-004-0370-0. S2CID 98109580.
- ^ Wuepper, David; Le Clech, Solen; Zilberman, David; Mueller, Nathaniel; Finger, Robert (November 2020). "Countries influence the trade-off between crop yields and nitrogen pollution". Nature Food. 1 (11): 713–719. doi:10.1038/s43016-020-00185-6. hdl:20.500.11850/452561. ISSN 2662-1355. S2CID 228957302.
- ^ Wuepper, David; Le Clech, Solen; Zilberman, David; Mueller, Nathaniel; Finger, Robert (November 2020). "Countries influence the trade-off between crop yields and nitrogen pollution". Nature Food. 1 (11): 713–719. doi:10.1038/s43016-020-00185-6. hdl:20.500.11850/452561. ISSN 2662-1355. S2CID 228957302.
- ^ "Phosphorus and Water". USGS Water Science School. Reston, VA: U.S. Geological Survey (USGS). 2018-03-13.
- ^ "Harmful Algal Blooms". Nutrient Pollution. Washington, D.C.: U.S. Environmental Protection Agency (EPA). 2017-04-07.
- ^ Jump up to: a b "The Effects: Environment". Nutrient Pollution. EPA. 2017-04-07.
- ^ "The Effects: Human Health". Nutrient Pollution. EPA. 2017-03-10.
- ^ "National Nutrient Strategy". EPA. 2017-05-18.
- ^ "Sources and Solutions". Nutrient Pollution. EPA. 2017-03-10.
- ^ Cole J.J., B.L. Peierls, N.F. Caraco, and M.L. Pace. (1993) "Nitrogen loading of rivers as a human-driven process", pp. 141–157 in M. J. McDonnell and S.T.A. Pickett (eds.) Humans as components of ecosystems. Springer-Verlag, New York, New York, USA, ISBN 0-387-98243-4.
- ^ Howarth, R. W.; Billen, G.; Swaney, D.; Townsend, A.; Jaworski, N.; Lajtha, K.; Downing, J. A.; Elmgren, R.; Caraco, N.; Jordan, T.; Berendse, F.; Freney, J.; Kudeyarov, V.; Murdoch, P.; Zhao-Liang, Zhu (1996). "Regional nitrogen budgets and riverine inputs of N and P for the drainages to the North Atlantic Ocean: natural and human influences" (PDF). Biogeochemistry. 35: 75–139. doi:10.1007/BF02179825. S2CID 134209808. Archived from the original (PDF) on 2013-05-03. Retrieved 2013-03-31.
- ^ Bertness, M. D.; Ewanchuk, P. J.; Silliman, B. R. (2002). "Anthropogenic modification of New England salt marsh landscapes". Proceedings of the National Academy of Sciences of the United States of America. 99 (3): 1395–1398. Bibcode:2002PNAS...99.1395B. doi:10.1073/pnas.022447299. JSTOR 3057772. PMC 122201. PMID 11818525.
- ^ Sharpley AN, Daniel TC, Sims JT, Pote DH (1996). "Determining environmentally sound soil phosphorus levels". Journal of Soil and Water Conservation. 51: 160–166.
- ^ Buol, S. W. (1995). "Sustainability of Soil Use". Annual Review of Ecology and Systematics. 26: 25–44. doi:10.1146/annurev.es.26.110195.000325.
- ^ Carpenter, S. R.; Caraco, N. F.; Correll, D. L.; Howarth, R. W.; Sharpley, A. N.; Smith, V. H. (August 1998). "Nonpoint Pollution of Surface Waters with Phosphorus and Nitrogen". Ecological Applications. 8 (3): 559. doi:10.2307/2641247. hdl:1813/60811. JSTOR 2641247.
- ^ Xie, Meixiang; Zhang, Zhanyu; Zhang, Pingcang (16 January 2020). "Evaluation of Mathematical Models in NitrogenTransfer to Overland Flow Subjectedto Simulated Rainfall". Polish Journal of Environmental Studies. 29 (2): 1421–1434. doi:10.15244/pjoes/106031.
- ^ "Critical Loads – Atmospheric Deposition". U.S Forest Service. United States Department of Agriculture. Retrieved 2 April 2018.
- ^ Paerl H. W. (1997). "Coastal Eutrophication and Harmful Algal Blooms: Importance of Atmospheric Deposition and Groundwater as "New" Nitrogen and Other Nutrient Sources" (PDF). Limnology and Oceanography. 42 (5_part_2): 1154–1165. Bibcode:1997LimOc..42.1154P. doi:10.4319/lo.1997.42.5_part_2.1154.[permanent dead link]
- ^ Mungall C. and McLaren, D.J. (1991) Planet under stress: the challenge of global change. Oxford University Press, New York, New York, USA, ISBN 0-19-540731-8.
- ^ "Nutrient Bioextraction Overview". Stamford, CT: Long Island Sound Study partnership. Retrieved 2018-03-22.
- ^ Kroeger, Timm (2012). "Dollars and Sense: Economic Benefits and Impacts from two Oyster Reef Restoration Projects in the Northern Gulf of Mexico" (PDF). The Nature Conservancy. Archived from the original (PDF) on 2016-03-04. Retrieved 2013-05-29.
- ^ Newell, R.I.E., Fisher, T.R., Holyoke, R.R., Cornwell, J.C. (2005). "Influence of eastern oysters on nitrogen and phosphorus regeneration in Chesapeake Bay, USA". In Dame, R., Olenin, S. (ed.). The Comparative Roles of Suspension Feeders in Ecosystems, Vol. 47 (NATO Science Series IV: Earth and Environmental Sciences ed.). Netherlands: Springer. pp. 93–120.CS1 maint: multiple names: authors list (link)
- ^ Grabowski,J.H., Petersen, C.H. (2007). Cuddington, K., Byers, J.E., Wilson, W.G., Hastings, A (ed.). Restoring oyster reefs to recover ecosystem services (Ecosystem Engineers: Concepts, Theory and Applications ed.). Amsterdam: Elsevier-Academic Press. pp. 281–298.CS1 maint: multiple names: authors list (link)
- ^ Rose JM, Tedesco M, Wikfors GH, Yarish C (2010). "International Workshop on Bioextractive Technologies for Nutrient Remediation Summary Report". US Dept Commerce, Northeast Fish Sci Cent Ref Doc. 10-19; 12 p. Available from: National Marine Fisheries Service, 166 Water Street, Woods Hole, MA 02543-1026.
- ^ Kim, Jang K.; Kraemer, George P.; Yarish, Charles (2014). "Field scale evaluation of seaweed aquaculture as a nutrient bioextraction strategy in Long Island Sound and the Bronx River Estuary". Aquaculture. 433: 148–156. doi:10.1016/j.aquaculture.2014.05.034.
- ^ "Frequently Asked Questions about Water Quality Trading". NPDES. EPA. 2016-07-08.
- ^ Jump up to: a b Genevieve Bennett; Nathaniel Carroll; Katherine Hamilton (2013). "Charting New Waters, State of Watershed Payments 2012" (PDF). Washington, DC: Forest Trends Association.
- ^ Source apportionment of nitrogen and phosphorus inputs into the aquatic environment. European Environment Agency. Copenhagen: European Environment Agency. 2005. ISBN 978-9291677771. OCLC 607736796.CS1 maint: others (link)
- ^ Greene, S.; Taylor, D.; McElarney, Y.R.; Foy, R.H.; Jordan, P. (2011). "An evaluation of catchment-scale phosphorus mitigation using load apportionment modelling". Science of the Total Environment. 409 (11): 2211–2221. Bibcode:2011ScTEn.409.2211G. doi:10.1016/j.scitotenv.2011.02.016. PMID 21429559.
- ^ Grizzetti, B.; Bouraoui, F.; Marsily, G. de; Bidoglio, G. (2005). "A statistical method for source apportionment of riverine nitrogen loads". Journal of Hydrology. 304 (1–4): 302–315. Bibcode:2005JHyd..304..302G. doi:10.1016/j.jhydrol.2004.07.036.
- ^ Mockler, Eva M.; Deakin, Jenny; Archbold, Marie; Daly, Donal; Bruen, Michael (2016). "Nutrient load apportionment to support the identification of appropriate water framework directive measures". Biology and Environment: Proceedings of the Royal Irish Academy. 116B (3): 245–263. doi:10.3318/bioe.2016.22. hdl:10197/8444. JSTOR 10.3318/bioe.2016.22. S2CID 133231562.
- ^ Smith, R.V.; Jordan, C.; Annett, J.A. (2005). "A phosphorus budget for Northern Ireland: inputs to inland and coastal waters". Journal of Hydrology. 304 (1–4): 193–202. Bibcode:2005JHyd..304..193S. doi:10.1016/j.jhydrol.2004.10.004.
- ^ Mockler, Eva M.; Deakin, Jenny; Archbold, Marie; Gill, Laurence; Daly, Donal; Bruen, Michael (2017). "Sources of nitrogen and phosphorus emissions to Irish rivers and coastal waters: Estimates from a nutrient load apportionment framework". Science of the Total Environment. 601–602: 326–339. Bibcode:2017ScTEn.601..326M. doi:10.1016/j.scitotenv.2017.05.186. PMID 28570968.
- ^ Jump up to: a b National Nonpoint Source Program: A catalyst for water quality improvements (Report). EPA. October 2016. EPA 841-R-16-009.
- ^ Jump up to: a b "NPDES Permit Basics". EPA. 2018-07-25.
- ^ Kilian, Chris (2010). "Cracking down on Nutrient Pollution: CLF Fights to Bring New England's Coastal Waters Back to Life". Conservation Matters. 16 (2).
- ^ National Strategy for the Development of Regional Nutrient Criteria (Report). EPA. June 1998. EPA 822-R-98-002.
- ^ Grumbles, Benjamin (2007-05-25). "Nutrient Pollution and Numeric Water Quality Standards" (PDF). EPA. Memorandum to State and Tribal Water Program Directors.
- ^ "Watershed-Based permitting". NPDES. EPA. 2016-11-29.
- ^ State Adoption of Numeric Nutrient Standards (1998–2008) (Report). EPA. December 2008. EPA 821-F-08-007.
- ^ "Programmatic Information on Numeric Nutrient Water Quality Criteria". EPA. 2017-05-16.
- ^ An Urgent Call to Action: Report of the State-EPA Nutrient Innovations Task Group (Report). EPA. August 2009. EPA 800-R-09-032.
- ^ Stoner, Nancy K. (2011-03-16). "Working in Partnership with States to Address Phosphorus and Nitrogen Pollution through Use of a Framework for State Nutrient Reductions" (PDF). EPA. Headquarters Memorandum to EPA Regional Administrators.
- ^ "Status of Nutrient Requirements for NPDES-Permitted Facilities". National Pollutant Discharge Elimination System. EPA. 2017-06-08.
- ^ "Removing Nitrogen from Wastewater Protects our Waterways". Washington, D.C.: DC Water. Retrieved 2018-01-15.
- ^ "National Study of Nutrient Removal and Secondary Technologies". EPA. 2018-01-10.
- ^ "Animal Feeding Operations". NPDES. EPA. 2017-01-17.
- ^ "Agriculture". Learn the Issues. Annapolis, Maryland: Chesapeake Bay Program. Retrieved 2018-10-06.
- ^ Jump up to: a b "Overview of Identifying and Restoring Impaired Waters under Section 303(d) of the CWA". EPA. 2018-09-13.
- ^ Jump up to: a b "Total Maximum Daily Load (TMDLs) at Work: New York: Restoring the Long Island Sound While Saving Money". EPA. Retrieved June 14, 2013.
- ^ Golen, Richard F. (2007). "Incorporating Shellfish Bed Restoration into a Nitrogen TMDL Implementation Plan" (PDF). Dartmouth, MA: University of Massachusetts, Dartmouth.
- ^ EPA (December 13, 2011). "Water Quality Standards Academy" (PDF).
- ^ "Chapter 6. Water Quality-Based Effluent Limitations". NPDES Permit Writers' Manual (Report). EPA. September 2010. EPA-833-K-10-001.
 This article incorporates public domain material from the Congressional Research Service document: Jasper Womach "Report for Congress: Agriculture: A Glossary of Terms, Programs, and Laws, 2005 Edition" Check
 |url=value (help).- EPA. "Protecting Water Quality from Agricultural Runoff." March 2005. Document No. EPA 841-F-05-001. Fact sheet.
- Agricultural soil science
- Sustainable agriculture
- Fertilizers
- Organic gardening
- Environmental soil science
- Water pollution