Income inequality metrics
Income inequality metrics or income distribution metrics are used by social scientists to measure the distribution of income and economic inequality among the participants in a particular economy, such as that of a specific country or of the world in general. While different theories may try to explain how income inequality comes about, income inequality metrics simply provide a system of measurement used to determine the dispersion of incomes. The concept of inequality is distinct from poverty[Note 1] and fairness.
Income distribution has always been a central concern of economic theory and economic policy. Classical economists such as Adam Smith, Thomas Malthus and David Ricardo were mainly concerned with factor income distribution, that is, the distribution of income between the main factors of production, land, labour and capital. It is often related to wealth distribution, although separate factors influence wealth inequality.
Modern economists have also addressed this issue, but have been more concerned with the distribution of income across individuals and households. Important theoretical and policy concerns include the relationship between income inequality and economic growth. The article economic inequality discusses the social and policy aspects of income distribution questions.
Defining income[]
All of the metrics described below are applicable to evaluating the distributional inequality of various kinds of resources. Here the focus is on income as a resource. As there are various forms of "income", the investigated kind of income has to be clearly described.
One form of income is the total amount of goods and services that a person receives, and thus there is not necessarily money or cash involved. If a subsistence farmer in Uganda grows his own grain, it will count as income. Services like public health and education are also counted in. Often expenditure or consumption (which is the same in an economic sense) is used to measure income. The World Bank uses the so-called "living standard measurement surveys"[1] to measure income. These consist of questionnaires with more than 200 questions. Surveys have been completed in most developing countries.
Applied to the analysis of income inequality within countries, "income" often stands for the taxed income per individual or per household. Here, income inequality measures also can be used to compare the income distributions before and after taxation in order to measure the effects of progressive tax rates.
Properties of inequality metrics[]
In the discrete case, an economic inequality index may be represented by a function I(x), where x is a set of n economic values (e.g. wealth or income) x={x1,x2,...,xn} with xi being the economic value associated with "economic agent" i.
In the economic literature on inequality four properties are generally postulated that any measure of inequality should satisfy:
- Anonymity or symmetry
- This assumption states that an inequality metric does not depend on the "labeling" of individuals in an economy and all that matters is the distribution of income. For example, in an economy composed of two people, Mr. Smith and Mrs. Jones, where one of them has 60% of the income and the other 40%, the inequality metric should be the same whether it is Mr. Smith or Mrs. Jones who has the 40% share. This property distinguishes the concept of inequality from that of fairness where who owns a particular level of income and how it has been acquired is of central importance. An inequality metric is a statement simply about how income is distributed, not about who the particular people in the economy are or what kind of income they "deserve".
- This is generally expressed mathematically as:
- where P(x) is any permutation of x;

- Scale independence or homogeneity
- This property says that richer economies should not be automatically considered more unequal by construction. In other words, if every person's income in an economy is doubled (or multiplied by any positive constant) then the overall metric of inequality should not change. Of course the same thing applies to poorer economies. The inequality income metric should be independent of the aggregate level of income. This may be stated as:
- where α is a positive real number.

- Population independence
- Similarly, the income inequality metric should not depend on whether an economy has a large or small population. An economy with only a few people should not be automatically judged by the metric as being more equal than a large economy with many people. This means that the metric should be independent of the level of population. This is generally written:
- where is the union of x with (a copy of) itself.


- Transfer principle
- The Pigou–Dalton, or transfer principle, is the assumption that makes an inequality metric actually a measure of inequality. In its weak form it says that if some income is transferred from a rich person to a poor person, while still preserving the order of income ranks, then the measured inequality should not increase. In its strong form, the measured level of inequality should decrease.
Other useful but not mandatory properties include:
- Non-negativity
- The index I(x) is greater than or equal to zero.
- Egalitarian zero
- The index I(x) is zero in the egalitarian case, when all values xi are equal.
- Bounded above by maximum inequality
- The index I(x) attains its maximum value for maximum inequality. (all xi are zero except one) This value is usually unity as the number of agents n approaches infinity.
- Subgroup decomposability[2]
- This property states that if a set of agents x is divided into two disjoint subsets (y and z) then the I(x) is expressible as:
- where μ(x) and μ(y) are the mean incomes of x and y.
- and the w functions are scalar weighting function of the sets y and z. In a stronger statement, wy = μy / μx and wz = μz / μx.


Common income inequality metrics[]
Among the most common metrics used to measure inequality are the Gini index (also known as Gini coefficient), the Theil index, and the Hoover index. They have all four properties described above.
An additional property of an inequality metric that may be desirable from an empirical point of view is that of 'decomposability'. This means that if a particular economy is broken down into sub-regions, and an inequality metric is computed for each sub region separately, then the measure of inequality for the economy as a whole should be a weighted average of the regional inequalities plus a term proportional to the inequality in the averages of the regions. (in a weaker form, it means that it should be an explicit function of sub-regional inequalities, though not necessarily linear). Of the above indexes, only the Theil index has this property.
Because these income inequality metrics are summary statistics that seek to aggregate an entire distribution of incomes into a single index, the information on the measured inequality is reduced. This information reduction of course is the goal of computing inequality measures, as it reduces complexity.
A weaker reduction of complexity is achieved if income distributions are described by shares of total income. Rather than to indicate a single measure, the society under investigation is split into segments, such as into quintiles (or any other percentage of population). Usually each segment contains the same share of income earners. In case of an unequal income distribution, the shares of income available in each segment are different.
In many cases the inequality indices mentioned above are computed from such segment data without evaluating the inequalities within the segments. The higher the number of segments (such as deciles instead of quintiles), the closer the measured inequality of distribution gets to the real inequality. (If the inequality within the segments is known, the total inequality can be determined by those inequality metrics which have the property of being "decomposable".)
Quintile measures of inequality satisfy the transfer principle only in its weak form because any changes in income distribution outside the relevant quintiles are not picked up by this measures; only the distribution of income between the very rich and the very poor matters while inequality in the middle plays no role.
Details of the three inequality measures are described in the respective Wikipedia articles. The following subsections cover them only briefly.
Gini index[]

The Gini index is a summary statistic that measures how equitably a resource is distributed in a population; income is a primary example. In addition to a self-contained presentation of the Gini index, we give two equivalent ways to interpret this summary statistic: first in terms of the percentile level of the person who earns the average dollar, and second in terms of how the lower of two randomly chosen incomes compares, on average, to mean income.[3]
The Gini is the sum, over all income-ordered population-percentiles, of the shortfall, from equal-share, of the cumulative-income up to each population-percentile, with that summed shortfall divided by the greatest value that it could have, with complete inequality.
The range of the Gini index is between 0 and 1 (0% and 100%), where 0 indicates perfect equality and 1 (100%) indicates maximum inequality.
The Gini index is the most frequently used inequality index. The reason for its popularity is that it is easy to understand how to compute the Gini index as a ratio of two areas in Lorenz curve diagrams. As a disadvantage, the Gini index only maps a number to the properties of a diagram, but the diagram itself is not based on any model of a distribution process. The "meaning" of the Gini index only can be understood empirically. Additionally the Gini does not capture where in the distribution the inequality occurs. As a result, two very different distributions of income can have the same Gini index.
20:20 ratio[]

The 20:20 or 20/20 ratio compares how much richer the top 20% of populations are to the bottom 20% of a given population. This can be more revealing of the actual impact of inequality in a population, as it reduces the effect on the statistics of outliers at the top and bottom and prevents the middle 60% from statistically obscuring inequality that is otherwise obvious in the field. The measure is used for the United Nations Development Programme Human Development Indicators.[4][5] The 20:20 ratio for example shows that Japan and Sweden have a low equality gap, where the richest 20% only earn 4 times the poorest 20%, whereas in the UK the ratio is 7 times and in the US 8 times. Some believe the 20:20 ratio is a more useful measure as it correlates well with measures of human development and social stability including the index of child well-being,[6] index of health and social problems,[7] population in prison,[8] physical health,[9] mental health[10] and many others.[11]
Palma ratio[]
The Palma ratio is defined as the ratio of the richest 10% of the population's share of gross national income divided by the poorest 40%'s share.[12] It is based on the work of Chilean economist who found that middle class incomes almost always represent about half of gross national income while the other half is split between the richest 10% and poorest 40%, but the share of those two groups varies considerably across countries.[13]
The Palma ratio addresses the Gini index's over-sensitivity to changes in the middle of the distribution and insensitivity to changes at the top and bottom,[14] and therefore more accurately reflects income inequality's economic impacts on society as a whole. Palma has suggested that distributional politics pertains mainly to the struggle between the rich and poor, and who the middle classes side with.[13]
The carbon Palma ratio, which is derived from the income Palma ratio and described as the ratio of the total emissions of the top 10% of emitters to those of the bottom 40%, is proposed as a new indicator to inform the international community and the general public about the distribution inequality of carbon emissions among individuals. The ratio is calculated both within and between countries using an elastic relationship between individual emissions and income. The results show that the carbon Palma ratios in most developing countries are generally high, implying that they should concentrate more on coordinating regional and income inequalities and primarily encouraging high emitters to reduce in order to enhance emissions and income equity at the same time. The carbon Palma ratios in developed countries are comparatively lower; however, their greater historical obligations to warming indicate that they significantly reduce emissions of all people, in order to increase national mitigation contributions systematically. On a global scale, the current carbon Palma ratio is noticeably higher than within any country, indicating an exceedingly severe inequality when individual emissions are considered outside territorial boundaries.[15]
Hoover index[]
The Hoover index is the simplest of all inequality measures to calculate: It is the proportion of all income which would have to be redistributed to achieve a state of perfect equality.
In a perfectly equal world, no resources would need to be redistributed to achieve equal distribution: a Hoover index of 0. In a world in which all income was received by just one family, almost 100% of that income would need to be redistributed (i.e., taken and given to other families) in order to achieve equality. The Hoover index then ranges between 0 and 1 (0% and 100%), where 0 indicates perfect equality and 1 (100%) indicates maximum inequality.
Galt score[]
The Galt score is a simple ratio of a company's CEO pay to the pay of that company's median worker. A company which pays its CEO many times more than its median employee will have a high Galt score.
It is named for the fictional character John Galt in Ayn Rand's novel Atlas Shrugged (1957).
The score is calculated using the total compensation of the CEO, including salary, bonuses, the value of stock awards and employee stock options, as well as non-equity incentive plan compensation, and nonqualified deferred compensation.
Coefficient of variation[]
The coefficient of variation is the square root of the variance of the incomes divided by the mean income. It has the advantages of being mathematically tractable and its square is subgroup decomposable, but it is not bounded from above.
[]
Wage share is the ratio between Compensation of employees and GDP. In other words, it is the total of employees' income divided by the national income.
Theil index[]
As described in a section below, Theil-L is an income-distribution's dis-entropy per person, measured with respect to maximum entropy (which is achieved with complete equality). (In an alternative interpretation of it, Theil-L is the natural-logarithm of the geometric-mean of the ratio: (mean income)/(income i), over all the incomes. The related Atkinson(1) is just 1 minus the geometric-mean of (income i)/(mean income),over the income distribution.)
Because a transfer between a larger income & a smaller one will change the smaller income's ratio more than it changes the larger income's ratio, the transfer-principle is satisfied by this index.
A Theil index of 0 indicates perfect equality. A Theil index of 1 indicates that the distributional entropy of the system under investigation is almost similar to a system with an 82:18 distribution.[16] This is slightly more unequal than the inequality in a system to which the "80:20 Pareto principle" applies.[Note 2] The Theil index can be transformed into an Atkinson index, which has a range between 0 and 1 (0% and 100%), where 0 indicates perfect equality and 1 (100%) indicates maximum inequality. (See Generalized entropy index for the transformation.)
The Theil index is an entropy measure. As for any resource distribution and with reference to information theory, "maximum entropy" occurs once income earners cannot be distinguished by their resources, i.e. when there is perfect equality. In real societies people can be distinguished by their different resources, with the resources being incomes. The more "distinguishable" they are, the lower is the "actual entropy" of a system consisting of income and income earners. Also based on information theory, the gap between these two entropies can be called "redundancy".[17] It behaves like a negative entropy.
For the Theil index also the term "Theil entropy" had been used. This caused confusion. As an example, Amartya Sen commented on the Theil index, "given the association of doom with entropy in the context of thermodynamics, it may take a little time to get used to entropy as a good thing."[18] It is important to understand that an increasing Theil index does not indicate an increasing entropy, instead it indicates an increasing redundancy (decreasing entropy).
High inequality yields high Theil redundancies. High redundancy means low entropy. But this does not necessarily imply that a very high inequality is "good", because very low entropies also can lead to explosive compensation processes. Neither does using the Theil index necessarily imply that a very low inequality (low redundancy, high entropy) is "good", because high entropy is associated with slow, weak and inefficient resource allocation processes.
There are three variants of the Theil index. When applied to income distributions, the first Theil index (Theil-L) relates to how income is distributed to income earners, whereas the second Theil index (Theil-T) relates to how income-earners are distributed to incomes.
A third "symmetrized" Theil index (Theil-S) is the arithmetic average of the two previous indices. The formula of the third Theil index has some similarity with the Hoover index (as explained in the related articles). As in case of the Hoover index, the symmetrized Theil index does not change when swapping the incomes with the income earners. How to generate that third Theil index by means of a spreadsheet computation directly from distribution data is shown below.
An important property of the Theil index which makes its application popular is its decomposability into the between-group and within-group component. For example, the Theil index of overall income inequality can be decomposed in the between-region and within region components of inequality, while the relative share attributable to the between-region component suggests the relative importance of spatial dimension of income inequality.[19]
Comparison of the Theil index and the Hoover index[]


The Theil index indicates the distributional redundancy of a system, within which incomes are assigned to income earners in a stochastic process. In comparison, the Hoover index indicates the minimum size of the income share of a society, which would have to be redistributed in order to reach maximum entropy. Not to exceed that minimum size would require a perfectly planned redistribution. Therefore, the Hoover index is the "non-stochastic" counterpart to the "stochastic" Theil index.
Applying the Theil index to allocation processes in the real world does not imply that these processes are stochastic: the Theil yields the distance between an ordered resource distribution in an observed system to the final stage of stochastic resource distribution in a closed system. Similarly, applying the Hoover index does not imply that allocation processes occur in a perfectly planned economy: the Hoover index yields the distance between the resource distribution in an observed system to the final stage of a planned "equalization" of resource distribution. For both indices, such an equalization only serves as a reference, not as a goal.
For a given distribution the Theil index can be larger than the Hoover index or smaller than the Hoover index:
- For high inequalities the Theil index is larger than the Hoover index. This means for achieving equilibrium (maximum entropy) in a closed system, more resources would have to be reallocated than in case of a planned and optimized reallocation process, where only the necessary minimum share of resources would have to be reallocated. For an open system the export of entropy (import of redundancy) would allow to maintain the distribution dynamics driven by high inequality.
- For low inequalities the Theil index is smaller than the Hoover index. Here, on the path to reaching equilibrium, a planned and optimized reallocation of resources would contribute more to the dynamics of redistribution than stochastic redistribution. This also is intuitively understandable, as low inequalities also weaken the urge to redistribute resources. People in such a system may tolerate or even foster an increase the inequality. As this is would be an increase of redundancy (an decrease of entropy), redundancy would have to be imported into (entropy would have to be exported from) the society. In that case the society needs to be an open system. In order to increase the redundancy in the distribution category of a society as a closed system, entropy needs to be exported from the subsystem operating in that economic category to other subsystems with other entropy categories in the society. For example, social entropy may increase. However, in the real world, societies are open systems, but the openness is restricted by the entropy exchange capabilities of the interfaces between the society and the environment of that society. For societies with a resource distribution which entropywise is similar to the resource distribution of a reference society with a 73:27 split (73% of the resources belong to 27% of the population and vice versa),[Note 3] the point where the Hoover index and the Theil index are equal, is at a value of around 46% (0.46) for the Hoover index and the Theil index.
Atkinson index[]
Atkinson index (also known as the Atkinson measure or Atkinson inequality measure) is a measure useful in determining which end of the distribution contributed most to the observed inequality.
The Atkinson ε parameter is often called the "inequality aversion parameter", since it regulates the sensitivity of the implied social welfare losses from inequality to income inequality as measured by some corresponding generalised entropy index. The Atkinson index is defined in reference to a corresponding social welfare function, where mean income multiplied by one minus the Atkinson index gives the welfare equivalent equally distributed income.
The index can be turned into a normative measure by imposing a coefficient ε to weight incomes. Greater weight can be placed on changes in a given portion of the income distribution by choosing ε, the level of "inequality aversion", appropriately. The Atkinson index becomes more sensitive to changes at the lower end of the income distribution as ε increases. Conversely, as the level of inequality aversion falls (that is, as ε approaches 0) the Atkinson becomes less sensitive to changes in the lower end of the distribution. The Atkinson index is for no value of ε highly sensitive to top incomes because of the common restriction that ε is nonnegative.
Ratios[]
Another common class of metrics is to take the ratio of the income of two different groups, generally "higher over lower". This compares two parts of the income distribution, rather than the distribution as a whole; equality between these parts corresponds to 1:1, while the more unequal the parts, the greater the ratio. These statistics are easy to interpret and communicate, because they are relative (this population earns twice as much as this population), but, since they do not fall on an absolute scale, do not provide an absolute measure of inequality.
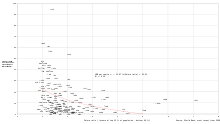
Ratio of percentiles[]

Particularly common to compare a given percentile to the median, as in the first chart here; compare seven-number summary, which summarizes a distribution by certain percentiles. While such ratios do not represent the overall level of inequality in the population as a whole, they provide measures of the shape of income distribution. For example, the attached graph shows that in the period 1967–2003, US income ratio between median and 10th and 20th percentile did not change significantly, while the ratio between the median and 80th, 90th, and 95th percentile increased. This reflects that the increase in the Gini coefficient of the US in this time period is due to gains by upper income earners (relative to the median), rather than by losses by lower income earners (relative to the median).
[]
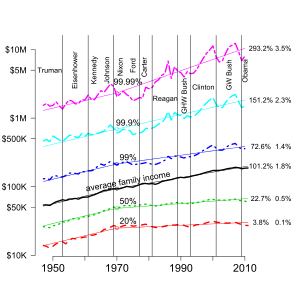
A related class of ratios is "income share", the percentage of the national income received by some specified richest or poorest percentage-segment of the population.
It's often reported[by whom?] for the highest-income 1%, etc., of the population, but the Lorenz Curve (discussed in the Gini section) graphs the cumulative income of the bottom-income X% of the population, for all X from 0 to 100.
An important and obvious property of the Lorenz curve is that, if country A has a higher cumulative national-income share for (say) the poorest 1%, in comparison to country B, then:
- If the two countries' Lorenz curves don't cross, then country A's Lorenz curve is everywhere higher than that of country B, meaning that, for any X from 0 to 100, the poorest X% of the population have a greater national-income-share in country A than in country B.
- If the two countries' Lorenz curves cross, then it's a near-certainty that, on the poor side of the crossing-point, country A has a higher Lorenz curve, meaning that, for any poorest X% of the population up to the crossing-point, country A's population has a greater national-income-share.
When inequality does harm, it does most of it at the poorer end of the population. At a any given income-ordered percentile, a greater national-income-share means a greater received percentage of the equal-share (the national mean income).
So the country with a greater cumulative national-income-share for the poorest 1% will have a greater cumulative received percentage of equal-share for the poorest X%, either for every percentile X, or (if the Lorenz curves cross), for the percentiles on the poorer side of the crossing-point.
Some sources[which?] report several Lorenz-curve data-points (cumulative national income-shares up to several percentiles).
As mentioned above, taking the ratio of income share to subpopulation size corresponds to a ratio of mean subpopulation income relative to mean income.
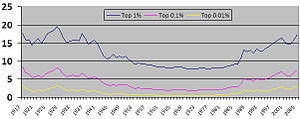
Because income distribution is generally positively skewed, mean is higher than median, so ratios to mean are lower than ratios to median. This is particularly used to measure that fraction of income accruing to top earners – top 10%, 1%, 0.1%, 0.01%, and also "top 100" earners or the like; in the US top 400 earners is 0.0002% of earners (2 in 1,000,000) – to study concentration of income – wealth condensation, or rather income condensation. For example, in the chart at right, US income share of top earners was approximately constant from the mid-1950s to the mid-1980s, then increased from the mid-1980s through 2000s; this increased inequality was reflected in the Gini coefficient.
For example, in 2007 the top decile (10%) of US earners accounted for 49.7% of total wages ( times fraction under equality), and the top 0.01% of US earners accounted for 6% of total wages (600 times fraction under equality).[24]

Approaches[]
Normative approach[]
Normative interpretation of inequality through inequality indexes means that there is a relationship between an and a social-evaluation ordering defined on the incomes — incomes (nominal or real) of the members of society. Incomes are typically assigned to individuals rather than households by using an adult equivalence scale.[25]
Normative approach has been discussed by Charles Blackorby, Walter Bossert and David Donaldson in the work "Income Inequality Measurement: The Normative Approach".
Statistical approach[]
Statistical interpretation of inequality is based on fiscal data and the parameter α from the model of Pareto (1895) as an income inequality measure.[26] This approach is further discussed in work "Income Inequality Measurement: The Statistical Approach" by Giovanni M. Giorgi.
Spreadsheet computations[]
The Gini coefficient, the Hoover index and the Theil index as well as the related welfare functions[27] can be computed together in a spreadsheet.[Note 5] The welfare functions serve as alternatives to the median income.
| Group | Members per group | Income per group | Income per individual | Relative deviation | Accumulated income | Gini | Hoover | Theil |
|---|---|---|---|---|---|---|---|---|
| 1 | A1 | E1 | Ē1 = E1/A1 | D1 = E1/ΣE - A1/ΣA | K1 = E1 | G1 = (2 * K1 - E1) * A1 | H1 = abs(D1) | T1 = ln(Ē1) * D1 |
| 2 | A2 | E2 | Ē2 = E2/A2 | D2 = E2/ΣE - A2/ΣA | K2 = E2 + K1 | G2 = (2 * K2 - E2) * A2 | H2 = abs(D2) | T2 = ln(Ē2) * D2 |
| 3 | A3 | E3 | Ē3 = E3/A3 | D3 = E3/ΣE - A3/ΣA | K3 = E3 + K2 | G3 = (2 * K3 - E3) * A3 | H3 = abs(D3) | T3 = ln(Ē3) * D3 |
| 4 | A4 | E4 | Ē4 = E4/A4 | D4 = E4/ΣE - A4/ΣA | K4 = E4 + K3 | G4 = (2 * K4 - E4) * A4 | H4 = abs(D4) | T4 = ln(Ē4) * D4 |
| Totals | ΣA | ΣE | Ē = ΣE/ΣA | ΣG | ΣH | ΣT | ||
| Inequality measures | Gini = 1 - ΣG/ΣA/ΣE | Hoover = ΣH / 2 | Theil = ΣT / 2 | |||||
| Welfare function | WG = Ē * (1 - Gini) | WH = Ē * (1 - Hoover) | WT = Ē * (1 - Theil) |
In the table, fields with a yellow background are used for data input. From these data inequality measures as well as the related welfare functions are computed and displayed in fields with green background.
In the example given here, "Theil index" stands for the arithmetic mean of a Theil index computed for the distribution of income within a society to the individuals (or households) in that society and a Theil index computed for the distribution of the individuals (or households) in the society to the income of that society. The difference between the Theil index and the Hoover index is the weighting of the relative deviation D. For the Hoover index the relative deviation D per group is weighted with its own sign. For the Theil index the relative deviation D per group is weighted with the information size provided by the income per individual in that group.
For the computation the society usually is divided into income groups. Often there are four or five groups consisting of a similar number of individuals in each group. In other cases the groups are created based on income ranges which leads to having different numbers of individuals in the different groups. The table above shows a computation of inequality indices for four groups. For each group the number of individuals (or households) per group A and the total income in that group E is specified.
The parameter pairs A and E need to be sorted for the computation of the Gini coefficient. (For the Theil index and the Hoover index no sorting is required.) A and E have to be sorted so that the values in the column "Income per individual" are lined up in ascending order.
Proper use[]
- When using income metrics, it has to be made clear how income should be defined. Should it include capital gains, imputed house rents from home ownership, and gifts? If these income sources or alleged income sources (in the case of "imputed rent") are ignored (as they often are), how might this bias the analysis? How should non-paid work (such as parental childcare or doing one's own cooking instead of hiring a chef for every meal) be handled? Wealth or consumption may be more appropriate measures in some situations. Broader quality of life metrics might be useful.
- The comparison of inequality measures requires that the segmentation of compared groups (societies etc.) into quintiles should be similar.
- Distinguish properly, whether the basic unit of measurement is households or individuals. The Gini value for households is always lower than for individuals because of income pooling and intra-family transfers. And households have a varying number of members. The metrics will be influenced either upward or downward depending on which unit of measurement is used.
- Consider life cycle effects. In most Western societies, an individual tends to start life with little or no income, gradually increase income till about age 50, after which incomes will decline, eventually becoming negative. This affects the conclusions which can be drawn from a measured inequality. It has been estimated (by A.S. Blinder in The Decomposition of Inequality, MIT press) that 30% of measured income inequality is due to the inequality an individual experiences as they go through the various stages of life.
- Clarify whether real or nominal income distributions should be used. What effect will inflation have on absolute measures? Do some groups (e.g., pensioners) feel the effect of inflation more than others?
- When drawing conclusion from inequality measurements, consider how we should allocate the benefits of government spending? How does the existence of a social security safety net influence the definition of absolute measures of poverty? Do government programs support some income groups more than others?
- Inequality metrics measure inequality. They do not measure possible causes of income inequality. Some alleged causes include: life cycle effects (age), inherited characteristics (IQ, talent), willingness to take chances (risk aversion), the leisure/industriousness choice, inherited wealth, economic circumstances, education and training, discrimination, and market imperfections.
- Inequality metrics are anonymous. They ignore certain effects of income mobility, in which the identity of "who is rich" and "who is poor" is considered. For example, at a particular time, Alice may have $10 and Bob may have $2. At some time later, Bob may have $10 and Alice may have $2. The inequality index will be the same in both cases and rather high. However, the inequality of the average will be zero, since Alice's and Bob's average holdings are equal ($6). The $8 which has changed hands is a measure of wealth mobility and the average inequality is generally higher than the inequality of the average.
Keeping these points in mind helps to understand the problems caused by the improper use of inequality measures. However, they do not render inequality coefficients invalid. If inequality measures are computed in a well explained and consistent way, they can provide a good tool for quantitative comparisons of inequalities.
Inequality, growth, and progress[]
Evidence from a broad panel of recent academic studies shows that there is a nonlinear relation between income inequality and the rate of growth and investment. Very high inequality slows growth; moderate inequality encourages growth. Studies differ on the effect of very low inequality.
Robert J. Barro, Harvard University found in his study "Inequality and Growth in a Panel of Countries" that higher inequality tends to retard growth in poor countries and encourage growth in well-developed regions.[28] Underscoring the need for initiatives like the United Nations Sustainable Development Goal 10, aim at reducing inequality.[29] According to Pak Hung Mo, income inequality has significant negative effect on the rate of GDP growth. In their work "Income Inequality and Economic Growth", they found out that the most important is the transfer channel while the least important is the human capital channel. However, the direct impact of income inequality on the rate of productivity growth accounts for more than 55 percent of its overall total effect. This indicates that the effects of income inequality on economic growth are much more complicated than what we have perceived or modeled.[30]
In their study for the World Institute for Development Economics Research, Giovanni Andrea Cornia and (2001) reach slightly different conclusions.[31][32] The authors therefore recommend to pursue moderation also as to the distribution of wealth and particularly to avoid the extremes. Both very high egalitarianism and very high inequality cause slow growth. Considering the inequalities in economically well developed countries, public policy should target an 'efficient inequality range'. The authors claim that such efficiency range roughly lies between the values of the Gini coefficients of 0.25 (inequality close to the least unequal European counties) and 0.40 (close to the level of inequality of US.
According to the work "Inequality of Opportunity, Income Inequality, and Economic Growth," the relationship between income inequality and economic growth is mediated by the level of equality of opportunity, as identified by intergenerational mobility. After a number of recently developed internationally comparable measures of intergenerational mobility they confirmed that the negative impact of income inequality on growth increases as intergenerational mobility decreases. The findings imply that excluding intergenerational mobility leads to misspecification, which explains why the empirical literature on income inequality and growth has been so inconclusive.[33]
Another researcher has shown that in perfect markets inequality does not influence growth.[34]
The precise shape of the inequality-growth curve obviously varies across countries depending upon their resource endowment, history, remaining levels of absolute poverty and available stock of social programs, as well as on the distribution of physical and human capital.
See also[]
- List of countries by income equality
- List of countries by wealth equality
- Income inequality in the United States
- Income deficit
- International inequality
- Kuznets curve
- Poverty threshold
- Socioeconomics
- United Nations Millennium Development Goals
- "The rich get richer and the poor get poorer"
- Distributive justice – political ideal dedicated to greater income equality
- Diversity index
- Great Gatsby curve
- Human Development Index
- Suits index
Notes[]
- ^ For poverty see FGT metrics.
- ^ A Theil index of 0.5 characterizes systems which are close to a 74:26 distribution. A 92:8 distribution would yield a Theil index of 2 and 98:2 would yield 4. Some special observations: For an 80:20 distribution (Pareto principle) the Theil index is 0.83. For 73:27 the Theil index and the Hoover index are identical: Both are 0.46. For 62:38 the difference between the Theil index (representing stochastic distribution) and the Hoover index (representing a perfectly planned distribution) reaches a minimum of −0.12.
- ^ In such societies, which are separated into two so called "a-fractiles", the Hoover index and the Gini coefficient always are similar.
- ^ The differences between the Census and Internal Revenue Service Data can be seen most easily in the 95th percentile, present in both data sets. For more details see the help file for the "incomeInequality" data in the Ecdat package available from the Comprehensive R Archive Network (CRAN; see r-project.org).
- ^ As an alternative to spreadsheet computations also a Python script can be used.
References[]
- ^ "Survey Unit – surveyunit". Worldbank.org. Retrieved 8 September 2018.
- ^ "Basics and Completely Decomposable Groups", Almost Completely Decomposable Groups, CRC Press, pp. 37–72, 2000-03-09, doi:10.1201/9781482287486-8, ISBN 978-0-429-07843-9, retrieved 2021-04-30
- ^ "Figure 5.8. Gini coefficients of different measures of inter provincial inequality". dx.doi.org. doi:10.1787/778454437583. Retrieved 2021-04-30.
- ^ "Notes on Statistical Sources and Methods – The Equality Trust". Equalitytrust.org.uk. Retrieved 8 September 2018.
- ^ Panel Data Econometrics: Theoretical Contributions And Empirical Applications edited by Badi Hani Baltag
- ^ "Radiography". Br Med J. 2 (4157): 321. 7 September 1940. doi:10.1136/bmj.2.4157.321-a. S2CID 214960331. Retrieved 8 September 2018 – via www.bmj.com.
- ^ "Archived copy". Archived from the original on 2013-05-25. Retrieved 2013-05-18.CS1 maint: archived copy as title (link)
- ^ "Imprisonment – The Equality Trust". Equalitytrust.org.uk. Retrieved 8 September 2018.
- ^ "Physical Health – The Equality Trust". Equalitytrust.org.uk. Retrieved 8 September 2018.
- ^ "Mental Health – The Equality Trust". Equalitytrust.org.uk. Retrieved 8 September 2018.
- ^ "External Research – Page 2 – The Equality Trust". Equalitytrust.org.uk. Retrieved 8 September 2018.
- ^ Alex Cobham; Andy Sumner (15 March 2013). "Putting the Gini Back in the Bottle? 'The Palma' as a Policy-Relevant Measure of Inequality" (PDF). King's International Development Institute. King's College London. Archived from the original (PDF) on 23 April 2013. Retrieved 14 January 2019.
- ^ a b Palma, José Gabriel (January 2011). "Homogeneous middles vs. heterogeneous tails, and the end of the 'Inverted-U': the share of the rich is what it's all about" (PDF). Cambridge Working Papers in Economics (CWPE) 1111. Cambridge University. Retrieved 19 March 2013.
- ^ Atkinson, Anthony (1970). "On the Measurement of Inequality" (PDF). Journal of Economic Theory. 2 (3): 244–63. doi:10.1016/0022-0531(70)90039-6. Retrieved 19 March 2013.
- ^ Pan, Xunzhang; Wang, Hailin; Wang, Ziwei; Lin, Lu; Zhang, Qi; Zheng, Xinzhu; Chen, Wenying (December 2019). "Carbon Palma Ratio: A new indicator for measuring the distribution inequality of carbon emissions among individuals". Journal of Cleaner Production. 241: 118418. doi:10.1016/j.jclepro.2019.118418. ISSN 0959-6526.
- ^ "On Line Calculator: Inequality". Poorcity.richcity.org. Retrieved 8 September 2018.
- ^ ISO/IEC DIS 2382-16:1996 (Information theory)
- ^ pp. 35, chapter 2.11 in Amartya Sen and James E. Foster: On Economic Inequality, Oxford University Press, 1996 (Python script for a selection of formulas in the book).
- ^ Novotny, J. (2007). "On the measurement of regional inequality: Does spatial dimension of income inequality matter?" (PDF). Annals of Regional Science. 41, 3 (3): 563–80. doi:10.1007/s00168-007-0113-y. S2CID 51753883.
- ^ "Table F-1. Income Limits for Each Fifth and Top 5 Percent of Families (All Races): 1947 to 2010". Current Population Survey, Annual Social and Economic Supplements. United States Census Bureau. Retrieved 2012-01-24.
median computed as the geometric mean of the 20th and 40th percentiles
- ^ Piketty, Thomas; Saez, Emmanuel, "Income Inequality in the United States, 1913–2002", in Atkinson, A. B.; Piketty, Thomas (eds.), Top incomes over the twentieth century : a contrast between continental European and English-speaking countries, retrieved 2012-02-08
- ^ Saez, E. & Piketty, T. (2003). "Income inequality in the United States: 1913–1998". Quarterly Journal of Economics, 118(1), 1–39.
- ^ "Saez, E. (October, 2007). Table A1: Top fractiles income shares (excluding capital gains) in the U.S., 1913–2005". Elsa.berkeley.edu. Retrieved 2008-01-17.
- ^ "Striking it Richer: The Evolution of Top Incomes in the United States", updated August 2009, Emmanuel Saez, summary of work for the broader public.
- ^ Charles., Blackorby (1999). Income inequality measurement: the normative approach. [s.n.] OCLC 848679839.
- ^ Maria., Giorgi, Giovanni (1999). Income inequality measurement: the statistical approach. [s.n.] OCLC 848679881.
- ^ James E. Foster & Amartya Sen, 1997, On Economic Inequality, expanded edition with a substantial annexe, ISBN 0-19-828193-5. For computing the welfare function, Sen gave an example using the Gini coefficient whereas Foster used an entropy measure. The Theil index is such an entropy measure.
- ^ "Inequality and Growth in a Panel of Countries" (PDF). Scholar.harvard.edu. Retrieved 8 September 2018.
- ^ "Goal 10 targets". UNDP. Retrieved 2020-09-23.
- ^ Mo, Pak Hung (2000). "Income Inequality and Economic Growth". International Review for Social Sciences. 53 (3): 293–315. doi:10.1111/1467-6435.00122.
- ^ "Inequality, Growth and Poverty in the Era of Liberalization and Globalization". UNU-WIDER. 2015-08-18. Retrieved 2019-05-25.
- ^ "UNU-WIDER : Publications" (PDF). UNU-WIDER. Retrieved 8 September 2018.
- ^ Aiyar, Shekhar; Ebeke, Christian (December 2020). "Inequality of opportunity, inequality of income and economic growth". World Development. 136: 105115. doi:10.1016/j.worlddev.2020.105115. ISSN 0305-750X.
- ^ Wolfgang Kitterer: Mehr Wachstum durch Umverteilung? (More Growth through Redistribution?), 2006
Literature[]
- A.B. Atkinson and F. Bourguignon, ed. (2000). Handbook of Income Distribution, v. 1. Elsevier.table of contents
- _____," International Encyclopedia of the Social & Behavioral Sciences (2001), pp. 7265–7271. Abstract.
- Yoram Amiel (Author), Frank A. Cowell: Thinking about Inequality: Personal Judgment and Income Distributions, 2000
- Philip B. Coulter: Measuring Inequality, 1989
External links[]
- Travis Hale, University of Texas Inequality Project: The Theoretical Basics of Popular Inequality Measures; online computation of examples: 1A, 1B
- Samuel Murray Matheson: Distributive Fairness Measures for Sustainable Project Selection, 1997
- Luxembourg Income Study conducts comparative income inequality research
- Two Americas: One Rich, One Poor? Understanding Income Inequality in the United States
- Has US Income Inequality Really Increased?
- A website dedicated to the topic of income inequality
- WIID – World Income Inequality Database, United Nations University World Institute for Development Economics Research
- Software:
- Online calculator computes the Gini Coefficient, plots the Lorenz curve, and computes many other measures of concentration for any dataset
- Online calculator: Online (example for processing data from Table HINC-06, U.S. Census Bureau, 2007: Income Distribution to $250,000 or More for Households) and downloadable scripts (Python and Lua) for Atkinson, Gini, and Hoover inequalities
- Python script using formulas in Amartya Sen's On Economic Inequality
- Users of the R data analysis software can install the ineq package which allows for computation of a variety of inequality indices including Gini, Atkinson, Theil.
- A MATLAB Inequality Package, including code for computing Gini, Atkinson, Theil indexes and for plotting the Lorenz Curve. Many examples are available.
- Income inequality metrics
- Welfare economics