International inequality
This article includes a list of general references, but it remains largely unverified because it lacks sufficient corresponding inline citations. (September 2020) |


International inequality refers to the topic of inequality between countries and can be compared to global inequality, which refers to inequality between people across countries. Recent international inequality research has primarily been concentrated on the rise of international income inequality, but a broadens scope of international disparity may also include factors such as educational and health inequality,[2] as well as differences in medical access.
Reducing inequality within and among countries is the 10th goal of the UN Sustainable Development Goals and ensuring that no one is left behind are both central for achieving them.[3]
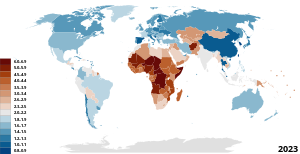
International inequality around the globe can be measured by looking at the Gini coefficient, a simple term that allows us to track a single number whose rise or fall implies an increase or decrease in inequality in one country, or to compare relative levels of inequality in different countries.
According to the United Nations Human Development Report 2004, the gross domestic product (GDP) per capita in countries with high, medium and low human development (a classification based on the UN Human Development Index) was 24,806, 4,269 and 1,184 PPP$, respectively (PPP$ = purchasing power parity measured in United States dollars).[4] The wealthiest people in the world, especially those with over $100,000 in assets, 1.8% of the global population, own 86.4% of the overall wealth (See data for more information).[5]
Proposed explanations[]
In economics and political science, a variety of explanations have been advanced to explain the magnitude of the disparity in economic growth and development between nations.
Causes[]
Multiple hypotheses have been proposed to explain international inequality, but none of them explains all observed facts:
1. Geography: The location of countries often affects their economy. For example, landlocked countries historically have had a disadvantage of not accessing low-cost sea trade routes.;[6][7]
2. Colonialism: Many countries experienced (or are experiencing) times, when other nation(s) deprived them of economic and social progress.
3. Structure of Economy: the economies of wealthy countries are usually based on high profit margin and monopolistic industries (such as software Software industry and patented pharmaceuticals Pharmaceutical industry), whereas mid-income countries rely more on industrial manufacturing, and poor countries have agricultural economies.[8]
4. Population Growth: Poor countries have had a large increase in population over the years. This causes a lack of resources. More people mean more resources being used.
5. Government Policies: most dictatorial regimes limit business development opportunities to their citizens, see North Korea as an example.
6. Political Instability: Countries that have no governmental structure have problems with deciding how to use resources. For example, Angola has an abundance of resources. However, due to not having a stable political system, they are suffering from a poor economy and low life-expectancy.
7. Natural Disasters: Earthquakes, droughts, hurricanes, and many other disasters play a role in the inequality within countries.[9]
8. Some theories put forward arguments of biological differences between nations, such as based on childhood malnutrition (see IQ and the Wealth of Nations).
9. The continuing use in the international trade of the US dollar after the end of its gold convertibility (see Bretton Woods system) allows the US government to create wealth simply by emitting new money.[10]
Differences in economic institutions[]
Economic institutions such as competitive markets, credible contracts and systems of property rights allow economic agents to pursue the economic activities which form the basis of growth. It has been argued that the presence or absence of strong economic institutions is a primary determinant of development. Economists have begun to consider the set of economic institutions adopted by countries as a choice that is in turn determined endogenously by competing social forces.
In the colonial setting[]
Pointing to European colonization as a "natural experiment," Daron Acemoglu, Simon Johnson and James A. Robinson argue that colonizers who encountered dense populations with developed economies such as in Central America and India were incentived to impose extractive economic institutions, while colonizers who encountered sparse populations with few natural resources such as in North America were more likely to institute broad-based property rights. This resulted in a "reversal of fortune" around 1800 as regions which were under-developed at the time of colonization were able to industrialize more effectively. By instrumenting the strength of property rights in colonized nations with European settler mortality (a quasi-random determinant of whether Europeans were able to establish colonies), the authors conclude in a widely cited paper that the majority of present-day inequality among former European colonies can be attributed to the persisting role of economic institutions.
Path dependence[]
In the context of development, path dependence encapsulates the idea that certain decisive moments in history may have an outsized and persistent impact on the long-run economic and political character of nations. These moments, known as critical junctures, may produce outcomes that induce positive feedback and thereby set nations on patterns of development that are difficult to reverse.
In Central America[]
Political scientist James Mahoney has examined the political consequences of a period of liberal reform that swept Central America in the 19th and early 20th centuries. As an example of path dependence, the author argues that whether policies were implemented along radical or reformist guidelines directly determined the success of the liberalization efforts and ultimately resulted in vastly different political outcomes which persisted for decades, ranging from military authoritarian regimes (Guatemala and El Salvador) to progressive democracy (Costa Rica).
Other explanations[]
A multitude of other explanations have been propounded including:
- Environmental factors (including work by Jared Diamond)
- Cultural factors (including work by Max Weber)
Economic inequality in Industrial revolution[]
The Industrial Revolution had a big impact on the inequality between people and countries, giving the new parameters of what is a rich or poor country. The Industrial Revolution gives a new sense to the word "Powerful country" and this was if you are an industrialized country you have power and if you are non-industrialized you are weak. To keep the factories, machines and workers in a good state the countries needed primary material so one of the industrialized countries, England had an idea, to extract these primary materials from the non-developed countries (colonies), then other industrialized countries like Japan, the United States and Russia did the same strategy as England, they used the poorest countries to their own benefit, and the imperialism began in this point: this was the practice extending the power of powerful countries in the poorest ones, controlling the economy, production and politics, making the wealthy nations more wealthy and the poorest nations poorer. Inside the countries, the tight gap between the social classes became bigger, and the powerful people started to make the technologies of machines, doing the process faster and cheaper, so many workers lost their jobs because the machines could replace them, creating more inequality between the social classes.
International inequality during COVID-19[]
The COVID-19 pandemic is widely believed to have worsened global income inequality by lowering per capita incomes in developing countries more than in developed countries. However, despite better-quality health systems, higher wages, more competent governments, and better preparedness, rich countries have seen more deaths per head than poor countries. Thus, looking at country by country, international income inequality has decreased during COVID-19. Yet, looking at countries in terms of population, international income inequality increased.[12] On the other side, data from the UN shows how the pandemic has hit the vulnerable groups hardest, including people of age, people with disabilities, children, women and refugees.[3]
International wealth distribution[]

A study by the World Institute for Development Economics Research at United Nations University reports that the richest 1% of adults alone owned 40% of global assets in the year 2000, and that the richest 10% of adults accounted for 85% of the world total. The bottom half of the world adult population owned barely 1% of global wealth. In 2013, Oxfam International released a report to The World Economic Forum that the richest 1% owns 48 percent of the global wealth.[13] In 2014, Oxfam reported that the 85 wealthiest individuals in the world have a combined wealth equal to that of the bottom 50% of the world's population, or about 3.5 billion people.[14][15][16][17][18] More recently, in January 2015, Oxfam reported that the wealthiest 1 percent will own more than half of the global wealth by 2016.[19]
The major component of the world's income inequality (the global Gini coefficient) is comprised by two groups of countries (called the "twin peaks" by Quah [1997]).
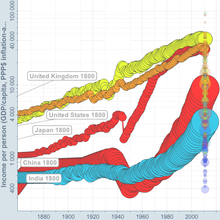
- The first group has 13% of the world's population and receives 45% of the world's PPP income. This group includes the United States, Japan, Germany, the United Kingdom, France, Australia and Canada, and comprises 500 million people with an annual income level over 11,500 PPP$.
- The second group has 42% of the world's population and receives only 9% of the world PPP income. This group includes India, Indonesia and rural China, and comprises 2.1 billion people with an income level under 1,000 PPP$. (See Milanovic 2001, p. 38).
Economic inequality often closely matches a lognormal or Pareto distribution both across economies and within them.[citation needed]
The evolution of the income gap between poor and rich countries is related to convergence. Convergence can be defined as "the tendency for poorer countries to grow faster than richer ones and, hence, for their levels of income to converge".[20] Convergence is a matter of current research and debate, but most studies have shown lack of evidence for absolute convergence based on comparisons among countries.[citation needed]
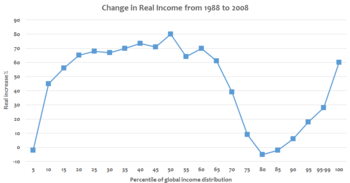
According to current research, global income inequality peaked approximately in the 1970s when world income was distributed bimodally into "rich" and "poor" countries with little overlap. Since then inequality have been rapidly decreasing, and this trend seems to be accelerating. Income distribution is now unimodal, with most people living in middle-income countries.[21]
Global Poverty[]

Global poverty is when people within certain countries are living on less than a dollar a day.
There are six different aspects that can attribute to global poverty.
Six Dimensional Aspects[]
1. Hunger: Countries without the proper amount of food to survive.
2. Mental state: This is where people or the country as a whole are feeling powerless, ashamed, or humiliated. This is connected to the fact that they must rely or ask other countries for help and are unable to survive on their own.
3. Poor groundwork: Lack of roads, clean water, transportation, etc. meaning that they do not have a stable foundation in order to provide these things.
4. Education: People do not have access to proper education or any education at all.
5. Health: Countries are unable to provide the proper health care that many people need in order to survive.
6. Lack of income: People within a poor country tend to put income aside and focus on their family, physical, and environmental assets.
Lack of Decline in Global Poverty[]
Along with these six-dimensional aspects, there are also some more things preventing the decline of global poverty. One reason is because of the ongoing armed conflicts going on throughout countries. Some countries who are suffering from poverty, and are not receiving aid from other countries due to not wanting to be a part of the conflict. Countries do not want to cause problems with other countries, so they decide to stay neutral and not help.
A second reason for number of countries in poverty not declining would be that there is not a lot of support from other countries. Many rich countries, such as the United States, do not give a lot of support to countries in poverty. Again, this can connect to the sense of not wanting to get involved with countries in conflict.
The final reason has to do with certain organizations not knowing where and what to start with. These organizations can see that there are a lot of countries who are in poverty and need help. However, it can be a challenge deciding who gets what money and how much they get. These organizations do not have unlimited funds and need to be careful where money is being used.[22]

Comparisons[]
Some of the economic disparities among nations can be better appreciated when rich and poor countries or societies are contrasted. For example, with regard to income inequality, according to some estimates by Branko Milanovic from the World Bank:
- "An American having the average income of the bottom U.S. decile is better-off than 2/3 of world population." (Milanovic 2002, p. 50)
- "The top 10% of the U.S. population has an aggregate income equal to income of the poorest 43 percent of people in the world, or differently put, total income of the richest 25 million Americans is equal to total income of almost 2 billion people." (Milanovic 2002, p. 50)
With regard to wealth inequality (researchers defined wealth as the value of physical and financial assets minus debts), a 2006 report with data from 2000 concluded that:
- "India dominates the bottom third of the global wealth distribution, contributing a little under 27% of this group. The middle third of the distribution is the domain of China which supplies more than a third of those in deciles 4–8. At the top end, North America, Europe and high-income Asia monopolise the top decile, each regional group accounting for around one-third of the richest wealth holders" (Davies et al. 2006, p. 27)
- "the top 10% of adults own 85% of global household wealth, so that the average member of this group has 8.5 times the global average holding. The corresponding figures for the top 5%, top 2%, and top 1% are 71% (14.2 times the average), 51% (25 times the average) and 40% (40 times the average), respectively. This compares with the bottom half of the distribution which collectively owns barely 1% of global wealth. Thus the top 1% own almost 40 times as much as the bottom 50%. The contrast with the bottom decile of wealth holders is even starker. The average member of the top decile nearly 3,000 times the mean wealth of the bottom decile, and the average member of the top percentile is more than 13,000 times richer." (Davies et al. 2006, p. 26)
- "for the world as a whole the share of the top 10% was 85% in the year 2000 and the Gini equalled 0.892 using official exchange rates" (Davies et al. 2006, p. 32)
- "only $2,161 was needed in order to belong to the top half of the world wealth distribution, but to be a member of the top 10% required at least $61,000 and membership of the top 1% required more than $500,000 per adult." (Davies et al. 2006, p. 25)
James Davies, Professor of Economics at the University of Western Ontario, and one of the authors of the report, said: "Income inequality has been rising for the past 20 to 25 years and we think that is true for inequality in the distribution of wealth." "There is a group of problems in developing countries that make it difficult for people to build assets, which are important, since life is so precarious."[24]
Other disparities can be better appreciated when rich individuals (or corporations) are compared against poor individuals. According to some estimates, for instance:
- "The richest 1% of people in the world receive as much as the bottom 57%, or in other words, less than 50 million richest people receive as much as 2.7 billion poor." (Milanovic 2002, p. 50)
- The three richest people possess more financial assets than the poorest 10% of the world's population, combined [6]. Link broken.
- As of May 2005, the three richest people in the world have total assets that exceed the annual combined GDP of the 47 countries with the least GDP, (calculation based on data from list of countries by GDP (PPP) and list of billionaires) (Annan, 1998)
- As of May 2005, the 125 richest people in the world have assets that exceed the annual combined GDP of all the least developed countries (calculation based on data from list of countries by GDP (PPP) and list of billionaires).
Data[]

As of 2017, over 70% of the world's adults have under $10,000 in wealth. This can be seen through the bar graph on the right. This bar graph also shows that as the value rises, the total percentage of adults falls. This is because there are not a large percent of people who make a lot nor have a lot. Only .7% of the world has one million dollars or more in wealth.
However, looking at the wealth share, this number continues to rise. This is because those few people who have higher assets in wealth, typically hold a larger percentage of the world's wealth.[25]
Wealth:
- 6% of the world's population owns 52% of the global assets. The richest 2% own more than 51% of the global assets and the richest 10% own 85% of the global assets.
- 50% of the world's population own less than 1% of the global assets.[26]
- The whole global assets volume is about $125 trillion.[27]
- 1,125 billionaires (US dollars) own $4.4 trillion in assets[28]
- Over 80% of the world's population lives on less than $10 per day.[29] over 50% of the world population lives on less than 2 US$/day;[30] over 20% of the world population lives on less than $1.25/day[31]
Income:
- In 2005, 43% of the world population (3.14 billion people) have an income of less than $2.5 per day. 21.5% of the world population (1.4 billion people) have an income of less than $1.25 per day.[32]
- In 1981, 60% of the world population (2.73 billion people) had an income of less than $2.5 per day and 42% of the world population (1.91 billion people) had an income of less than $1.25 per day.
- In 2008, 17% of the people in the developing countries are on the verge of starvation.[33]
- The proportion of poor people (with less than $3,470 per year) is 78%. The proportion of rich people (with more than $8,000/year) is 11%.[34]
Welfare spending: If East Asia and southern Latin American countries are taken out of the equation, the differences in government spending between the industrialized and developing is as follows:
- Social expenditures, as a proportion for GDP for Indonesia or the Dominican Republic, registers around the 2–3 per cent mark, compared to Sweden or France which at the moment hover just under the 30%.
- In contrast to the industrialized states, from 1980 to 1990 many southern states experienced a decline in social spending as a percentage of overall government spending.
Therefore, in contrast to the North, the developing states are far more vulnerable to the pressures arising from economic globalization. Overall, social spending is far lower in the South, with some regions registering just a few percentage points of GDP.[35] However, some people argue that decrease in welfare spending is not an issue of global inequality but rather a common phenomenon in an era of globalization.[36]
Proposed solutions[]
Some potential solutions to help with decreasing the inequality levels are:
- Education and Family Planning: Many countries with education access have higher income levels. Part of this is because people are striving for a career and are striving for higher education. Countries that do not have access to education have lower incomes. Women who have access to an education will have fewer children because they are focusing on building themselves.
- Democracy (maybe of some help): Democracy offers people the opportunity to vote on people in power or specific issues. This can help with people having a say in what goes on and what happens within their country, making decisions on where money is spent and programs that can help provide for the poor.
- Government policies: The government could play an important role on the economy and poverty. The government can create policies that can aid the poor and help provide proper medicine to those in need.
- Pay attention to women: Women play a large role in inequality through the raising of children. They help with children's education and they encourage their children to reach their potential. If women are feeling good about themselves, then they can take that positive attitude in order to help raise their own children for success.
- Improve agriculture: Poor countries tend to suffer from food shortages. One thing that could be done is to help improve farming grounds and livestock development. By starting the proper groundwork for crops, it will help provide the nutrition that many people need. Livestock can provide milk, eggs, meat, and cheese for consuming. This can also help provide fur and feathers for making clothing and other goods, which could be sold to help with low income.
- Think Small: Having volunteers travel to poor countries in order to help can make a large difference to those countries. Going to help build homes, do studies on the area, or even to help provide food/clean water can make a large difference to developing countries.[37]
- A global wealth tax: Thomas Piketty have proposed an international agreement between nation aimed at creating a global wealth tax, in order to prevent a dangerous rise in the concentration of wealth and international inequality. The countries will, according to this theory, agree to tax all personal assets at phased rates under the scheme. The simplest version of Piketty's wealth tax will levy a 1% tax on net worth between $1.3 million and $6.5 million, and a 2% tax on wealth above $6.5 million. Additional tax brackets are being considered by Piketty, including a 0.5 percent bracket beginning at about $260,000.[38] Piketty suggests the global and coordinated wealth tax as the remedy to trends of global inequality, reasoning that only such a direct assault on wealth concentration can be successful where other governmental policies in respective economics so far have failed. Thus, he states that a higher tax rate on the worlds wealthy is the path to a fairer and more prosperous future. The global wealth-tax idea has so far failed to gain ground and been subject of criticism. Schuyler argues that investment, salaries, incomes, and national production all will suffer significant declines as a result of the wealth tax, making all groups worse off. In addition, he raises problems of large administrative and enforcement hurdles, making Piketty’s wealth tax impractical to a large extend
- Stop Illicit Outflows: Constraining illicit financial outflows to a larger extend can support a reduced rate of income inequality in the world. With the increasing international trade following a globalized world, the opportunities for illicit financial outflows are accumulating as well. Developing countries around the globe lost $6.6 trillion to illicit financial flows from 2003 to 2012, with illicit outflows rising at an average of 9.4 percent each year.[39] Those trillions are thus lost for the countries, which could have aided in the reduction of inequality and poverty through investments into human capital, infrastructure and economic growth. Thus, a strong correlation exists between higher illicit outflows and higher levels of poverty and economic inequality.[40] Such development can harm workers and governments and stopping the outflows may pose as a possible solution to global inequality.
- Worker unions: Historically, labor unions have played an important role in reducing wealth differences. They are able to negotiate higher pay for different waged jobs, but particularly for the low-wage workers. Income disparity is typically lower in countries with higher union membership and collective bargaining coverage, while inequality tends to worsen in countries with decreasing union membership and coverage.[41] Hence, higher unionization in countries may be one step towards lessened inequality. However, research also stressed the need to address inequality with a multipronged approach, including taxation reform and curbing excesses associated with financial deregulation, and country-specific circumstances and potential trade-offs with other policy objectives out and above unionization need to be considered.[42]
- Living wage: A minimum living wage is often proposed as an important part of the challenge to reduce inequality.[43] A global minimum wage, based on a standard formula for a living wage, could lift millions of people out of poverty by providing all workers with the support they need for a decent quality of life.
See also[]
- Distribution of wealth
- Economic development
- Economic mobility
- Income disparity
- Income inequality metrics
- Income inequality in the United States
- International development
- List of countries by income equality
- Poverty
- United Nations Millennium Development Goals
- Wealth inequality in the United States
- Wealth inequality in Latin America
- Family planning in India
- Family Planning in the United States
- Global environmental inequality
References[]
- ^ Data from the United Nations is used.
- ^ Goesling, Brian; Baker, David P. (1 June 2008). "Three faces of international inequality". Research in Social Stratification and Mobility. 26 (2): 183–198. doi:10.1016/j.rssm.2007.11.001. ISSN 0276-5624.
- ^ Jump up to: a b "Goal 10 | Department of Economic and Social Affairs". sdgs.un.org. Retrieved 10 April 2021.
- ^ "Archived copy". Archived from the original on 8 June 2007. Retrieved 6 December 2005.CS1 maint: archived copy as title (link)
- ^ "Global Inequality".
- ^ [1]
- ^ https://www.tandfonline.com/doi/full/10.1080/14649880310001660201casa_token=aztvgLGO3d4AAAAA%3ARqfQGuWhGVVgB3hNYKF9uYT5rSaHHfPKHYbFnTQGfp8srmJPtW67IThrrE_DBC36vpMfQkBXiN9x}}
- ^ [2]
- ^ Payne, Richard (2017). Global Issues: Politics, Economics, and Culture. Pearson Education Inc. p. 116. ISBN 978-0-13-420205-1.
- ^ https://www.oakton.edu/user/4/ebottorf/pistor.pdf
- ^ Graph: Gapminder.org
- ^ "COVID-19 and Global Income Inequality". World Bank. Retrieved 10 April 2021.
- ^ Oxfam: Richest 1 percent sees share of global wealth jump
- ^ Rigged rules mean economic growth increasingly “winner takes all” for rich elites all over world. Oxfam. 20 January 2014.
- ^ Neuman, Scott (20 January 2014). Oxfam: World's Richest 1 Percent Control Half Of Global Wealth. NPR. Retrieved 25 January 2014.
- ^ Stout, David (20 January 2014). "One Stat to Destroy Your Faith in Humanity: The World's 85 Richest People Own as Much as the 3.5 Billion Poorest". Time. Retrieved 21 January 2014.
- ^ Wearden, Graeme (20 January 2014). "Oxfam: 85 richest people as wealthy as poorest half of the world". The Guardian. Retrieved 21 January 2014.
- ^ Kristof, Nicholas (22 July 2014). "An Idiot's Guide to Inequality". New York Times. Retrieved 22 July 2014.
- ^ Cohen, Patricia (19 January 2015). "Richest 1% Likely to Control Half of Global Wealth by 2016, Study Finds". New York Times. Retrieved 19 January 2015.
- ^ [3]
- ^ http://www.voxeu.org/index.php?q=node/4508
- ^ Payne, Richard (2017). Global Issues: Politics, Economics, and Culture. Pearson Education Inc. p. 124. ISBN 978-0-13-420205-1.
- ^ Branko Milanovic-Global Income Inequality by the Numbers-In History and Now-February 2013
- ^ [4]
- ^ "Global Inequality". Inequality.org.
- ^ The Gini coefficient corresponds to 85 %
- ^ http://www.spiegel.de: Report at 5 December 2006, www.orf.at: report at 5 Decembre 2006
- ^ http://www.spiegel.de: report from 6 March 2008
- ^ [5] www.intel.com – report at 2 January 2009
- ^ Spiegel.de – report at 23 August 2005
- ^ zeit.de report at 27 August 2008
- ^ Shaohua Chen, Martin Ravallion. The developing world is poorer than we thought, but no less successful in the fight against poverty. Policy Research Working Paper 4703, The World Bank Development Research Group, August 2008.
- ^ United Nations. The Millennium Development Goals Report. Statistical Annex 2009.
- ^ Milanovic, Branko and Yitzhaki, Shlomo, 2002. "Decomposing World Income Distribution: Does the World Have a Middle Class?", Review of Income and Wealth, Blackwell Publishing, vol. 48(2), pages 155–78, June 2002.
- ^ Glenn, John (2009). "Welfare Spending in an Era of Globalization: The North-South Divide". International Relations. 23 (1): 27–8, 30–1, 36–9, 45–6. doi:10.1177/0047117808100608. S2CID 145077740.
- ^ Deacon, Bob (March 2000). "Globalization and Social Policy: The Threat to Equitable Welfare". United Nations Research Institute for Social Development.
- ^ Payne, Richard (2017). Global Issues: Politics, Economics, Culture. Pearson Education Inc. p. 125. ISBN 978-0-13-420205-1.
- ^ Schuyler, Michael. "The Impact of Piketty's Wealth Tax on the Poor, the Rich, and the Middle Class" (PDF). Tax Foundation. 225: 17.
- ^ "Global Economic Inequality–and What Might Be Done About It". Norwich University Online. Retrieved 10 April 2021.
- ^ "Illicit Financial Flows from Developing Countries: 2003-2012 « Global Financial Integrity". 9 August 2017. Archived from the original on 9 August 2017. Retrieved 10 April 2021.
- ^ Herzer, Dierk (2014). "Unions and income inequality: A heterogeneous panel cointegration and causality analysis". Cite journal requires
|journal=(help) - ^ Jaumotte, Florence (2015). Inequality and labor market institutions. Carolina Osorio Buitron, International Monetary Fund. Research Department. [Washington, D.C]: International Monetary Fund, Research Department. ISBN 978-1-5135-2690-4. OCLC 914159875.
- ^ "Income Inequality: Time to Deliver an Adequate Living Wage". Social Protection and Human Rights. Retrieved 10 April 2021.
Sources[]
- Milanovic, Branko (World Bank), True world income distribution, 1988 and 1993: first calculation based on household surveys alone, The Economic Journal, Volume 112 Issue 476 Page 51 – January 2002. Article: [7]. Actual report on which the article is based: [8]. News coverage: [9] and [10].
- Cole, Matthew A. and Neumayer, Eric. The pitfalls of convergence analysis: is the income gap really widening? Applied Economics Letters, 2003, vol. 10, issue 6, pages 355–357 [11]
- Quah, Danny (1997). "Empirics for growth and distribution: stratification, polarization and convergence clubs", Journal of Economic Growth, March 1997, vol. 2, no. 1, pages 27–59.
- Martin Ravallion, "A poverty-inequality trade-off?", World Bank, 5 May 2005, Policy Research Working Paper no. WPS 3579,
- Martin Ravallion, "Looking beyond Averages in the Trade and Poverty Debate", World Bank, November 2004, Policy Research Working Paper No. 3461
- Barro, Robert (2000). "Inequality and Growth in a Panel of Countries" (PDF). Journal of Economic Growth. 7 (1). Archived from the original (PDF) on 16 December 2005..
- James B. Davies; Susanna Sandstrom; Anthony Shorrocks; Edward N. Wolff (2006). "The World Distribution of Household Wealth". World Institute for Development Economics Research of the United Nations University (UNU-WIDER). Retrieved 8 December 2006. News coverage: [12] [13]
External links[]
| Wikimedia Commons has media related to Global inequality. |
- World Distribution of Household Wealth report at United Nations University
- The UC Atlas of Global Inequality explores some aspects of inequality using online, downloadable maps and graphics.
- Poverty Facts and Stats is a well-documented source of comparisons.
- UN World Social Situation Report 2005 – Inequality Predicament
- Common Dreams – Globalization Driving Inequality, UN Warns
- Heritage Foundation – Economic Freedom and Per Capita Income
- Economic inequality
- Distribution of wealth
- Global inequality
- Economic globalization
- Imperialism studies