Iron ore mining in Western Australia
| Iron ore mining in Western Australia | |
|---|---|
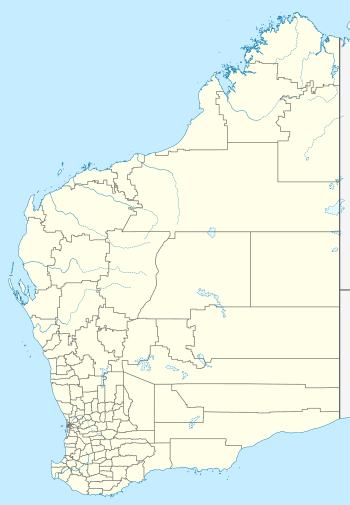
 Position of Western Australia within Australia highlighted | |
| Location | |
| State | Western Australia |
| Country | Australia |
| Regulatory authority | |
| Authority | Department of Mines, Industry Regulation and Safety |
| Website | Official website |
| Production | |
| Commodity | Iron ore |
| Production | |
| Value | |
| Employees | |
| Year | 2018–2019 |
Iron ore mining in Western Australia, in the 2018–19 financial year, accounted for 54 percent of the total value of the state's resource production, with a value of A$78.2 billion. The overall value of the minerals and petroleum industry in Western Australia was A$145 billion in 2018-19, a 26 percent increase on the previous financial year.[1][2]
Western Australia's iron ore output for 2018–19 was 794 million tonnes, a decrease of 5 percent on 2017–18. The bulk of Western Australian ore went to China, which imported 82% of 2018 production, followed by Japan with 7.5% and South Korea with 6%. The state has the world's largest reserves of iron ore with 29% of the world's iron ore, followed by Brazil with 19%, Russia with 15% and China with 12%.[1][3][2]
In 2018–19 the Western Australian Government received A$4.9 billion in royalties from the iron ore mining industry in the state.[1][4][2]
History[]
While the Pilbara iron ore deposits were known, such as the Mount Whaleback deposit discovered in 1957 by Stan Hilditch, it was not until 1960, when the Australian government lifted the embargo on iron ore exports that it had put in place because of concerns the mineral was in short supply, that mining began in earnest.[5] Up until the mid-1960s, iron ore production in Western Australia, and Australia as a whole, was negligible, in the range of less than 10 million tons a year. By the mid-1970s, this figure had reached 100 million tonnes, with the majority coming from Western Australia. Production slightly declined in the 1980s but it improved in the 1990s, reaching 150 million tonnes for the country by 1997 and 200 million tonnes by 2003.[6]
The first mine in the Pilbara, the Goldsworthy mine, was developed in 1965 by Mount Goldsworthy Mining Associates, a joint venture between the British-owned Consolidated Goldfields (Aust) Pty Ltd, Cyprus Mines Corporation of Los Angeles, and Utah Construction & Mining Company of San Francisco.[7] A private railway line, the Goldsworthy railway, as well as port facilities at Finucane Island, Port Hedland, were also constructed. On 1 June 1966, the first shipment of iron ore from the Pilbara left on board the Harvey S. Mudd.[8][9]
BHP's operations in Newman date back to 1968, when the Mount Whaleback mine was opened, the biggest single open-pit iron ore mine in the world. A new town, Mount Newman, was constructed, as well as a 426 kilometre railway line, the Mount Newman railway. The first train left Mount Newman on 1 January 1969 and the first shipment of Newman ore left port on 1 April 1969 on board of the Osumi Maru.[9] Newman remained a "closed" company town until 1981.[5]
Rio Tinto's iron ore operations in the Pilbara began in 1966,[10] with the Mount Tom Price mine opened that year, becoming the company's first mine to open in the Pilbara.[11]
Overview[]
Exploration[]

In 2008-09, expenditure for exploration in iron ore in Western Australia increased by 33 percent compared to the previous financial year, 2007-08. The A$560 million spend on iron ore exploration accounted for 45 percent of all mineral exploration expenditure in the state.[6]
Production[]

The bulk of iron ore production in Western Australia comes from the Pilbara region of the state. A number of mines however are also located in the Mid West and Kimberley regions as well as in the Wheatbelt.[6]
The big two producers, Rio Tinto and BHP accounted for 90 percent of all iron ore production in the state in 2008-09, with the third-biggest producer being the Fortescue Metals Group.[6]
Rio Tinto operates twelve iron ore mines in Western Australia, BHP seven, Fortescue two, all of those are located in the Pilbara region.[6]
Railways[]
Pilbara region[]
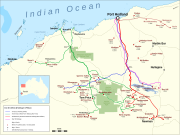
The three largest iron ore producers operate private rail networks to transport ore from their mines to ports on the coast.
BHP operates the Goldsworthy railway and the Mount Newman railway, both terminating at Port Hedland.
Rio Tinto operates the Hamersley & Robe River railway, formed in a 2001 merger of the Hamersley and Robe River railways. The two lines terminate at Cape Lambert and Dampier.
FMG's Fortescue railway, a relative newcomer, started operation in 2008. The line terminates at Port Hedland.[12] Before deciding to construct its own line, the National Competition Council of Australia received an application from FMG, on 15 June 2004, to use part of the Mount Newman railway and also part of the Goldsworthy railway.[13]
In June 2010, the Australian Competition Tribunal ruled that FMG would be granted access to Rio Tinto's Robe River line and BHP Billiton's Goldsworthy line but not to the busier Hamersley and Mount Newman lines.[14][15] Treasurer Wayne Swan suggested that several advantages would accrue from access to the rail lines by third parties. It would increase competition, reduce duplication of infrastructure, and reduce environmental damage.[16] Atlas Iron, another junior iron ore miner, is hopeful to come to terms with BHP Billiton in regards to using some of the company's rail infrastructure, the Goldsworthy railway, in the future. BHP, in late 2010, had agreed to a joint feasibility study into how an arrangement might work.[17]
Access to the rail networks by third parties is governed by the State Agreements Act.[18]
Westrail region[]
Other mines connect to port using the state government-owned railways. Examples are Windarling Range and Koolyanobbing - from Koolyanobbing to the port of Esperance; Koolanooka and Mungada using a 60km spur line linking to the state network at Morawa; and Mt Gibson trucking to an ore loading siding at Perenjori.[19][20]
Ports[]
In the Pilbara, iron ore is shipped from Port Hedland, Dampier and Cape Lambert. The latter two ports are exclusively used by Rio Tinto, while Port Hedland is used by BHP, FMG and Atlas Iron.
Port facilities at Port Hedland consist of Nelson Point and Finucane Island, both BHP, and Herb Elliott Port, used by FMG. In Dampier, ore is shipped from Parker Point and East Intercourse Island.
The non-Pilbara mines ship their ore out of other ports: Windarling Range ships from the port of Esperance;[19] the Jack Hills, Koolanooka, Mungada and Mt Gibson mines ship from Geraldton.[21][22]
Projects[]
BHP is currently spending A$1.85 billion on its Rapid Growth Project 4, aimed at increasing its annual iron ore output to 155 million tonnes. To achieve this, upgrades to both mines and port facilities are necessary. The project is scheduled for completion by 2010. As a follow-up, Rapid Growth Project 5, with a budget of A$4.8 billion, targets a further production increase of 50 million tonnes annually. Additionally to upgrades at the mines and ports, it will also include duplication of existing railway lines and is scheduled for completion in late 2011.[6] The Jimblebar mine is part of another expansion project, launched in 2010 and aimed at increasing production from the Pilbara mines to 240 million tonnes of iron ore annually by 2013. The expansion of Jimlebar, together with an expansion of the inner harbour at Port Hedland and works on the duplication of rail tracks is estimated to cost A$2.15billion.[23] The project is titled Rapid Growth Project 6.[24]
Rio Tinto declared its intent to expand the Hope Downs mine, spending a further A$1.78 billion on its new Hope Downs 4 project, scheduled to produce 15 million tonnes of iron ore annually by 2013.[25][26] Rio has commenced construction on its new Western Turner Syncline project. Rio Tinto allocated a further A$1.24 billion in early December 2010, to expand the Brockman 4 mine to 40 million tonnes per annum, from 22, as well as develop its Western Turner Syncline project, raising planned production there from 6 to 15 million tonnes, with the aim of increasing the Pilbara production to 283 million tonnes per annum by late 2013. The expansion would make Brockman 4 Rio Tinto's second-largest mine in the Pilbara.[27] The company has also begun further construction at the port at Cape Lambert, which is scheduled to undergo a further expansion, to be completed by 2012. The new expansion is scheduled to cost A$276million.[28] The expansion is part of a plan to raise Rio's annual production from the Pilbara from 220 to 330 million tonnes annually by 2016. To achieve this, the Cape Lambert port capacity will be expanded to handle an additional 100 million tonnes annually.[29]
Plans by the Fortescue Metals Group to increase production from 39 million tonnes to 55 million tonnes through a US$220 million upgrade of the Cloud Break mine had to be abandoned in October 2009 because of funding difficulties through its Chinese investors. Instead, Fortescue decided to develop its Christmas Creek mine, at a cost of US$360 million, by building a mine and process plant there and linking it to its existing rail network. Christmas Creek is scheduled to produce 16 million tonnes of iron ore in its first year of operation. Fortescue plans to reach an annual production of 95 million tonnes of iron ore by 2012, downgraded from an earlier target of 120 million.[30]
At Cape Preston, CITIC Pacific Mining is currently, as of 2010, in the process of constructing a 27.6 million tonnes per annum magnetite iron ore mine, named the Sino Iron Project.[31]
Export[]
China, in 2008-09, was the main importer of Western Australian iron ore, having taken 64 percent, or A$21 billion in value. Japan was the second-most important market with 21 percent, followed by South Korea with 10 percent and Taiwan with 3. In comparison, Europe is a small market for ore from the state, having taken only one percent of the overall production in 2008-09.[6]
Criticism[]
The iron ore mining boom in Western Australia experienced since the early 2000s has not exclusively been seen as positive. Communities in the Pilbara region have seen a large influx of residential and Fly-in fly-out workers which has seen land prices skyrocket and has negatively affected tourism as accommodation has become sparse.[32][33]
Australian Aboriginals[]
Australian Aboriginal culture in the region is deeply connected to the land and water and the mining activities threaten the fragile desert environment of the Pilbara. Locals in the Pilbara argue that the wealth generated by the local mining industry is passing them by and they are left behind. A lack of accommodation and the unattractive nature of relocating to the "dusty outback" resulted in a majority work force of fly-in fly-out workers, depriving local towns of the benefits of a high-earning permanent population.[33]
Mining companies in Australia have, since 1992, changed their attitude towards the local Aboriginal population. In 1992, the Australian government began to recognise the land rights of the Indigenous Australians, opening an opportunity for the latter to engage in negotiations with mining companies to press for compensation and for assistance in preserving cultural artifacts. However, some Aboriginals feel short-changed, given the enormous profits made from mining, and also consider the financial benefits and employment opportunities as insufficient compensation for the destruction caused to their habitat.[33]
Aboriginal mining companies have been able to secure contracts with the big international mining companies. In 2007, BHP Billiton awarded a A$300 million contract to Ngarda Civil and Mining, an Aboriginal-owned company, to manage the Yarrie mine, the largest ever mining contract awarded to an Aboriginal company.[34][35] As part of the five-year contract, BHP Billiton planned to increase the number of Aboriginal workers at the mine to 70, out of a total of 90 workers. The managing director of Ngarda, Brian Taylor, saw this contract as a positive step, moving Aboriginal people in the region away from government welfare and into permanent employment. Western Australian Aboriginals, in 2007, suffered from an unemployment rate of 14 percent in the state, compared to 3.3% for the general population.[36] Of the 12,000 people employed by BHP Billiton in its Pilbara operations in 2010, 700 were indigenous. Rio Tinto also, as of 2010, employs 700 indigenous workers in its Pilbara operations, comprising 6 percent of its overall work force. FMG, under the leadership of Andrew Forrest, is driving a national program which aims to find 50,000 jobs for indigenous workers in Australia.[35] Companies like BHP, FMG and Rio Tinto have programs aimed at increasing the number of Aboriginal employees in their operations.[33] Indigenous Australians in Western Australia in 2001 accounted for 3.1% of the population.
Companies however lack an understanding of Aboriginal culture, which requires young men to be sent to the bush for up to six weeks to hunt and learn about their culture. Companies are often unwilling to award their indigenous employees this time off to be able to perform these important traditions.[35]
Safety[]
Since the late 1960s, when the Department of Mines began categorising fatalities by commodity, until 2010, 86 work-related fatalities have occurred in the iron ore mining industry in Western Australia.[37]
List of active mines[]
This section needs expansion. You can help by . (January 2019) |
This is a list of currently active iron ore mines in Western Australia:[6]
| Mine | Owner 1 | Location 2 | Region | Capacity 3 | Opening year |
|---|---|---|---|---|---|
| Atlas Iron | Port Hedland | Pilbara | 4.3 | 2013 | |
| Area C mine | BHP | Newman | Pilbara | 55 | 2003 |
| Brockman mine | Rio Tinto | Tom Price | Pilbara | 8.7 | 1992 |
| Brockman 4 mine | Rio Tinto | Tom Price | Pilbara | 22 | 2010 |
| Channar mine | Rio Tinto (60%), Sinosteel (40%) | Paraburdoo | Pilbara | 20 | 1990 |
| Christmas Creek mine | FMG | Nullagine | Pilbara | 16 | 2009 |
| Cloud Break mine | FMG | Nullagine | Pilbara | 28 | 2008 |
| Eastern Range mine | Rio Tinto | Paraburdoo | Pilbara | 20 | 2004 |
| Hope Downs mine | Rio Tinto | Newman | Pilbara | 30 | 2007 |
| Rio Tinto | Newman | Pilbara | 15 | 2014 | |
| Iron Valley mine | Mineral Resources | Newman | Pilbara | 7 | 2014 |
| Jimblebar mine | BHP | Newman | Pilbara | 14 | 1989 |
| Koolan Island mine | Mount Gibson Iron | Koolan Island | Kimberley | 0.4 | 2007 |
| Marandoo mine | Rio Tinto | Tom Price | Pilbara | 15 | 1994 |
| Mesa A mine | Rio Tinto | Pannawonica | Pilbara | 25 | 2010 |
| Mesa J mine | Rio Tinto | Pannawonica | Pilbara | 7 | 1994 |
| Mount Gibson | Mount Gibson Iron | Mount Gibson | Mid West | 2.8 | 2011 |
| Atlas Iron | Port Hedland | Pilbara | 9 | 2014 | |
| Mount Tom Price mine | Rio Tinto | Tom Price | Pilbara | 28 | 1966 |
| Mount Whaleback mine | BHP | Newman | Pilbara | 38 | 1968 |
| Nammuldi mine | Rio Tinto | Tom Price | Pilbara | 6.6 | 2006 |
| Orebodies 18, 23 and 25 mine | BHP | Newman | Pilbara | ||
| Pardoo mine | Atlas Iron | Port Hedland | Pilbara | 2.4 | 2008 |
| Paraburdoo mine | Rio Tinto | Paraburdoo | Pilbara | 20 | 1972 |
| West Angelas mine | Rio Tinto | Newman | Pilbara | 29.5 | 2002 |
| Windarling Range | Mineral Resources | Mount Jackson | Wheatbelt | 11.5 | 2004 |
| Wodgina mine | Atlas Iron | Port Hedland | Pilbara | 4 | 2010 |
| Yandi mine | BHP | Newman | Pilbara | 41 | 1992 |
| Yandicoogina mine | Rio Tinto | Newman | Pilbara | 52 | 1998 |
- 1 Majority-owner and operator shown only.
- 2 Location refers to nearest town, mines are not necessarily located at this town.
- 3 Capacity is the production capacity of the mine, as of 2010, not actual annual production, and is in million tonnes of iron ore per annum.
List of inactive and exhausted mines[]
This section needs expansion. You can help by . (November 2010) |
This is a list of former iron ore mines in Western Australia:
| Mine | Owner | Location | Region | Opening year | Closing year |
|---|---|---|---|---|---|
| Cockatoo Island mine | Pluton Resources | Cockatoo Island | Kimberley | 1995 (1951-1986) | 2015 |
| Goldsworthy mine | Mount Goldsworthy Mining Associates | Goldsworthy | Pilbara | 1966 | 1982 |
| Jack Hills mine | Mitsubishi Corporation | Jack Hills | Mid West | 2006 | 2012 |
| Sinosteel Midwest | Morawa | Mid West | 2010 (1965-1974) | 2013 | |
| Koolyanobbing mine | Cliffs Natural Resources | Southern Cross | Wheatbelt | 1994 (1950-1983) | 2013 |
| BHP Biliton | Goldsworthy | Pilbara | 1988 | 2007 | |
| Shay Gap mine | Mount Goldsworthy Mining Associates | Shay Gap | Pilbara | 1973 | 1993 |
| Mount Gibson Iron | Mullewa | Mid West | 2004 | 2014 | |
| Wundowie mine | Charcoal Iron & Steel Industry (WA Government) | Wundowie | Wheatbelt | 1948 | 1951 |
| Yarrie mine | BHP | Yarrie | Pilbara | 1993 | 2014 |
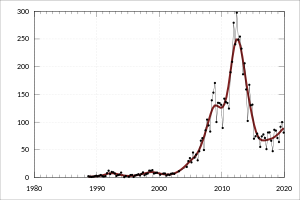
Statistics[]

Annual statistics for the Western Australian iron ore mining industry:[38][39][40][41][42][43][44][45][46][47][48][49][50]
| Subject | 1999 | 2000 | 2001 | 2002 | 2003 | 2004 | 2005 | 2006 | 2007 | 2008 | 2009 | 2010 | 2011 | 2012 | 2013 | 2014 | 2015 | 2016 | 2017 | 2018 | 2019 |
| Production (million tonnes) |
143.0 | 158.9 | 166.0 | 171.8 | 194.6 | 213.5 | 240.5 | 250.3 | 264.4 | 305.9 | 356.1 | 393.9 | 426.7 | 478.3 | 554.9 | 686.2 | 742.4 | 769.3 | 790 | 826 | 794 |
| Production value (A$ billion) |
3.52 | 4.36 | 5.37 | 5.06 | 5.06 | 6.19 | 11.3 | 14.8 | 16.1 | 31.9 | 28.1 | 50.3 | 62.9 | 52.8 | 70.4 | 65.0 | 49.6 | 55.2 | 62.9 | 61.7 | 78.2 |
| WA Royalty Receipts (A$ million) |
232 | 285 | 272 | 290 | 330 | 534 | 774 | 830 | 1,518 | 1,701 | 2,394 | 3,785 | 3,535 | 4,344 | 5,226 | 5,448 | 4,026 | 3,600 | 4,708 | 4,476 | 4,884 |
| Employees | 8,604 | 9,103 | 9,289 | 11,184 | 12,585 | 13,727 | 16,203 | 18,387 | 23,185 | 26,051 | 27,537 | 33,345 | 43,008 | 55,323 | 60,844 | 58,257 | 58,093 | 53,229 | 53,221 | 53,716 | 59,525 |
References[]
- ^ Jump up to: a b c "Western Australian Mineral and Petroleum Statistics Digest 2017–18" (PDF). East Perth, WA: Government of Western Australia Department of Mines, Industry Regulation and Safety. 2018. Retrieved 12 June 2019.
- ^ Jump up to: a b c "Western Australian Mineral and Petroleum Statistics Digest 2018–19" (pdf). Department of Mines and Petroleum. East Perth, WA: Government of Western Australia. 2019. Retrieved 1 April 2020.
- ^ Tuck, Christopher A. (28 February 2019). "Mineral Commodity Summaries 2019" (pdf). Reston, Virginia: U.S. Geological Survey. pp. 88–89.
- ^ "Western Australia Iron Ore Profile" (PDF). Perth, WA: Government of Western Australia Department of Jobs, Tourism, Science and Innovation. June 2018. Retrieved 12 June 2019.
- ^ Jump up to: a b Newman The Sydney Morning Herald, published: 8 February 2004, accessed: 10 November 2010
- ^ Jump up to: a b c d e f g h Western Australian Mineral and Petroleum Statistic Digest 2008-09 Department of Mines and Petroleum website, accessed: 26 November 2010
- ^ "Iron Ore (Mount Goldsworthy) Agreement Act 1964". Western Australian Legislation. Parliamentary Counsel’s Office, Government of Western Australia. 1964. Retrieved 5 April 2019.
- ^ "Utah Development profit reflects Japanese price rise". Sydney Morning Herald. 11 December 1973. p. 20. Retrieved 1 October 2012.
- ^ Jump up to: a b History of the Iron Ore Industry and the Pilbara BHP Billiton website, accessed: 10 November 2010
- ^ Pilbara Archived 21 October 2013 at the Wayback Machine Rio Tinto Iron Ore website, accessed: 6 November 2010
- ^ The Australian Mines Handbook - 2003-04 edition, editor: Ross Louthean, publisher: Louthean Media Pty Ltd, page: 242
- ^ Infrastructure: Rail Archived 23 November 2010 at the Wayback Machine Fortescue website, accessed: 6 November 2010
- ^ Mt Newman Railway National Competition Council of Australia website, accessed: 6 November 2010
- ^ Junior miners win limited access to Pilbara rail network Archived 14 March 2012 at the Wayback Machine lloydslistdcn.com.au, published: 1 July 2010, accessed: 4 November 2010
- ^ Watchdog 'can demand Pilbara rail expansion' The Australian, published: 13 May 2010, accessed: 4 November 2010
- ^ BHP Billiton, Rio Tinto angry on open Pilbara rail line news.com.au, published: 28 October 2008, accessed: 4 November 2010
- ^ Atlas Iron optimistic about using BHP rail line to Port Hedland ABC Rural, published: 23 November 2010, accessed: 24 November 2010
- ^ Report on Current Transport and Communications Infrastructure in the Pilbara Murdoch University, accessed: 4 November 2010
- ^ Jump up to: a b "Yilgarn Operations - 2013 Triennial Performance Review" (pdf). Cliffs Natural Resources. Cleveland, OH. 2013. p. 3. Retrieved 25 November 2015.
- ^ "Koolanooka 1961 to Today" (PDF). Shire of Morawa. Retrieved 7 April 2020.
- ^ Koolanooka/Blue Hills (Haematite) Archived 17 October 2010 at the Wayback Machine Sinosteel Midwest website, accessed: 28 November 2010
- ^ Jack Hills Iron Ore Mine Archived 21 February 2011 at the Wayback Machine Crosslands resources website, accessed: 28 November 2010
- ^ BHP approves a $2bn expansion of WA iron ore operations The Australian, published: 29 January 2010, accessed: 14 November 2010
- ^ BHP boosts Pilbara despite EU threat to Rio joint venture The Australian, published: 30 January 2010, accessed: 14 November 2010
- ^ Rio Tinto to invest $1.78b in Hope Downs The Sydney Morning Herald, published: 30 August 2010, accessed: 7 November 2010
- ^ Rio Tinto proceeds with Hope Downs iron project ABC Rural, published: 31 August 2010, accessed: 7 November 2010
- ^ Rio Tinto signals $1.24bn ore expansion The Australian, published: 2 December 2010, accessed: 4 December 2010
- ^ John Holland lands Cape Lambert port expansion for Rio The Herald Sun, published: 3 September 2010, accessed: 8 November 2010
- ^ Rio announces $226m expansion at Cape Lambert The West Australian, published: 14 July 2010, accessed: 8 November 2010
- ^ Fortescue Metals Group's China funding flops The Australian, published: 13 October 2010, accessed: 9 November 2010
- ^ Sino Iron Project CITIC Pacific Mining, accessed: 28 November 2010
- ^ New Australia Mining Boom Taking Toll on Outback Life - Page 1 National Geographic, published: 26 September 2007, accessed: 6 December 2010
- ^ Jump up to: a b c d New Australia Mining Boom Taking Toll on Outback Life - Page 2 National Geographic, published: 26 September 2007, accessed: 6 December 2010
- ^ Fact Sheet: Yarrie Mine Operations Ngarda Civil and Mining website, accessed: 6 December 2010
- ^ Jump up to: a b c Looking for opportunities ABC North West WA, published: 16 February 2010, accessed: 6 December 2010
- ^ Indigenous firm wins $300m BHP deal The Australian, published: 5 September 2007, accessed: 6 December 2010
- ^ Western Australian mining fatalities database Archived 25 February 2011 at the Wayback Machine accessed: 19 February 2011
- ^ 2017 Economic indicators resources data Department of Mines, Industry Regulation and Safety, accessed: 30 May 2018
- ^ Annual Report 2016-17 Department of Mines and Petroleum, accessed: 30 May 2018
- ^ Annual Report 2014-15 Department of Mines and Petroleum, accessed: 30 May 2018
- ^ Western Australian Mineral and Petroleum Statistics Digest 2014 Department of Mines and Petroleum, accessed: 2 December 2016
- ^ Western Australian Mineral and Petroleum Statistics Digest 2013 Department of Mines and Petroleum, accessed: 2 December 2016
- ^ Western Australian Mineral and Petroleum Statistics Digest 2012 Department of Mines and Petroleum, accessed: 2 December 2016
- ^ Western Australian Mineral and Petroleum Statistics Digest 2011 Department of Mines and Petroleum, accessed: 2 December 2016
- ^ Western Australian Mineral and Petroleum Statistics Digest 2010 Department of Mines and Petroleum, accessed: 20 August 2012
- ^ Western Australian Mineral and Petroleum Statistics Digest 2008 Department of Mines and Petroleum, accessed: 9 December 2010
- ^ Western Australian Mineral and Petroleum Statistics Digest 2006 Department of Mines and Petroleum, accessed: 9 December 2010
- ^ Western Australian Mineral and Petroleum Statistics Digest 2004 Department of Mines and Petroleum, accessed: 9 December 2010
- ^ Western Australian Mineral and Petroleum Statistics Digest 2002 Department of Mines and Petroleum, accessed: 10 December 2010
- ^ Western Australian Mineral and Petroleum Statistics Digest 2001 Department of Mines and Petroleum, accessed: 10 December 2010
External links[]
- Department of Mines, Industry Regulation and Safety website
- MINEDEX website Database of the Department of Mines, Industry Regulation and Safety
- Iron ore mining in Western Australia
- Economy of Western Australia
- Iron mining in Australia