List of Major League Baseball records considered unbreakable

Some Major League Baseball (MLB) records may be regarded as "unbreakable" due to having been initially set by either freak occurrences or during the early decades of baseball when certain rules, techniques, and fundamentals were in place that have since drastically evolved, making it almost impossible to replicate such feats in today's game. Others are due to changes in the game over time, shifts of focus one way or another over a generation or decades in some cases and much shorter spans in others, which make it seem unlikely the marks will be broken when viewed through today's lenses. Outliers, however, can appear at any time, accounting for some records previously regarded as unbreakable being broken and, in some cases, re-broken.
Pitching[]

Most career wins – 511[]
Set by Cy Young, 1890–1911.[2][3][4] Highlights include five 30-win seasons and fifteen 20-win seasons.[5] The next closest player is Walter Johnson with 417; he is the only other player to have reached 400.[6] The most wins by a pitcher who played his entire career in the post-1920 live-ball era is Warren Spahn's 363.
For a player to accomplish this, he would have to average 25 wins in 20 seasons just to get to 500. Since 1978, only 3 pitchers (Ron Guidry in 1978, Bob Welch in 1990, and Steve Stone in 1980[7]) have had one season with 25 wins.[8] Between 2000 and 2009, the Major League leader finished each year with an average of 21. Only two players active in the 2021 season have even 200 wins, both of whom were born in 1983—Justin Verlander, who is not playing that season while recovering from Tommy John surgery, with 226 and Zack Greinke with 208.[9]
Most wins in a season – 59[]
Set by Charles Radbourn, in 1884,[10] with Jack Chesbro's 41 in 1904 historically regarded as the modern mark. In today's game of five-man rotations, pitchers do not start enough games to break the record. The most games started by a pitcher in the 2019 season was 34, accomplished by seven pitchers, and only three pitchers in the 21st century have started more than 35 games in a season (Tom Glavine in 2002 and Roy Halladay and Greg Maddux in 2003, each with 36 starts).[11] Although relief pitchers often appear in more than the requisite number of games, they rarely record ten wins in a season. However, the use of relief pitchers increases a starter's chance of a no decision, further limiting the ability to break the record. To put this record in further perspective, the last pitcher to win 30 games in a season was Denny McLain in 1968 and the last pitcher to win 25 games in a season was Bob Welch in 1990. Also, the most wins in a season by any pitcher in the 21st century is 24, by Randy Johnson in 2002 and Justin Verlander in 2011.[12]
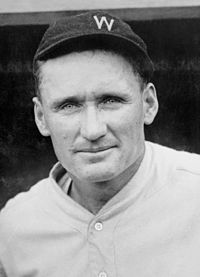
Most career complete games – 749[]
Set by Cy Young, 1890–1911.[3] Highlights of this record include: nine 40-complete-game seasons, eighteen 30-complete-game seasons[5] and completing 92 percent of his total career starts (an all-time record of 815).[3] The next closest player is Pud Galvin, who has 103 fewer complete games at 646. Among pitchers whose entire careers were in the live-ball era, the most is 382 by Warren Spahn.
For a player to accomplish this, he would have to average 30 complete games over 25 seasons to get to 750. Between 2000 and 2009, the Major League leaders in complete games averaged eight per season, and only two pitchers in the 21st century have had 10 complete games in any season (CC Sabathia with 10 in 2008 and James Shields with 11 in 2011).[13] In addition, only two pitchers other than Young have even started as many as 749 games—Nolan Ryan (773) and Don Sutton (756).[14] Among pitchers active in the 2021 season, Justin Verlander (as noted above, not playing in 2021) has the most complete games with 26, and only three others have more than 20.[15]
The quest for any complete-game records, either over a career or over a single season, is further complicated by the drastic change in philosophy embraced by virtually all modern managers and pitching coaches, motivated in roughly equal parts by more advanced modern-day medical knowledge of the cumulative damage that pitching does to a hurler's arm, combined with a team front office's reluctance to see a pitcher in whom they have invested considerable financial capital in the form of a big contract getting hurt. Another factor, arguably, is the greater reliance of managers and pitching coaches on sabermetrics—in this case, statistical data and analysis that generally show leaving a starter in longer leads to diminishing returns in terms of opposing batters allowed to reach base safely and score runs.[16] While even a few decades ago, a starting pitcher was expected to go out and attempt to pitch a complete game, with the manager going to his bullpen only if the starter ran into trouble or was injured or visibly tiring, the present-day norm is the starter is expected to give his manager six, or perhaps seven "quality innings," at which point the manager—who, along with the pitching coach, has been tracking the starter's pitch count—will normally lift him and bring in one or more middle-relief specialists to pitch the next several innings and form a bridge to the team's closer.[17] There are exceptions—a manager will leave a starter in who is working on a no-hitter or, sometimes, a shutout, or will let a starter continue if he is pitching particularly strongly and has not run up a high pitch count. But managerial caution is now a more dominant mode, particularly if a pitcher is coming off a recent injury or has had Tommy John surgery or any other major procedure done on his pitching arm.
These changes in philosophy have reduced the number of complete games in today's game to an even greater extent than in the first decade of the 21st century. Since Shields amassed 11 complete games in 2011, no pitcher has had more than 6 complete games in a season. In 2018, all of Major League Baseball combined for 42 complete games, with no pitcher having more than 2. The 2019 season was similar in both respects, with 45 total complete games and no pitcher having more than 3.[18]
In a 2019 story, Sam Miller of ESPN went so far as to say, "In your lifetime, you might very well see the last complete game."[19] Miller's column was written prior to the introduction of seven inning games for doubleheaders starting in the COVID-19 pandemic-shortened 2020 season. As previously mentioned, pitching seven innings in a game is still relatively common. In the first game of any doubleheader a manager must consider the effect using his relievers and/or closer could have on the second game, and therefore tend to be less inclined to go to the bullpen. Over time, this will likely prove to be even more common in the first seven inning games of a doubleheaders where one team has a sizable lead, thus modestly increasing the opportunity for pitchers to earn complete games.[a] However, while this change may help ensure that complete games do not completely disappear, they will not affect the game to anything close to the extent that would make any complete game records challengeable.
Most complete games in a season – 75[]
All-time record of 75 set by Will White in 1879; modern-era record of 48 set by Jack Chesbro in 1904. Sports Illustrated has said about this record, "Even if the bar is lowered to begin with the live-ball era (which began in 1920), the mark would still be untouchable." The most complete games recorded in a live-ball season is 33, achieved three times in all—twice at the dawn of that era by Grover Cleveland Alexander in 1920 and Burleigh Grimes in 1923, and also by Dizzy Trout in 1944, a season in which the player pool was severely depleted by military call-ups during World War II. Modern starters can expect to start about 34 games in a season while fully healthy.[13]
Most consecutive complete games in a season (since 1900) – 39; Most consecutive games without being relieved – 202[]
Both records were set by Jack Taylor, who pitched 202 consecutive games without being relieved from June 20, 1901, through August 13, 1906. The streak includes a total of 187 career starts (all complete games) and 15 relief appearances. The streak of 39 consecutive complete games (uninterrupted by a relief appearance) is a subset of the longer streak, lasting from April 15 through October 6, 1904.
Most career shutouts – 110[]
Set by Walter Johnson, 1907–27.[20] Highlights include: eleven 6-shutout seasons and leading the league in shutouts 7 times.[21] The next closest player is Grover Cleveland Alexander, who has 90. As is the case for career wins and complete games, Warren Spahn, who retired in 1965, holds the record among pitchers whose entire careers were in the live-ball era, with 63.
For a player to tie Johnson's record, he would have to pitch 5 shutouts every season for 22 years.[20] Between 2010 and 2019, the Major League leader in shutouts finished each year with an average of 3, and no pitcher has recorded more than 2 shutouts in a season since 2017. Also, adding the MLB-leading shutout totals for each season from 1992 through 2019 results in a total of 106, still short of Johnson's record.[22] The closest active player is Clayton Kershaw with 15.[23]
Most shutouts in a season – 16[]
Set first by George Bradley in 1876 and equaled by Grover Cleveland Alexander in 1916; live-ball era record of 13 set by Bob Gibson in 1968.[24]
The aforementioned Sam Miller had this to say about a rhetorical suggestion that the live-ball record of 13 could be broken: "This is the stupidest suggestion yet. Thirteen shutouts clearly belongs in the anachronism pile." He pointed out that neither the National nor American League had 13 combined shutouts in the 2018 season, and no pitcher had more than one in that season.[25]
Most consecutive no-hitters – 2[]
Set by Johnny Vander Meer on June 11 and 15, 1938.[1] Despite holding this record, he finished his career with a 119–121 win–loss record.[1] The prospect of a pitcher breaking this record by hurling three no-hitters in a row is so unimaginable that LIFE argued "it's easier to imagine someone hitting in 57 straight games or bashing 74 home runs in a season or ending the season with a 1.11 ERA."[1] Ewell Blackwell came the closest to matching Vander Meer after following up a no-hitter with eight no-hit innings in 1947.[26] In 1988, Dave Stieb of the Toronto Blue Jays had consecutive no-hitters going with two outs in the ninth; both were broken up by singles.[27] Between 2010 and 2019, 35 no-hitters were pitched (not including five combined no-hitters involving multiple pitchers), and the closest anyone came in the 21st century is Max Scherzer, who in 2015 threw a one-hitter and no-hitter in consecutive starts, respectively losing out on perfect games in the seventh inning and on the 27th batter.[28][29][30]

Most career no-hitters – 7[]
Set by Nolan Ryan, 1966–93. Sandy Koufax is second with four.[3] Larry Corcoran, Cy Young, Bob Feller, and Justin Verlander have all thrown three. Only Verlander is active.
In all, 26 pitchers have thrown two, including active players Homer Bailey, Max Scherzer, Mike Fiers, and Jake Arrieta. An additional 30 active pitchers have played a part in one, including 20 who have thrown an individual no-hitter.[29] Between 2000 and 2009, 20 no-hitters in all were thrown—19 of them solo no-hitters and one a combined no-hitter (in which more than one pitcher contributed). The following decade (2010–2019) saw the number of no-hitters double from the 2000s, with 40 (36 solo, 4 combined).[29]
Most career strikeouts – 5,714[]
Set by Nolan Ryan, 1966–93.[32] Highlights include: six 300-strikeout seasons, fifteen 200-strikeout seasons, and leading the league in strikeouts 11 times.[33] To accomplish this record, Ryan played the most seasons (27) in MLB history,[31] as well as being both second in career innings pitched in the live-ball era, and fourth among pitchers who have completed their careers in strikeouts per nine innings.
The next closest player is Randy Johnson, who has 839 fewer strikeouts at 4,875.[34] Johnson also had four consecutive 300-strikeout seasons at the turn of the 21st century (1999–2002);[3] the only pitchers with a 300-strikeout season after 2002 are Clayton Kershaw, who had 301 in 2015; Chris Sale, with 308 in 2017; Max Scherzer, with 300 in 2018; and Gerrit Cole and Justin Verlander, respectively with 326 and 300 in 2019.[35] For a player to approach this record, he would have to average 225 strikeouts over 25 seasons just to get to 5,625. Averaging 250 strikeouts over 23 seasons would enable him to surpass the record with 5,750. Between 2010 and 2019 the Major League leader in strikeouts finished each year with an average of 279, and even that average is skewed with the aforementioned large strikeout seasons late in the decade. No pitcher exceeded 280 strikeouts between 2005 and 2014. Since then, only seven 280-strikeout seasons have been recorded—the five aforementioned 300-strikeout performances, plus Scherzer's 284 in 2016 and Verlander's 290 in 2018.[35] With CC Sabathia having retired at the end of the 2019 season with 3,093 strikeouts, the closest active player is now Verlander (not playing while recovering from Tommy John surgery), with 3,013 strikeouts.[36]
Most career bases on balls – 2,795[]
Set by Nolan Ryan, 1966–93. Ryan has more than 50 percent more bases on balls than the next highest (Steve Carlton with 1833).[32] No pitcher active in the 2021 season has issued even 900 career walks; the active leader, Justin Verlander, ended the 2020 season with 851.[37]
Most innings pitched in a season – 680[]
Set by Will White in the same 1879 season in which he set the record of 75 complete games noted above (at this time the distance from mound to plate was 45 feet). The record pitching from the distance used since 1893 (60 feet 6 inches) is 482 innings that first year by Amos Rusie, which had been exceeded 85 times by pitchers working from 45 or (starting in 1881) 50 feet, including by Rusie himself the three previous consecutive seasons, but has never been approached since (Ed Walsh in 1908 was the last to pitch 400 innings in a season). The most innings pitched in a live-ball season (since 1920) was Wilbur Wood's 3762⁄3 innings in 1972.[38]
No pitcher has even thrown half of White's record total for innings in a season since Phil Niekro in 1979, with 342. The last 300-inning season to date was by Steve Carlton the following year, with 304. The highest single-season innings count in the 21st century was Roy Halladay's 266 in 2003, and the three most recent full seasons of 2017, 2018, and 2019 saw the three lowest innings totals for an MLB leader in the sport's history (apart from three shortened seasons—1981 and 1994 due to strikes, and 2020 due to COVID-19)—Chris Sale with 2141⁄3 in 2017, Max Scherzer with 2202⁄3 in 2018, and Justin Verlander with 223 in 2019.[38]
Most career wild pitches thrown – 343[]
Set by Tony Mullane, who pitched from 1881 to 1894. Mullane pitched through a staggering 4531.1 innings (24th all-time) throwing a total of 343 wild pitches and averaged an errant pitch in 7.56% of those innings. Nolan Ryan is second on the list of most wild pitches with 277. The active leader in wild pitches is Félix Hernández with 156, less than half of Mullane's total.[39] With modern pitchers throwing fewer innings as well as wild pitches, this record is safely unbreakable.
Batting[]
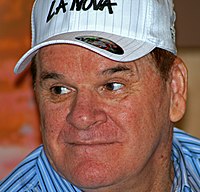
Most career MLB hits – 4,256[]
Set by Pete Rose, 1963–86.[40] No active major league player is at this time considered to be close to breaking Rose's mark. The only active player with 3,000 hits is the 40-year-old Albert Pujols (3,295).[41] To get within 6 hits of tying Rose, a player would have to collect 250 hits for 17 straight seasons,[42] or more than 200 hits over the course of 21 seasons. In the past 81 years, only Ichiro Suzuki, whose first season in Major League Baseball was his tenth in the top professional ranks, following nine years in his native Japan, has topped 250 hits in a season (with 262 hits in 2004).[42] Ichiro ended his playing career with 3,089 MLB hits[41] and 1,278 hits in the Japanese major leagues[43] (averaging just 106 games and 142 hits a year in much shorter Japanese seasons) for a combined, unofficial total of 4,367, 111 more than Rose's record; however, Ichiro's hits from Japan's major leagues are not counted toward his MLB total. At the end of the 2020 season, Miguel Cabrera (38 years old) had 2,866 hits after 18 seasons; he would have to average 199 hits over 7 additional seasons to break the record. No player younger than Cabrera was within 200 hits of his career total at the end of the 2020 season, and among players no older than 30 at that time, only Starlin Castro and José Altuve, both born in 1990, had even 1,600 career hits (1,633 and 1,610 respectively). The only player under 30 with even 1,300 hits was Mike Trout (1,380 at age 28).[41]
Most hits in a season – 262[]

Set by Ichiro Suzuki in 2004, breaking a record that had been set in 1920 by George Sisler (257),[44] this record is only fifteen seasons old and thus its longterm durability is debatable. Changes to the game and how it is broadly approached have an effect on any record's longevity. Writing shortly before Ichiro retired, the aforementioned Miller noted that the only active player who had collected more than 225 hits in any season was Ichiro himself,[25] who exceeded that total three times in all.[44] The next highest total since 2000 was 240 hits, batted by Darin Erstad in the 2000 season.
Miller added that in today's game, "few elite hitters are as walk-averse as Ichiro was permitted to be", which he argued was a necessity for a player to be able to approach the record. The MLB leader in at-bats in 2018 was Trea Turner with 664; a player with that number of at-bats would have to hit .396 to reach 263 hits—a batting average that Miller himself had argued in 2018 was unapproachable in the modern game.[45] He added,[25]
The outer limit for at-bats – say, a leadoff hitter for a high-scoring team who plays every game and has a 10th-percentile walk rate – is perhaps 725, nine higher than the all-time record. And even the 725-AB guy would need to hit .363, a mark not met by any hitter in this decade.
Most consecutive seasons with 200 hits – 10[]
Set by Ichiro Suzuki, who attained this from 2001 to 2010.[46][47][48] The closest player is Willie Keeler who had 8 consecutive seasons with 200 hits that occurred almost a century prior in the dead-ball era.[49] The 2018 season was the first since 2013 in which no player reached the 200-hit mark; only Whit Merrifield and Rafael Devers reached that mark in 2019, and it was effectively impossible for any player to reach that mark in 2020, with the regular season shortened to 60 games due to COVID-19.[50]
Most career triples – 309[]
Set by Sam Crawford, 1899–1916. Highlights include: five 20-triple seasons and sixteen 10-triple seasons.[51] The next closest player is Ty Cobb, who has 14 fewer triples at 295. Because of changes in playing styles and ballparks that began around 1920 and have continued into the present from the dead-ball era to the live-ball era, the number of triples hit has declined noticeably since then. Among hitters whose entire careers were in the live-ball era, the leader in career triples is Stan Musial, with 177.
For a player to threaten Crawford's record, he would have to average 15 triples over 20 seasons just to get to 300. Between 2010 and 2019 the Major League leader in triples finished each year with an average of 13, and no player in that decade had more than 16 in a season.[52] The closest active player is Dexter Fowler with 82.[53]
Most triples in a season – 36[]
Set by Chief Wilson in 1912.[54][55] Only two other players have ever had 30 triples in a season (Dave Orr with 31 in 1886 and Heinie Reitz with 31 in 1894),[55] while the closest anyone has come in the century since Wilson set the record is 26, shared by Sam Crawford (1914) and Kiki Cuyler (1925).[55] Only six hitters have had 20 triples in the last 50 years: George Brett (20 in 1979), Willie Wilson (21 in 1985), Lance Johnson (21 in 1996), Cristian Guzmán (20 in 2000), Curtis Granderson (23 in 2007) and Jimmy Rollins (20 in 2007).
The aforementioned Sam Miller also added that Chief Wilson was playing his home games in Forbes Field, which in 1912 had a 460-foot center-field distance, noticeably longer than any current MLB park. In his record-setting season, Wilson hit 24 triples at home, a total that has not been surpassed in an entire season since 1925. Additionally, Wilson himself never hit more than 14 triples in any other season. On top of this, no minor-league player has ever had more than 31 triples in a season, despite that level of the game having less capable defenders, many quirky ballparks (more so in past decades than today), and in some historical cases much longer seasons.[25]
Most home runs in a game – 4[]

In all, 18 players have hit four home runs in a game. A five-homer game would require not only that a player get five plate appearances in a game, but that he receive hittable pitches in each appearance. Only two players, having hit four in one game, have ever made a plate appearance that could have resulted in his fifth homer of a game—Lou Gehrig in 1932 and Mike Cameron in 2002. Both players had two plate appearances in a game after having hit four homers; in Gehrig's last at-bat he hit a deep fly to center. Additionally, no player has ever homered in five consecutive at-bats, even in multiple games. Breaking this record would also set the single-game record for most total bases, with 20. However, home runs are being hit at ever-increasing rates, reflecting a shift in the game towards batters focusing on "launch angles", a dramatically reduced stigma for strikeouts, and a claim by some that MLB has allegedly "juiced" the ball.[56] These factors increase the prospect of a five-homer game, particularly over extra innings.
Most grand slams in a single inning – 2[]
Set by Fernando Tatís in 1999.[57] Only twelve other players have ever hit two grand slams in a single game.[58] However, breaking the record would require a player to hit three grand slams in a single inning. Breaking this record would also tie the major league record for RBI in a single game (12). Over 50 players have hit two home runs in a single inning,[59] but no MLB player has so much as hit three home runs in one inning. One minor league player, Gene Rye, hit three home runs in a single inning.[60]
Highest career batting average – .367[]

Set by Ty Cobb in 1928 after beginning his career in 1905.[61] Highlights of this record include three .400 seasons; nine .380 seasons; and leading the league 11 times in batting average.[62] Cobb managed to hit .323 in his final season at age 41.[63] The next-closest player is Rogers Hornsby who had a batting average of .358. The careers of both Cobb and Hornsby straddled the dead-ball and live-ball eras; most of Cobb's career was in the dead-ball era, while most of Hornsby's was in the live-ball era. There are only three players with a career average over .350, and the highest batting average among those who played their entire careers in the live-ball era is Ted Williams' .344. Since 1928, there have been only 46 seasons in which a hitter reached .366 and only Tony Gwynn attained that mark at least four times, finishing with a career .338 batting average.[64] At the end of the 2020 season, Miguel Cabrera led active players in career batting average, fractionally above José Altuve (.313 to .311).[65]
Highest single-season batting average – .440[]
Set by Hugh Duffy in 1894, the highest single-season average in National League, and MLB history. Nap Lajoie's .426 in 1901 is the highest in American League history. In the modern (post-"dead-ball") era, Rogers Hornsby hit .424 in 1924, a feat unmatched since then. George Sisler's .420 average in 1922 still stands as the highest American League average of the modern era. Ted Williams hit .406 in 1941, the last player in either league to top .400 for a season. Since then, only George Brett, who hit .390 in 1980, and Tony Gwynn, who hit .394 in a strike-shortened season in 1994, have even come close to reaching .400, and they were nowhere near any of the historical league or MLB highs. The last player to have completed a full season at even .350[b] was Josh Hamilton, who hit .359 in 2010.[66][67]
In a 2018 ESPN story, the aforementioned Sam Miller argued that it was impossible to hit .400, or even seriously challenge the mark, in the modern game, noting that no hitter in the 21st century entered the second half of the season with an average above .380, and no batter since 2009 who qualified for his league's batting title had a .400 average at any point after May 25. Additionally, Miller argued that a player who might conceivably challenge .400 would have to combine a low strikeout rate, high home run rate, and high batting average on balls in play—a group of skills which largely do not complement one another.[45]
Most RBI in a season – 191[]
Set by Hack Wilson, who batted in 191 runs in 1930. Only Lou Gehrig and Hank Greenberg, at 184 and 183 RBI respectively, ever came close, and there have been no real challenges to the record for over 75 years.
However, Sam Miller argued in 2019 that a serious challenge to Wilson's record, though highly unlikely, was less implausible than challenges to many of the other records listed here. He noted that in 1930, Wilson came to bat with 524 runners on base, drove in 22.7% of them, and hit 56 homers. Neither the number of baserunners nor the RBI percentage is within the top 60 seasons for those statistics in MLB history, with some seasons in the top 60 of both categories having been recorded in the 21st century, and he added "we've all seen players hit 56 home runs, even this decade."[25] However, with today's batters pursuing one of baseball's so-called "three true outcomes" – a home run, walk, or strikeout[68] – there is less likelihood of enough runners on base for such a season to produce anything like 191 RBI.
Highest career on-base percentage – .482[]
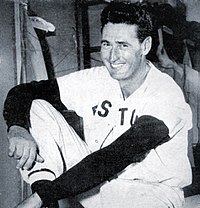
Set by Ted Williams from 1939 to 1960.[69] Williams, the last man to hit .400 in an MLB season (.406 in 1941), won six American League batting titles, two Triple Crowns, and two MVP awards. He ended his career with 521 home runs and a .344 career batting average. Williams achieved these numbers and honors despite missing nearly five full seasons to military service and injuries.[70] The next-closest player in career OBP is Babe Ruth at .474.[71]
Since Williams' retirement, only four players have posted an OBP above .482 in a season, with Barry Bonds and Mickey Mantle the only ones to do so more than once.[69][72] Bonds ended his career with an OBP of .444; the leader among active players is Joey Votto, at .419 after the 2020 season.[71]
Most regular season games played, season – 165[]

The record was set in 1962 by Los Angeles Dodgers shortstop Maury Wills,[73] who played in all of the team's 165 regular season games that year. Thanks to a best-of-three playoff between the Dodgers and San Francisco Giants, which ended the season tied for first place (back when league pennants were winner-take-all, with no annual end-of-season multi-tiered layers of playoffs, play-ins, and wild cards), both teams played 165 games.
Because the play-off was to determine the regular season winner of the league championship, the games were counted as extensions of the regular season, and not the post-season, which at that time was composed solely of the World Series.
Both the individual and team single-season games played records were set at the beginning of a seven-year span that began with the 1962 National League expansion to 162 games and ended after the 1968 season, when the NL replaced its traditional best-of-three tiebreakers with one-game playoffs. The 1962 season was the only occasion during those years in which a tie-breaker was needed. The American League has always used one-game playoffs.
No team has played more than 163 regular season games in a season since 1962. While there have been a few occasions where a three-way tie was possible going into the last day of the season (which would result in a team playing 164 games), a three-way tie involving postseason berths has never occurred. From 1969 to 1993, it would have been impossible for any team to be involved in more than three one-game playoffs in a season, since only division champions qualified for the postseason and since there was never more than eight teams per division. As of the end of the 2018 season, there has yet to be an occasion in MLB history where five teams of one league have finished with identical records, which would have been the circumstance needed during this era for any team to play even three tie-breakers and thus match the 1962 record.
Since the introduction of the wild card, it has been technically possible to play 166 regular season games, but is extremely unlikely. For a team to have an opportunity to play four tiebreaker games, it would have to be involved in a tie involving three or more teams for the division crown and a separate tie also involving three or more teams for the second wild card berth, meaning that the aforementioned-unprecedented circumstance at least five teams in two different divisions of the same league finishing with identical records would have to occur. A team in such a situation would then have to win the division "semi-final" tiebreaker, lose the division "final" and then win the wild card "semi-final" in order to play 166 regular season games. The 2018 season, which resulted in two two-way ties for division titles, was the first occasion where there were even multiple two-way ties for division titles – the losers of the 2018 tiebreaker games (who did not themselves have identical records) subsequently played each other in the Wild Card Game, but that game is considered part of the postseason and not the regular season.
Wills' individual record is statistically ever more unlikely to be broken because teams are increasingly inclined to rest even their best players, part of a new metric-based strategy known as "load management". On average only about three players in all of baseball appear in all 162 games of any given MLB season. This implies that even if a club somehow managed to play 166 regular season games, there is mathematically only about a ten percent chance a particular team will have a player who will have appeared in all 162 games pending tie-breakers.
It is also possible for a player to accumulate more than 162 games played in a season by virtue of a mid-season trade. A swap between a team that has played more games and one which has played fewer can result in a schedule for the traded player to be greater than either individual teams'. Presently '70s-era speedster Frank Taveras[73] holds the records for both most regularly scheduled MLB games played in a season[citation needed] and most games played for two teams in the same season,[citation needed] both 164, done in 1979.
A player can also be credited with more than 162 games played due to weather. Games have sometimes been called due to weather with the score tied after the game becomes official (five or more innings played). Due to the tie score, such games did not count in the official standings and were replayed in their entirety. However player statistics still counted, allowing for example Hideki Matsui to play 163 games for the New York Yankees in 2003. The rules were changed in 2007 to require such tie games to generally be suspended and completed, rather than replayed in full, making this a scenario that is unlikely to be seen again.[74][75]
Most consecutive games played – 2,632[]
Set by Cal Ripken Jr., 1982–98.[76] Lou Gehrig, whose record Ripken surpassed in 1995, had a consecutive games streak of 2,130 games, 502 fewer.[28][76][77] Third on the all-time list is Everett Scott, whose streak of 1,307 consecutive games is less than half of Ripken's total.[77] Only seven players have ever played more than 1,000 consecutive games.[77] For a player to approach the milestone, he would have to play all 162 games in a season for 16 years just to get to 2,592 games.
As stated by LIFE, "no one else has ever come close, and no one ever will."[76] It is important to note, however, that before Gehrig's record was broken by Ripken Gehrig's record was considered unbreakable. In his 1988 edition of The Baseball Abstract, author Bill James offered a presciently contrarian view that "... Gehrig's record is vulnerable precisely because human characteristics such as determination and the ability to play with pain can be applied to breaking it ... I expect Gehrig's (2,130) record to be broken in my lifetime". At that time, Ripken was more than seven years away from the record.[78]
On average, over the preceding ten seasons from 2009 to 2018 only three players have played all 162 regularly-scheduled games in a particular season.
Longest hitting streak – 56 games[]
With pitching the way it is—specialty guys, closer and setup guys—you're not going to have a chance to get four at-bats against one guy. On one night, you might face four different guys. I'm still amazed DiMaggio got to 56. I'm amazed now when somebody gets to 30.
—Robin Ventura, who set the NCAA Division I record of hitting in 58 consecutive games[79]
Set by Joe DiMaggio, 1941.[2] Highlights of his hitting streak include a .404 batting average and 91 hits.[80] The next closest player is Willie Keeler, with 45 over two seasons in 1896–7.[81] There have been only six 40-game hitting streaks, and only Pete Rose's 44 in 1978 since DiMaggio's.[81][82] Since 1900, no player other than DiMaggio has ever hit safely in even 55 of 56 games, and no active players (as of 2019) have their two longest career hit streaks even add up to 56 games.[25][83]
On July 17, 1941, pitchers Al Smith and Jim Bagby of the Cleveland Indians held DiMaggio hitless. Two hard hit shots came close, but great defensive stops by third baseman Ken Keltner ended the streak.[84] "Joltin' Joe" actually hit in 57 straight MLB games – singling in the 1941 All-Star game held mid-streak[85] – and 76 out of 77 regular season games, starting a 17-game streak the day after his 56-game one ended.[86] He also holds the second longest streak in minor league baseball history, 61 games, set in 1933.[85]
The improbability of DiMaggio's hitting streak ever being broken has been attributed to increased bullpen use, including specialist relievers.[77]
Most career home runs by an American League pitcher – 37[]
Set by Wes Ferrell, who hit 37 home runs while playing for the Indians, Red Sox, Senators and Yankees during the late 1920s and most of the 1930s (Ferrell hit one more home run while with the Braves in 1941, bringing his total to 38 – 37 as a pitcher and one as a pinch-hitter – the most for any MLB pitcher). With a total of 326 hits in 1,176 at-bats in his 17-year career, almost all of which occurred while he played in the AL, Ferrell hit .280 and had 208 RBIs,[87] and is considered one of baseball's best-hitting pitchers. Other American League pitchers with high home-run totals include Bob Lemon, who hit 35 HR as a pitcher and two more as a pinch hitter during his 18-year career, all spent with the Indians; Red Ruffing, who had 34 home runs as a pitcher and two more as pinch-hitter over 22 seasons with the Red Sox, Yankees and White Sox; and Earl Wilson, who hit 35 home runs in an 11-year career – 33 as a pitcher and two as a pinch-hitter – all but one of them while with the Red Sox and Tigers, and the last as a Padre.[88] With "good-hitting pitchers" the exception rather than the rule, the American League's adoption of the designated hitter rule in 1973 – leading to the widespread substitution of the DH in the pitcher's traditional #9 slot in the batting order in all AL games and all interleague, All-Star and World Series games played in AL parks – means that no American League pitcher will ever get enough at-bats to seriously challenge any of the above home run statistics, or any other game, seasonal or career hitting marks set by AL pitchers historically. However, the Los Angeles Angels' signing of Japanese player Shohei Ohtani, who plays as both a starting pitcher and a designated hitter, could mean that Ferrell's record could be broken (although Ohtani generally does not hit and pitch in the same game when playing in AL parks, so his home runs as a DH may not be considered as being hit "by a pitcher").
Most career sacrifice bunts – 512[]
Set by Eddie Collins, who successfully laid down 512 sacrifice bunts over his 25-year career with the Philadelphia Athletics.[89] Second behind him is Jake Daubert with 392. Since the turn of the 20th century, sacrifice bunts have continually fallen further out of favor: Moneyball by Michael Lewis, the famous sabermetrician's guide, went as far as to label the bunt as "evil". Modern baseball teams value minimizing outs rather than moving a base-runner over a single base position.
Today, bunting is most often attempted by players with limited hitting abilities - usually pitchers in National League parks who when required to bat often attempt to advance baserunners as opposed trying to reach base (and run the basepaths). However, pitchers do not play anywhere close to enough innings to get a realistic opportunity to challenge Collins' record. Furthermore, load management considerations, combined with managers' tendency to replace pitchers with pinch hitters (especially if a pitcher coming up in the batting order is nearing his pitch count limit) mean that NL pitchers get fewer at bats in the 21st century. Moreover, each MLB team plays twenty interleague games per season meaning that as of 2022 NL teams only play 152 games per season in NL parks. At the end of the 2020 season the active leader in career sacrifice bunts, pitcher Clayton Kershaw, had 108 — which placed him in a tie for 334th on the all-time list.[90]
Most stolen bases in a season – 130[]
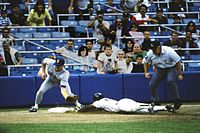
Set by Rickey Henderson with 130 in 1982, a season in which he was caught stealing 42 times. No player in the 2018 season even attempted one-third of Henderson's total attempts in 1982, and in the 2017 season, no American League player attempted more than Henderson's 1982 caught-stealing total of 42. Additionally, while Billy Hamilton set a minor-league record with 155 steals in 2012, he has never stolen more than 60 in any season of his MLB career.[25]
Most career stolen bases – 1,406[]
Set by Rickey Henderson, 1979–2003.[28][91] Highlights include: three 100-stolen-base seasons,[42] thirteen 50-stolen-base seasons, and leading the league in stolen bases 12 times.[92] The next closest player is Lou Brock, who has 468 fewer stolen bases at 938. According to LIFE, the stolen base record is probably unbreakable, as it is hard to imagine a player today who would "even attempt so many steals."[91] For a player to approach Henderson's milestone, he would have to average 70 stolen bases over 20 seasons just to get to 1,400.[42] Between 2000 and 2009, the Major League leader in stolen bases finished each year with an average of 64, and that number dropped to 57 in the 2010s—a decade in which no player stole 70 bases in a season.[93] The closest active player is Dee Strange-Gordon with 333 stolen bases, less than 25% of Henderson's total.[42][94]
Most steals of home in a career – 54[]
Ty Cobb holds the record of 54 steals of home in his career. Since there is rarely a single steal of home in any season now, this record stands little chance of ever being approached, let alone surpassed.[95]
Fielding[]
Most outfield assists in a season – 50[]

Set by Orator Shafer in 1879. Since 1900, no other player has had more than Chuck Klein's 44 in 1930, and nobody has had more than Boston Brave right-fielder Gene Moore's 32 since 1936.[97]
Most outfield assists, career – 449[]
Set by Hall of Famer Tris Speaker (1907–28).[98] Speaker is regarded as the greatest fielding centerfielder ever, known for playing exceptionally shallow and going back on balls rather than coming in. Playing shallow in his era both erased a lot of hits and led to high assist totals – fourteen seasons over 20 and four over 35. The closest any player has come to that total in the years since is Roberto Clemente's (1955–1973) 266.[98]
Other[]
Most All-Star Games played – 25[]

Set by Hank Aaron, 1954–76. Aaron was an All-Star in all but two of the 23 seasons he played in the major leagues (his debut year in 1954 and last season in 1976). His record total was assisted by MLB's decision to hold two All-Star Games annually from 1959 to 1962;[99] Aaron played in all eight All-Star Games during that period. The only players whose careers began after 1976 to play in 25 MLB seasons were Rickey Henderson, who appeared in 10 All-Star Games,[99] and Jamie Moyer, who appeared in one.[100] The active player with the most All-Star Game selections is Miguel Cabrera, who has been on 11 All-Star Game rosters after 18 seasons.[101]
Most wins, losses and games managed – 3,731, 3,948, and 7,755[]
Set by Connie Mack, who retired in 1950.[102] Mack owned the Philadelphia Athletics, and managed them for 50 years, until the age of 87.[102] Shortly after his retirement Major League Baseball forbade owners from managing their teams.[citation needed] Mack also was the manager in 76 ties as he managed in an era where games could be called due to darkness or local curfews.[103] As ties are now extremely rare as a result of rules changes and modern stadium lights, this record is likely unbreakable given the current rules.[75] Also, during baseball's early decades, owners who did not manage their own teams often sought to have a veteran player fill the role in order to reduce payroll costs. Such arrangements led to the "player-manager" position becoming relatively common in baseball and afforded greater opportunity to start a managerial career at a relatively young age.
Mack is also the oldest manager in MLB history - the only other person to manage in the majors after his eightieth birthday is Jack McKeon who retired shortly before his 81st birthday. At the start of the 2021 season, the closest manager to Mack in games managed and losses was Tony La Russa (then 5,097 games, 2,365 losses). La Russa returned to managing in 2021 after a 10-year absence from that role, and upon doing so became the third-oldest manager in history aged 76; he would now need to manage into his nineties to challenge Mack's records. During the 2021 season, La Russa passed John McGraw's total of 2,763 wins to take possession of second place in that category.[104] The next-closest active manager in games, wins, and losses is Dusty Baker (age 71), who started the 2021 season with 3,560 games managed (14th), 1,892 wins (15th), and 1,667 losses (15th).[104]
Under the current 162-game schedule, a person would have to manage for 48 seasons to challenge Mack's records. Thus, for example, a person would have to manage continuously starting in the year he turned 32 to have a chance to reach 7,756 games before turning 80, and even then only if no seasons were significantly shortened and/or cancelled due to labor disputes, public health emergencies and/or other extenuating circumstances. With the de facto elimination of the player-manager position (the last player-manager in MLB was the aforementioned Pete Rose, who incidentally was in that role for the Cincinnati Reds when he broke Ty Cobb's all-time hit record) and the increasing tendency of players who display the leadership qualities that warrant eventual consideration for employment as field managers also having longer playing careers, it is now uncommon for anyone to earn their first MLB managerial position prior to turning forty.
The youngest two managers in MLB in the 21st century are Eric Wedge and A. J. Hinch who were both 35 when they first managed in the majors. Both were players who had their careers cut short by injuries but had also displayed strong leadership qualities. Wedge has not managed in the majors since 2013, while Hinch has had two stints away from managing (the most recent being a one-year suspension due to his role in the Houston Astros sign stealing scandal, although it should be noted this suspension was served during the pandemic-shortened 2020 season which effectively shortened all active careers by at least 102 games). As of 2021, any current or recently-active MLB manager would have to break Mack's record as the oldest manager before challenging any of his other records.
Most road losses in a season – 101[]

The 1899 Cleveland Spiders (20–134) hold the MLB record for the most road losses in a single season, with 101. They were so bad – 20 wins below the 1962 New York Mets – they likely set an unbreakable record for fewest wins in a full season at the same time. In terms of absolute numbers the Spiders' record for fewest wins has been nominally "broken" by the 2020 Pittsburgh Pirates, who won exactly one less game than the 1899 Spiders by finishing 19–41 in the pandemic-shortened sixty-game season.
What is unusual, however, about the Spiders' road loss record compared to others on this list is that while most others are theoretically possible (but impractical) to break, it cannot mathematically be broken even if a team achieved a completely winless season on the road: in today's sport, the 162-game season is equally divided between 81 home and road games, 21 fewer than needed to set a new mark.[105]
While rainouts and other cancellations can reduce the number of games a team plays in a season, there is no way to accumulate the 21 extra road games needed to break the record. The only situation in which regular season games are ever added to the schedule is in the case of the one-game playoff; the odds of a team losing all of its road games but still having a record strong enough to qualify for such a game are infinitesimally small. In the uncommon circumstance that a game must be moved to the opposing venue, MLB policy now maintains the legal fiction that the designated home team does not change, regardless of venue, which ensures the designated home team does not lose rules advantages. This was not the case in 1899, when 35 of the Spiders' home games were changed to road games.
Four other factors contribute to the unique nature of the Spiders' record:
- In the nineteenth century, owners were allowed to own more than one team. In 1898 the Spiders finished a respectable fifth in the NL, but dead last out of twelve teams in attendance at only 70,496 for the entire season. In contrast the St. Louis Browns (now Cardinals) were by far the worst team on the field but still drew respectable crowds by the standards of the time, especially considering the team's poor performance. Observing that the Browns had drawn 151,700 (more than double Cleveland's total), Spiders owners Frank and Stanley Robison decided it would be more profitable to have a good team in St. Louis. They purchased the Browns, renamed them the Perfectos and proceeded to brazenly trade the Spiders' best players from 1898 – including future Hall of Fame pitchers Cy Young, Jesse Burkett and Bobby Wallace – to the Perfectos in exchange for St. Louis' least desirable players, with their manager, Patsy Tebeau. From 1900, MLB rules have prohibited a single owner owning more than one team to avoid any repeat of this, or any similar, arrangements.
- Baseball teams in 1899 had gate receipts as their main source for revenue. Resigning themselves to the reality that fans in Cleveland were not going to pay to watch a decimated roster, the Spiders/Perfectos ownership transferred all of the Spiders' home games against the Perfectos to St. Louis. As the season wore on, the already-puny crowds in Cleveland shrank in response to mounting losses to a fraction of even their NL-worst 1898 numbers. In all 42 games played in 1899 in Cleveland the Spiders drew only 6,088 fans - an average of 145 per game. In response to the mounting fiasco, the other ten NL teams requested the Spiders transfer home games to their parks as well since their cut of the gate receipts would leave them unable to recoup the expenses of the journey. Since the Spiders' cut of the gate receipts for road games was far more lucrative than their gate receipts for home games, the Spiders' owners were not inclined to object to such requests. Thus, the Spiders only played eight home games after July 1, giving them the opportunity for 101 road losses (against 11 wins).
- Today, MLB revenue streams are far more numerous, while in the case of media rights are often both contractually dependent on teams playing their entire schedule, and are not affected by attendance, while travel expenses make up a much smaller portion of a team's budget. MLB rules also state any team that refuses to travel to their opponent's stadium for a scheduled game would immediately forfeit the game.
- In the nineteenth century, NL scouting practices were rudimentary by modern standards and the modern minor league farm system did not exist in its present form. In an era where the railroad and telegraph were the most advanced forms of transportation and communication respectively, NL club management often had little knowledge of prospects playing in other leagues besides perhaps those playing relatively nearby. In any case, scouting and recruiting efforts were essentially limited to the United States, with the enforcement of the color barrier limiting the NL's potential talent pool even further. While NL clubs did cultivate relationships with teams in other leagues, procuring players from them often involved contentious negotiations with teams in autonomous leagues that (at best) grudgingly accepted NL pre-eminence (indeed, it was resentment of the NL's attempts to dominate combined with the contraction of the Spiders and three other teams that directly led to the formation of the American League). While NL owners sometimes tried to overcome this by acquiring financial interests in "minor league" clubs, even they could become reluctant to exercise any rights to move such a team's best players to the NL especially if the "minor league" team was in its own pennant race and/or doing reasonably well at the gate. In any case, there is no evidence that the owners of the Spiders upon, committing to strip its roster of the best players, made any effort to replace them such as by trying to purchase the contracts of potentially better players in other leagues. Instead, they compelled the team in Cleveland to play the 1899 season with the roster they had. The end result was a Cleveland team that was worse than would likely be the relative result of 21st century MLB organization that were to go so far as to hypothetically trade away its entire major league roster (and/or let it leave via free agency) and then signing only replacement-level players willing to play for the MLB minimum salary.
- The popular sabremetric statistic Wins Above Replacement (WAR) is based on the premise that an MLB team consisting of only replacement-level players would still be expected to win 40-50 games in a season, depending on factors such as the strength of its division. This is mostly because over the course of the twentieth century, the talent pool available to Major League Baseball became several orders of magnitude deeper than it was in the nineteenth century for a number of reasons including:
- Baseball becoming popular in much of the world outside the United States, which combined with overall population growth has resulted in many more young players taking up the game;
- Growing economic prosperity in baseball-playing nations allowing more young players to pursue the game seriously enough to eventually attract the attention of scouts;
- The elimination of the color barrier in the middle of the twentieth century due to the efforts of Branch Rickey and others, followed by the somewhat related development of MLB increasingly signing players from Asia, Latin America and elsewhere, thus giving MLB access to vast additional pools of talent that it deliberately avoided in 1899;
- The development of the modern minor league farm system (also championed by Rickey) and later innovations such as the Major League Baseball draft eventually resulted in talent below the major league level being more evenly distributed between all MLB organizations.
- The popular sabremetric statistic Wins Above Replacement (WAR) is based on the premise that an MLB team consisting of only replacement-level players would still be expected to win 40-50 games in a season, depending on factors such as the strength of its division. This is mostly because over the course of the twentieth century, the talent pool available to Major League Baseball became several orders of magnitude deeper than it was in the nineteenth century for a number of reasons including:
- In spite of the aforementioned circumstances, the 1899 Spiders still managed to play their entire 154-game schedule – an unusual occurrence in an era when cancellations were much more frequent, and cancelled games were often not made up.
The 1899 Spiders also hold the records for the most losses in a single MLB season (with 134) and lowest winning percentage (.130). While these are technically possible to break, even under a 162-game schedule, only two teams have come within 15 losses of the record, these being the expansion 1962 New York Mets (40–120, .250 winning percentage) and the 2003 Detroit Tigers (43–119, .265 winning percentage).
Since 1899, only five teams have recorded a winning percentage under .260 (i.e. less than double that of the 1899 Spiders), and the 1962 Mets are the only team to do so under a 162-game schedule. Excluding the possibility of cancelled games not being made up, a team would need to lose 141 games over a 162-game season to record a .130 winning percentage (this yields a .129 winning percentage if the traditional rounding to three decimal places is ignored).
Highest paying attendance – 115,301 (preseason game), 80,277 (regular season game), 4,483,350 (regular season total), 92,706 (postseason/World Series game), 72,086 (All-Star Game)[]
The only MLB game to ever record an attendance of over 100,000 was a preseason game between the defending champions Boston Red Sox and Los Angeles Dodgers on Saturday March 29, 2008 at the Los Angeles Memorial Coliseum.[106] Because this was an exhibition game, certain MLB protocols that would have prevented such a large crowd from gathering for a regular season or postseason game were not enforced. The largest crowds for the postseason, which at the time consisted only of the World Series, were set at the same stadium in 1959 - this was the Dodgers' second season in Los Angeles, and they were playing at the Coliseum full-time since Dodger Stadium was not yet completed. All three Series games played in California that year attracted crowds of over 92,000 with Game 5 (played on October 6) attracting the largest crowd.
The largest attendance for an All-Star Game was set on August 9, 1981 (the first game back after a strike in the middle of the season) which was played at Cleveland Municipal Stadium. Overall, attendance has been on an upward trend over the decades and of the 30 current MLB teams only one (the Cincinnati Reds) has a regular season attendance record that dates from before the 1990s. The first team to get more than four million fans to pass through the turnstiles during the regular season was the 1991 Toronto Blue Jays.
Although the Blue Jays again attracted four million fans in their 1992 and 1993 championship seasons, their record was broken in the latter year by the expansion Colorado Rockies who were playing their inaugural season at Mile High Stadium while Coors Field was being built. Playing in a facility originally built for American football, the Rockies set the all-time regular season single game attendance record on Opening Day and went on set an overall regular season attendance record that still stands. The Rockies would have likely attracted four million fans again in 1994 (their last season at Mile High) if not for the strike that prematurely ended the season. The four million mark has since been reached five more times, all by New York teams. The Yankees attracted four million fans for four consecutive years from 2005 through 2008 while the Mets attracted four million fans in 2008. For both teams, 2008 was the final season in their long-time venues of Yankee Stadium and Shea Stadium.
Baseball's upward trend in attendance was aided in the middle decades of the twentieth century by the growing popularity of professional American football especially the National Football League. In their early days as a fledgling league, NFL teams often simply made do as best they could in their cities' MLB ballparks, which were often of a "jewel box" configuration suited to baseball. However, as football became more popular, existing ballparks were renovated to better accommodate football fans and new stadia were often fully-enclosed "cookie-cutter" multi-purpose facilities intended to accommodate both baseball and football.
Eventually, both MLB and the NFL became dissatisfied with such arrangements. Stadium management had to choose between retaining a grass field which was difficult to maintain to a high standard under the stress of two teams, or switching to artificial turf which was highly unpopular with players and fans in both sports. Meanwhile, MLB teams usually found the tens of thousands of extra seats to be of little economic value - the stands, which were generally intended to have the most desirable football sightlines at near midfield, were beyond the outfield in the baseball configuration and thus had very poor sightlines for a baseball game. Due to the much shorter NFL season, football teams could often still earn reasonably lucrative gate receipts for seats with marginal football sight lines. MLB teams in contrast, which play approximately ten times the number of games in a regular season, often covered the least desirable seats with tarpaulin for baseball games in the belief that it would be more profitable to compel fans to purchase more expensive tickets in the traditional baseball seating areas.
By the 1990s baseball teams were moving in earnest into baseball-specific "retro-classic" and "retro-modern" parks which featured fewer or no seats in the parts of the outfield with poor sightlines. Such ballparks tend to be smaller than earlier facilities, with capacities typically ranging from 30,000 to 50,000 spectators - much smaller than what would be needed for their occupants to challenge any MLB attendance records. In the 2010s, many existing ballparks (including some recently-built facilities) were further renovated to add luxury boxes and further enhance fan comfort and amenities. This often entails removing rows of seats or replacing them with smaller numbers of larger, more comfortable seats, thus further reducing capacity.
The only current MLB ballpark with a capacity that could conceivably challenge the Rockies' season total attendance record is Dodger Stadium, with a listed capacity of 56,000, and the only other stadium with a listed capacity of even 50,000 is Coors Field which can hold 50,144 with standing room. Not counting the crowdless 2020 season, the Dodgers have led MLB attendance every year since 2013 and in 2019 set a new franchise record of 3,974,309, ninth highest in MLB history after the aforementioned totals of over four million. Due to ongoing COVID-19 restrictions imposed by the Dodgers and their local and state authorities, the team started the 2021 season at only 20% capacity (about 11,000 fans) meaning they will have to wait until at least the 2022 season before they can conceivably try to draw four million fans again. The only team that started the 2021 season with no attendance restrictions, the Texas Rangers, plays in a ballpark that seats barely over 40,000, giving the team a maximum possible attendance of slightly over 3.2 million.
Lowest paying attendance – 6[]
This was set by the Worcester baseball club in 1882.[107] While a 2015 MLB game in Baltimore and all games in the pandemic-shortened 2020 season (except for the NLCS and World Series) were held in closed ballparks with nominal attendance of zero, MLB instead listed the official attendance for these games as N/A, thus allowing the Worcester game to retain the record.[108] Worcester, dead last in the NL for the 1882 season and located in a city that did not meet the NL's population standards, was set to be removed from the NL at the end of the season.[107]
Notes[]
- ^ In accordance to longstanding statistical norms, complete games are credited whenever a hurler pitches an entire official game regardless of its length. The only MLB-recognized pitching statistic which requires nine innings of pitching to earn credit for is a perfect game.
- ^ While both batting champions in 2020 hit over .350 (DJ LeMahieu in the American League at .364 and Juan Soto in the National League at .351), the regular season was shortened to 60 games due to COVID-19.
References[]
General[]
- Kendrick, Scott. "Top 10 Most Unbreakable Baseball Records". About.com Baseball. Retrieved December 1, 2011.
- Ingraham, Jim (August 20, 2009). "The top 10 most unbreakable baseball records". The Morning Journal. Retrieved December 1, 2011.
Specific[]
- ^ Jump up to: a b c d "1. Johnny Vander Meer's Back-to-Back No-Nos – Unbreakable Baseball Records". LIFE.com. See Your World LLC. Archived from the original on May 5, 2010.
- ^ Jump up to: a b c Moore, Terence (September 7, 2011). "Ripken's iron man record unbreakable". MLB.com. Retrieved November 28, 2011.
- ^ Jump up to: a b c d e f g Harkins, Bob (September 27, 2011). "Not all records are made to be broken". NBC Sports.com. Archived from the original on January 4, 2013. Retrieved November 28, 2011.
- ^ Jump up to: a b "4. Cy Young's 511 Career Wins – Unbreakable Baseball Records". LIFE.com. See Your World LLC. Archived from the original on May 5, 2010.
- ^ Jump up to: a b "Cy Young Statistics and History". Baseball-Reference. Sports Reference LLC. Retrieved February 20, 2011.
- ^ MLB: Who holds the record for most career wins? https://bolavip.com/en
- ^ "511 wins – Cy Young – Unbreakable Baseball Records". SI.com. Retrieved November 26, 2011.
- ^ "Single-Season Leaders & Records for Wins". Baseball-Reference. Sports Reference LLC. Retrieved November 26, 2011.
- ^ "Active Leaders & Records for Wins". Baseball-Reference. Sports Reference LLC. Retrieved November 8, 2020.
- ^ "Wins Records by Baseball Almanac". Retrieved March 30, 2017.
- ^ "Year-by-Year Top-Tens Leaders & Records for Games Started". Baseball-Reference. Sports Reference LLC. Retrieved September 30, 2019.
- ^ "Year-by-Year Top-Tens Leaders & Records for Wins". Baseball-Reference. Sports Reference LLC. Retrieved November 8, 2020.
- ^ Jump up to: a b "48 complete games – Jack Chesbro (1904) – Unbreakable Baseball Records". Sports Illustrated. Retrieved November 1, 2012.
- ^ "Career Leaders & Records for Games Started". Baseball-Reference. Retrieved July 22, 2017.
- ^ "Active Leaders & Records for Complete Games". Baseball-Reference. Sports Reference LLC. Retrieved April 30, 2021.
- ^ "Baseball Prospectus – Baseball Therapy: What Happened to the Complete Game?". Retrieved March 30, 2017.
- ^ "Lost Art of the Complete Game". September 4, 2015. Retrieved March 30, 2017.
- ^ "Year-by-Year Top-Tens Leaders & Records for Complete Games". Baseball-Reference. Retrieved September 30, 2019.
- ^ Miller, Sam (March 21, 2019). "How many complete games will be thrown in 2019? Thirty? Ten? None?". ESPN.com. Retrieved April 2, 2019.
- ^ Jump up to: a b c "13. Walter Johnson's 110 Career Shutouts – Unbreakable Baseball Records". LIFE.com. See Your World LLC. Archived from the original on May 5, 2010.
- ^ "Walter Johnson Statistics and History". Baseball-Reference. Sports Reference LLC. Retrieved February 20, 2011.
- ^ "Year-by-Year Top-Tens Leaders & Records for Shutouts". Baseball-Reference. Sports Reference LLC. Retrieved November 8, 2020.
- ^ "Active Leaders & Records for Shutouts". Baseball-Reference. Sports Reference LLC. Retrieved November 8, 2020.
- ^ "Single-Season Leaders & Records for Shutouts". Baseball-Reference. Sports Reference LLC. Retrieved April 2, 2019.
- ^ Jump up to: a b c d e f g Miller, Sam (March 19, 2019). "Which of baseball's most unbreakable records might actually get broken in 2019?". ESPN.com. Retrieved April 2, 2019.
- ^ McEntegart, Pete (July 23, 2006). "The 10 Spot". SI.com. Archived from the original on August 28, 2012.
- ^ "The Fans Speak Out". Baseball Digest. Lakeside Publishing. 65 (5): 7. July 2006. ISSN 0005-609X. Retrieved June 9, 2009.
- ^ Jump up to: a b c Baseball's Most Unbreakable Feats (DVD). Major League Baseball Productions. 2007. ISBN 978-0-7389-3978-0.
- ^ Jump up to: a b c "MLB No-Hitters". ESPN.com. Retrieved November 14, 2019.
- ^ "Max Scherzer loses perfect game with HBP in 9th but completes no-hitter". ESPN.com. June 20, 2015. Retrieved June 21, 2015.
- ^ Jump up to: a b "5,714 career strikeouts – Nolan Ryan – Unbreakable Baseball Records". SI.com. Retrieved November 27, 2011.
- ^ Jump up to: a b c "15. Nolan Ryan's 5,714 Career Strikeouts – Unbreakable Baseball Records". LIFE.com. See Your World LLC. Archived from the original on May 5, 2010.
- ^ "Nolan Ryan Statistics and History". Baseball-Reference. Sports Reference LLC. Retrieved February 20, 2011.
- ^ "Career Leaders & Records for Strikeouts (pitching)". Baseball-Reference. Sports Reference LLC. Retrieved April 30, 2021.
- ^ Jump up to: a b "Year-by-Year Top-Tens Leaders & Records for Strikeouts". Baseball-Reference. Sports Reference LLC. Retrieved September 30, 2019.
- ^ "Active Leaders & Records for Strikeouts". Baseball-Reference. Sports Reference LLC. Retrieved April 30, 2021.
- ^ "Career Leaders & Records for Bases on Balls". Baseball-Reference. Sports Reference LLC. Retrieved November 8, 2020.
- ^ Jump up to: a b "Year-by-Year Top-Tens Leaders & Records for Innings Pitched". Baseball-Reference. Retrieved November 8, 2020.
- ^ "Career Leaders & Records for Wild Pitches". Baseball-Reference. Sports Reference LLC. Retrieved November 8, 2020.
- ^ Jump up to: a b "12. Pete Rose's 4,256 Career Hits – Unbreakable Baseball Records". LIFE.com. See Your World LLC. Archived from the original on May 5, 2010.
- ^ Jump up to: a b c "Active Leaders & Records for Hits". Baseball-Reference. Sports Reference LLC. Retrieved November 8, 2020.
- ^ Jump up to: a b c d e Harkins, Bob (September 27, 2011). "Not all records are made to be broken". NBC Sports.com. Archived from the original on November 29, 2011. Retrieved November 28, 2011.
- ^ "Ichiro Suzuki: Japanese Leagues Statistics". Baseball-Reference. Sports Reference LLC. Retrieved October 4, 2015.
- ^ Jump up to: a b "Single-Season Leaders & Records for Hits". Baseball-Reference. Sports Reference LLC. Retrieved April 2, 2019.
- ^ Jump up to: a b Miller, Sam (February 8, 2018). "Why no one will hit .400 ever again". ESPN.com. Retrieved February 9, 2018.
- ^ "6. Ichiro Suzuki, 10 Straight 200-Hit Seasons – Unbreakable Baseball Records". LIFE.com. See Your World LLC. Archived from the original on May 5, 2010.
- ^ "Ichiro Suzuki Statistics and History". Baseball-Reference. Sports Reference LLC. Retrieved December 3, 2011.
- ^ "Hits Records by Baseball Almanac". Baseball-almanac.com. Retrieved December 3, 2011.
- ^ Baseball's Top 100: The Game's Greatest Records, p.46, Kerry Banks, 2010, Greystone Books, Vancouver, BC, ISBN 978-1-55365-507-7
- ^ "Year-by-Year Top-Tens Leaders & Records for Hits". Baseball-Reference. Sports Reference LLC. Retrieved September 30, 2019.
- ^ "Sam Crawford Statistics and History". Baseball-Reference. Sports Reference LLC. Retrieved February 20, 2011.
- ^ "Year-by-Year Top-Tens Leaders & Records for Triples". Baseball-Reference. Sports Reference LLC. Retrieved September 30, 2019.
- ^ "Active Leaders & Records for Triples". Baseball-Reference. Sports Reference LLC. Retrieved November 8, 2020.
- ^ Fiore, Gary (June 28, 2011). "Jose Reyes on track to set record for most triples in a season". SILive.com. Retrieved May 5, 2012.
- ^ Jump up to: a b c "Single-Season Leaders & Records for Triples". Baseball-Reference. Sports Reference LLC. Retrieved May 5, 2012.
- ^ Justin Verlander blames MLB for juiced balls, home run spike: 'Major League Baseball's turning this game into a joke'
- ^ Long, Jack (April 30, 1999). "Tatis' grand slam record not likely to be broken". cnnsi.com. Retrieved March 19, 2013.
- ^ "Two Grand Slams in One Game". www.baseball-almanac.com. Archived from the original on April 2, 2013. Retrieved March 19, 2013.
- ^ "Two Home Runs in One Inning". www.mlb.com. Retrieved March 19, 2013.
- ^ "Incredible Performances in Texas League History". www.milb.com. Retrieved March 19, 2013.
- ^ "11. Ty Cobb's .367 Career Average – Unbreakable Baseball Records". LIFE.com. See Your World LLC. Archived from the original on May 5, 2010.
- ^ "Ty Cobb Statistics and History". Baseball-Reference. Sports Reference LLC. Retrieved February 20, 2011.
- ^ "Ty Cobb". Baseball-Reference. Sports Reference LLC. Retrieved April 30, 2021.
- ^ ".366 lifetime batting average – Ty Cobb – Unbreakable Baseball Records". SI.com. Retrieved November 27, 2011.
- ^ "Active Leaders & Records for Batting Average". Baseball-Reference. Sports Reference LLC. Retrieved November 8, 2020.
- ^ "MLB Batting Champion as Recognized at End of Year". Baseball-Reference. Sports Reference LLC. Retrieved November 12, 2020.
- ^ "2010 AL Standard Batting". Baseball-Reference. Sports Reference LLC. Retrieved November 12, 2020. Sorting the "Player Standard Batting" table at this location by batting average confirms that no AL player finished within 30 points of Hamilton.
- ^ Three True Outcomes, Baseball-reference.com
- ^ Jump up to: a b ".482 lifetime on-base percentage – Ted Williams – Unbreakable Baseball Records". Sports Illustrated. Retrieved November 1, 2012.
- ^ "Hall of Famers: Williams, Ted". National Baseball Hall of Fame and Museum. Retrieved November 1, 2012.
- ^ Jump up to: a b "Career Leaders & Records for On-Base%". Baseball-Reference. Retrieved November 8, 2020.
- ^ "Single-Season Leaders & Records for On-Base%". Baseball-Reference. Retrieved November 1, 2012.
- ^ Jump up to: a b Batting Leaderboards: Single-Season Leaders & Records for Games Played, baseball-reference.com
- ^ "Hideki Matsui Stats". Baseball Almanac. Retrieved November 16, 2020.
- ^ Jump up to: a b Lauing, Jacob (September 30, 2016). "MLB sees first tie game in a very, very long time". Mashable. Retrieved November 16, 2020.
- ^ Jump up to: a b c "2. Cal Ripken, Jr.'s Consecutive-Games Streak – Unbreakable Baseball Records". LIFE.com. See Your World LLC. Archived from the original on May 5, 2010.
- ^ Jump up to: a b c d Harkins, Bob (September 27, 2011). "Not all records are made to be broken". NBC Sports.com. Archived from the original on November 28, 2011. Retrieved November 28, 2011.
- ^ "Cal Ripken's record breaking moment". Retrieved March 22, 2012.
- ^ Kepner, Tyler (April 17, 2011). "Ups and Downs of Two Top Picks". The New York Times. p. SP2. Archived from the original on April 28, 2011.
- ^ "Joe DiMaggio Hitting Streak by Baseball Almanac". Baseball-almanac.com. Retrieved February 20, 2011.
- ^ Jump up to: a b "9. Joe DiMaggio's 56-Game Hitting Streak – Unbreakable Baseball Records". LIFE.com. See Your World LLC. Archived from the original on May 5, 2010.
- ^ "56 game hitting streak – Joe DiMaggio (1941) – Unbreakable Baseball Records". SI.com. Retrieved November 26, 2011.
- ^ Stark, Jayson (May 15, 2011). "Baseball's unbreakable record". ESPN.com. Retrieved November 26, 2011.
- ^ "Does Ted Williams Own A More Impressive Streak Than Joe DiMaggio?".
- ^ Jump up to: a b Newsday, 20 fun facts about Joe DiMaggio's 56-game hit streak
- ^ Bleacher Report, Open Mic: Joe DiMaggio's 56-Game Hit Streak Is One Record That Will Go Untouched
- ^ http://www.baseball-almanac.com/players/player.php?p=ferrewe01
- ^ http://www.baseball-almanac.com/players/player.php?p=wilsoea01
- ^ http://www.baseball-almanac.com/hitting/hisachit1.shtml
- ^ "Career Leaders & Records for Sacrifice Hits". Baseball-Reference. Sports Reference LLC. Retrieved November 8, 2020.
- ^ Jump up to: a b "17. Rickey Henderson's 1,406 Career Steals – Unbreakable Baseball Records". LIFE.com. See Your World LLC. Archived from the original on May 5, 2010.
- ^ "Rickey Henderson Statistics and History". Baseball-Reference. Sports Reference LLC. Retrieved November 27, 2011.
- ^ "Year-by-Year Top-Tens Leaders & Records for Stolen Bases". Baseball-Reference.com. Sports Reference LLC. Retrieved October 18, 2019.
- ^ "Active Leaders & Records for Stolen Bases". Baseball-Reference. Sports Reference LLC. Retrieved November 8, 2020.
- ^ https://www.baseball-almanac.com/recbooks/rb_stbah.shtml
- ^ Chuck Klein, Baseball-reference.com
- ^ "Year-by-Year Top-Tens Leaders & Records for Assists as OF". Baseball-Reference.com. Retrieved November 8, 2020.
- ^ Jump up to: a b Career outfield assist leaders, Baseball-reference.com
- ^ Jump up to: a b "Most All-Star Games: 25 – Hank Aaron – Unbreakable Baseball Records". SI.com. Retrieved November 27, 2011.
- ^ "Jamie Moyer Statistics and History". Baseball-Reference.com. Sports Reference LLC. Retrieved November 18, 2013.
- ^ "Most Seasons on All-Star Roster". Baseball-Reference. Sports Reference LLC. Retrieved November 8, 2020.
- ^ Jump up to: a b "3. Connie Mack's Wins, Losses, Games Managed – Unbreakable Baseball Records". LIFE.com. See Your World LLC. Archived from the original on May 5, 2010.
- ^ https://www.baseball-reference.com/managers/mackco01.shtml
- ^ Jump up to: a b "Managerial Register and Leaders". Baseball-Reference. Sports Reference LLC. Retrieved June 26, 2021.
- ^ Tourtellotte, Shane (September 18, 2013). "The unbreakable records". The Hardball Times. Retrieved August 22, 2019.
- ^ Record crowd watches Dodgers v Red Sox exhibition.
- ^ Jump up to: a b Eduardo A. Encina, Taking a look back at baseball's lowest attended game before today, Baltimore Sun (April 29, 2015). Retrieved April 29, 2015.
- ^ Dan Connolly, Orioles start fast in empty park, emerge from surreal day with 8–2 win over White Sox, Baltimore Sun (April 29, 2015). Retrieved May 1, 2015.
External links[]
- Major League Baseball records
- Major League Baseball lists